Gold Digger: Investors are stashing a record amount of gold bars and coins as inflation fears bite
Gold bullion bars and coins are seen for sale at Manfra, Tordella and Brookes, Inc. January 9, 2003 in New York City. (Photo by Mario Tama/Getty Images)
Alas. After teasing gold bugs with a push through $1,840/oz over the past week, we are now back below ~$US1,800/oz.
Gold stocks can’t seem to catch a break. What gives?
I don’t get it. PM miners didn’t even get the windfall of the market when it went up. They’ve been hammered the whole time.
Now they get a levered hammering in a pullback?? Makes no fkn sense!!
— wokeless_DD (@afroeeee) January 27, 2022
Investors are growing increasingly pessimistic about non-interest-bearing assets, like gold, now that the Fed seems poised to deliver four or five rate hikes this year, OANDA senior market analyst Edward Moya says.
“Another round of economic data supported the tightening arguments as the US economy had the strongest year in decades, while omicron likely had a short-term impact on durable goods and pending home sales,” he says.
“Gold is vulnerable to further technical selling now that the $1800 level has been breached, with $1760 providing key support.
“Risk aversion will eventually lead to some flows back into bullion, but that won’t happen until this selloff is over.”
And yet gold demand is at 2-year highs
Gold demand reached 1,147 tonnes in Q4 2021 — its highest quarterly level since Q2 2019 and an increase of almost 50% year-on-year.
Annual demand recovered many of the COVID-induced losses from 2020 to reach 4,021t for the full year in 2021, the World Gold Council says.
Gold bar and coin demand rose 31% to an 8-year high of 1,180t as retail investors sought a safe haven from rising inflation and ongoing economic uncertainty caused by the coronavirus pandemic.

Meanwhile, the World Gold Council’s data series reported outflows of 173t in 2021 from gold-backed ETFs as some more tactical investors reduced hedges early in the year amid COVID vaccine rollouts, while rising interest rates made holding gold more expensive.
For the twelfth consecutive year, central banks were net purchasers of gold, adding 463t to their holdings, which was 82% higher than 2020.
“Gold’s performance [in 2021] truly underscored the value of its unique dual nature and the diverse demand drivers,” Louise Street, Senior Analyst EMEA at the World Gold Council says.
“On the investment side, the tug of war between persistent inflation and rising rates created a mixed picture for demand.
“Increasing rates fuelled a risk-on appetite among some investors, reflected in ETF outflows.
“On the other hand, a search for safe haven assets led to a rise in gold bar and coin purchases, buoyed by central bank buying.”
The World Gold council expect similar dynamics to influence gold’s performance in 2022 “with demand drivers fluctuating according to the relative dominance of key economic variables”,” Street says.
“How central banks deal with persistent high levels of inflation will be a key factor for institutional and retail demand in 2022,” she says.
“Meanwhile, the jewellery market’s current strength could be hampered if new COVID variants restrict consumer access again or continue if the economic recovery endures.”
Winners & Losers
Here’s how ASX-listed gold & silver stocks are performing:
Scroll or swipe to reveal table. Click headings to sort. Best viewed on a laptop
>> Stocks missing from this list? Email [email protected]
| CODE | COMPANY | 1 WEEK RETURN % | 1 MONTH RETURN % | 6 MONTH RETURN % | 1 YEAR RETURN % | SHARE PRICE | MARKET CAP |
|---|---|---|---|---|---|---|---|
| PNX | PNX Metals | 24.1% | -11.3% | -22.4% | -11.3% | 0.006 | $21,913,161 |
| GSR | Greenstone Resources | 17.2% | 21.4% | 70.0% | 30.8% | 0.034 | $28,247,754 |
| ASO | Aston Minerals | 12.9% | 78.6% | 20.7% | 414.7% | 0.175 | $162,213,563 |
| TMX | Terrain Minerals | 12.5% | 12.5% | 28.6% | -18.2% | 0.009 | $5,886,088 |
| CTO | Citigold Corp | 12.5% | 0.0% | -25.0% | -30.8% | 0.009 | $25,502,932 |
| CPM | Cooper metals | 11.9% | 88.6% | 0.0% | 0.0% | 0.33 | $7,970,900 |
| RGL | Riversgold | 10.5% | 23.5% | -41.7% | -58.8% | 0.021 | $8,888,928 |
| HMG | Hamelingold | 9.7% | 25.9% | 0.0% | 0.0% | 0.17 | $17,050,000 |
| SMI | Santana Minerals | 9.5% | 1.5% | 200.0% | 81.6% | 0.345 | $38,464,814 |
| MAU | Magnetic Resources | 4.3% | 3.4% | -2.0% | 6.4% | 1.5 | $334,270,800 |
| AWJ | Auric Mining | 4.3% | 26.3% | -14.3% | 0.0% | 0.12 | $6,728,323 |
| MHC | Manhattan Corp | 3.3% | 19.2% | 29.2% | -40.4% | 0.0155 | $22,894,180 |
| GWR | GWR Group | 2.9% | 44.0% | -53.8% | -52.7% | 0.18 | $51,606,831 |
| PF1 | Pathfinder Resources | 2.6% | 30.0% | 23.8% | 27.9% | 0.39 | $20,185,984 |
| BMO | Bastion Minerals | 2.6% | -16.7% | 14.3% | 0.0% | 0.2 | $14,985,852 |
| HRN | Horizon Gold | 1.1% | 10.0% | 10.0% | -10.0% | 0.44 | $46,944,487 |
| IPT | Impact Minerals | 0.0% | 0.0% | 7.7% | -33.3% | 0.014 | $26,309,334 |
| BBX | BBX Minerals | 0.0% | 20.0% | -26.5% | -46.3% | 0.18 | $80,503,758 |
| KAL | Kalgoorliegoldmining | 0.0% | 7.4% | 0.0% | 0.0% | 0.145 | $10,140,844 |
| MLS | Metals Australia | 0.0% | 0.0% | 0.0% | -33.3% | 0.002 | $10,477,115 |
| SIH | Sihayo Gold | 0.0% | -11.1% | -27.3% | -55.6% | 0.008 | $29,483,691 |
| TRY | Troy Resources | 0.0% | 0.0% | -17.8% | -59.3% | 0.037 | $31,631,563 |
| KGM | Kalnorth Gold | 0.0% | 0.0% | 0.0% | 0.0% | 0.013 | $11,625,121 |
| CGN | Crater Gold Min | 0.0% | 0.0% | 0.0% | -26.1% | 0.017 | $20,867,430 |
| GUL | Gullewa | 0.0% | -11.5% | -16.9% | -25.0% | 0.069 | $13,135,744 |
| CY5 | Cygnus Gold | 0.0% | 0.0% | 38.5% | 2.9% | 0.18 | $19,467,577 |
| GMN | Gold Mountain | 0.0% | -12.5% | -30.0% | -67.7% | 0.014 | $14,982,088 |
| TAM | Tanami Gold NL | 0.0% | -1.6% | -15.1% | -27.1% | 0.062 | $75,206,211 |
| GML | Gateway Mining | 0.0% | -6.7% | -22.2% | -56.3% | 0.014 | $29,381,383 |
| A1G | African Gold . | 0.0% | 21.1% | 27.9% | 4.4% | 0.23 | $24,376,617 |
| OAU | Ora Gold | 0.0% | 26.7% | 5.7% | -16.3% | 0.019 | $15,719,129 |
| GNM | Great Northern | 0.0% | 0.0% | -45.8% | -56.7% | 0.0065 | $10,254,306 |
| SVY | Stavely Minerals | -1.0% | -5.7% | 12.4% | -32.9% | 0.5 | $130,480,726 |
| ARV | Artemis Resources | -1.4% | -5.3% | 35.8% | -42.4% | 0.072 | $90,359,831 |
| TIE | Tietto Minerals | -2.0% | 8.9% | 36.1% | 11.4% | 0.49 | $340,640,061 |
| G50 | Gold50 | -2.0% | -2.0% | 0.0% | 0.0% | 0.245 | $12,043,870 |
| MEG | Megado | -2.3% | -14.1% | -26.1% | -52.8% | 0.085 | $3,831,343 |
| AAU | Antilles Gold | -2.6% | -3.8% | 4.2% | -9.4% | 0.075 | $21,888,357 |
| PRX | Prodigy Gold NL | -2.9% | -5.7% | -17.5% | -25.0% | 0.033 | $19,226,711 |
| TRM | Truscott Mining Corp | -2.9% | 0.0% | 0.0% | 83.3% | 0.033 | $5,014,071 |
| AGC | AGC | -3.1% | -5.0% | -38.7% | -51.3% | 0.095 | $6,366,365 |
| CYL | Catalyst Metals | -3.1% | -10.6% | -5.4% | -17.4% | 1.85 | $179,681,694 |
| AGS | Alliance Resources | -3.3% | -3.3% | -6.5% | -17.1% | 0.145 | $30,162,484 |
| TBA | Tombola Gold | -3.3% | 3.6% | -37.0% | -59.2% | 0.029 | $19,594,557 |
| BYH | Bryah Resources | -3.4% | 16.7% | -6.7% | -20.0% | 0.056 | $11,310,359 |
| ICL | Iceni Gold | -3.4% | -20.0% | -6.7% | 0.0% | 0.14 | $14,346,824 |
| GRL | Godolphin Resources | -3.6% | -3.6% | -18.2% | -48.1% | 0.135 | $10,934,478 |
| RND | Rand Mining | -3.8% | -3.1% | -6.3% | -26.1% | 1.405 | $79,910,725 |
| ZNC | Zenith Minerals | -4.0% | 60.0% | 44.0% | 125.0% | 0.36 | $123,769,496 |
| NMR | Native Mineral Res | -4.3% | -8.3% | 0.5% | -34.4% | 0.22 | $8,694,947 |
| OKU | Oklo Resources | -4.3% | -18.5% | -12.0% | -45.0% | 0.11 | $55,494,613 |
| RDN | Raiden Resources | -4.5% | 5.0% | -19.2% | -25.0% | 0.021 | $28,881,873 |
| SI6 | SI6 Metals | -4.5% | 16.7% | -19.2% | -56.3% | 0.0105 | $15,709,584 |
| BNZ | Benzmining | -4.8% | -7.7% | -29.4% | -55.2% | 0.6 | $28,278,744 |
| SMS | Starminerals | -4.8% | -4.8% | 0.0% | 0.0% | 0.2 | $5,250,000 |
| CBY | Canterbury Resources | -4.8% | -4.8% | -20.0% | -23.8% | 0.08 | $9,855,882 |
| GIB | Gibb River Diamonds | -5.0% | -5.0% | 33.3% | 1.3% | 0.076 | $15,017,171 |
| NSM | Northstaw | -5.1% | -3.4% | -20.0% | -40.4% | 0.28 | $11,837,465 |
| REZ | Resourc & En Grp | -5.2% | -5.2% | 83.3% | 10.0% | 0.055 | $24,990,289 |
| QML | Qmines | -5.2% | -11.3% | -14.1% | 0.0% | 0.275 | $16,697,637 |
| TG1 | Techgen Metals | -5.2% | -8.3% | -25.7% | 0.0% | 0.1375 | $5,878,192 |
| TBR | Tribune Res | -5.2% | -4.2% | -15.7% | -25.4% | 4.55 | $237,680,389 |
| YRL | Yandal Resources | -5.3% | -8.9% | -30.3% | -15.7% | 0.36 | $41,792,959 |
| PAK | Pacific American Hld | -5.3% | 12.5% | 13.4% | -22.9% | 0.018 | $8,123,916 |
| ANX | Anax Metals | -5.3% | 15.4% | 13.9% | 69.8% | 0.09 | $30,656,602 |
| M2R | Miramar | -5.6% | -8.1% | -2.9% | -41.4% | 0.17 | $8,468,553 |
| TLM | Talisman Mining | -5.6% | 9.7% | -15.0% | 82.8% | 0.17 | $30,977,017 |
| BC8 | Black Cat Syndicate | -5.6% | -0.8% | 2.6% | -27.3% | 0.585 | $81,668,530 |
| CWX | Carawine Resources | -5.7% | -5.7% | -28.3% | -31.3% | 0.165 | $22,495,167 |
| SSR | SSR Mining Inc. | -5.7% | -6.3% | 9.0% | 2.3% | 22.89 | $463,289,841 |
| PRU | Perseus Mining | -5.7% | -8.6% | -4.2% | 20.5% | 1.48 | $1,831,071,186 |
| TNR | Torian Resources | -5.9% | 45.5% | 18.5% | 6.7% | 0.032 | $35,493,620 |
| BCN | Beacon Minerals | -5.9% | 0.0% | -5.9% | -4.4% | 0.032 | $111,329,215 |
| BRV | Big River Gold | -5.9% | 2.1% | -38.5% | -38.8% | 0.24 | $52,666,188 |
| DEX | Duke Exploration | -5.9% | -8.6% | -48.4% | -49.2% | 0.16 | $14,433,784 |
| CDT | Castle Minerals | -6.0% | 58.0% | 182.1% | 295.0% | 0.0395 | $35,976,407 |
| IDA | Indiana Resources | -6.3% | -6.3% | -11.8% | -14.3% | 0.06 | $26,096,818 |
| MVL | Marvel Gold | -6.3% | -3.3% | 3.5% | 37.2% | 0.059 | $34,629,036 |
| EM2 | Eagle Mountain | -6.3% | 8.3% | -22.4% | 49.4% | 0.59 | $128,577,447 |
| WRM | White Rock Min | -6.4% | -8.3% | -55.1% | -54.2% | 0.22 | $34,164,174 |
| BGD | Bartongoldholdings | -6.5% | 3.6% | 7.5% | 0.0% | 0.215 | $18,455,599 |
| MAT | Matsa Resources | -6.6% | -3.4% | -16.2% | -48.1% | 0.057 | $20,460,413 |
| PRS | Prospech | -6.7% | -13.8% | -53.3% | -71.6% | 0.056 | $3,910,860 |
| KAI | Kairos Minerals | -6.7% | 7.7% | 3.7% | -12.5% | 0.028 | $52,976,524 |
| ENR | Encounter Resources | -6.7% | -15.2% | -9.0% | -0.2% | 0.14 | $45,938,440 |
| SNG | Siren Gold | -6.8% | 0.0% | 14.6% | -58.0% | 0.275 | $23,220,979 |
| G88 | Golden Mile Res | -6.9% | 10.2% | 8.0% | 22.7% | 0.054 | $8,996,953 |
| DTR | Dateline Resources | -6.9% | -4.7% | -22.9% | 62.0% | 0.081 | $35,034,540 |
| MTH | Mithril Resources | -7.1% | -18.8% | -31.6% | -39.5% | 0.013 | $33,543,030 |
| POL | Polymetals Resources | -7.1% | -3.7% | -10.3% | 0.0% | 0.13 | $5,203,385 |
| MBK | Metal Bank | -7.1% | -7.1% | -15.0% | -54.7% | 0.0065 | $18,254,727 |
| HRZ | Horizon | -7.4% | 0.0% | 8.7% | 13.6% | 0.125 | $68,157,024 |
| VMC | Venus Metals Cor | -7.5% | 8.8% | 2.8% | -15.9% | 0.185 | $26,438,770 |
| GBZ | GBM Rsources | -7.7% | 14.3% | -7.7% | -7.7% | 0.12 | $58,743,070 |
| THR | Thor Mining PLC | -7.7% | 0.0% | -20.0% | -40.0% | 0.012 | $10,066,729 |
| BAT | Battery Minerals | -7.7% | 9.1% | -29.4% | -69.2% | 0.012 | $25,822,110 |
| CXU | Cauldron Energy | -7.7% | -11.1% | -27.3% | -52.0% | 0.024 | $10,317,166 |
| ALY | Alchemy Resource | -7.7% | 9.1% | -12.4% | -23.3% | 0.012 | $11,428,139 |
| AGG | AngloGold Ashanti | -7.9% | -6.2% | -0.6% | -14.3% | 5.26 | $481,721,931 |
| STK | Strickland Metals | -7.9% | -15.9% | 18.4% | 69.2% | 0.058 | $75,506,597 |
| WCN | White Cliff Min | -8.0% | 43.8% | 53.3% | -8.0% | 0.023 | $11,863,928 |
| CDR | Codrus Minerals | -8.0% | -4.2% | -37.8% | 0.0% | 0.115 | $4,400,000 |
| PDI | Predictive Disc | -8.2% | -6.3% | 60.7% | 268.9% | 0.225 | $293,812,464 |
| AUC | Ausgold | -8.3% | -6.4% | 15.8% | -12.0% | 0.044 | $72,651,354 |
| GOR | Gold Road Res | -8.6% | -12.1% | 9.5% | 13.6% | 1.38 | $1,212,637,135 |
| CAZ | Cazaly Resources | -8.7% | -4.5% | -16.0% | -4.5% | 0.042 | $14,412,967 |
| CHZ | Chesser Resources | -8.7% | -12.5% | -27.6% | -47.5% | 0.105 | $51,687,352 |
| EMR | Emerald Res NL | -8.8% | -2.3% | 18.2% | 30.8% | 1.04 | $613,048,004 |
| OZM | Ozaurum Resources | -8.8% | 0.0% | 0.0% | 0.0% | 0.13 | $7,438,080 |
| ADT | Adriatic Metals | -8.9% | -1.2% | -11.2% | 21.2% | 2.46 | $507,111,455 |
| DCX | Discovex Res | -9.1% | 66.7% | 81.8% | 11.1% | 0.01 | $25,686,641 |
| AAR | Anglo Australian | -9.1% | 1.0% | 16.3% | -20.0% | 0.1 | $62,598,820 |
| RML | Resolution Minerals | -9.1% | -16.7% | -44.4% | -55.9% | 0.015 | $11,158,232 |
| KAU | Kaiser Reef | -9.1% | -4.8% | -23.6% | -50.6% | 0.2 | $24,484,143 |
| MXR | Maximus Resources | -9.1% | -4.1% | -1.4% | -48.1% | 0.07 | $22,253,387 |
| MEU | Marmota | -9.4% | 9.1% | 4.3% | 0.0% | 0.048 | $44,103,659 |
| TCG | Turaco Gold | -9.4% | 0.0% | 9.1% | 100.0% | 0.12 | $51,159,334 |
| EMU | EMU NL | -9.5% | 11.8% | -42.4% | -62.0% | 0.019 | $10,446,475 |
| ZAG | Zuleika Gold | -9.5% | 123.5% | 26.7% | -25.5% | 0.038 | $15,284,455 |
| KNB | Koonenberrygold | -9.7% | -15.2% | 0.0% | 0.0% | 0.14 | $10,376,272 |
| MTC | Metalstech | -10.0% | 0.0% | 45.4% | 74.5% | 0.27 | $43,332,793 |
| AQX | Alice Queen | -10.0% | -10.0% | -35.7% | -74.3% | 0.009 | $12,332,007 |
| GMR | Golden Rim Resources | -10.0% | -16.7% | -6.3% | -31.8% | 0.1125 | $27,056,115 |
| AVW | Avira Resources | -10.0% | -18.2% | -10.0% | -25.0% | 0.0045 | $7,734,555 |
| SBR | Sabre Resources | -10.0% | -10.0% | 12.5% | -43.8% | 0.0045 | $8,639,068 |
| PKO | Peako | -10.0% | -14.3% | -47.1% | -45.5% | 0.018 | $5,552,174 |
| KLA | Kirkland Lake Gold | -10.1% | -3.0% | -0.9% | 3.0% | 52.78 | $52,850,000 |
| SFR | Sandfire Resources | -10.1% | 4.3% | 4.3% | 43.6% | 6.625 | $2,709,980,313 |
| ALK | Alkane Resources | -10.1% | -13.0% | -26.3% | -4.2% | 0.8 | $464,555,068 |
| FML | Focus Minerals | -10.2% | -3.6% | 6.0% | -29.3% | 0.265 | $49,342,113 |
| CEL | Challenger Exp | -10.2% | 0.0% | -3.6% | -11.7% | 0.265 | $269,349,783 |
| HAW | Hawthorn Resources | -10.2% | 2.3% | 95.6% | -23.5% | 0.088 | $30,016,405 |
| DTM | Dart Mining NL | -10.2% | 4.4% | -35.8% | -54.9% | 0.0835 | $10,830,711 |
| ARL | Ardea Resources | -10.5% | 21.4% | 27.3% | 22.5% | 0.595 | $81,215,678 |
| MGV | Musgrave Minerals | -10.6% | -16.9% | -6.3% | -20.3% | 0.295 | $153,094,290 |
| AMI | Aurelia Metals | -10.6% | -4.5% | 3.7% | 0.0% | 0.42 | $544,304,841 |
| WMC | Wiluna Mining Corp | -10.8% | 2.4% | 1.9% | -23.8% | 1.07 | $225,050,416 |
| NXM | Nexus Minerals | -10.8% | -19.6% | 320.5% | 196.0% | 0.37 | $93,585,706 |
| MZZ | Matador Mining | -11.0% | -5.8% | -19.8% | 6.6% | 0.325 | $72,352,805 |
| STN | Saturn Metals | -11.0% | -14.1% | -20.7% | -33.6% | 0.365 | $48,920,350 |
| ICG | Inca Minerals | -11.0% | -15.2% | -8.2% | 1.1% | 0.089 | $43,309,048 |
| MCT | Metalicity | -11.1% | -11.1% | -27.3% | -52.9% | 0.008 | $20,003,419 |
| E2M | E2 Metals | -11.1% | -17.2% | -29.4% | -57.1% | 0.24 | $36,113,091 |
| AME | Alto Metals | -11.3% | -12.2% | -3.4% | -18.1% | 0.086 | $45,411,226 |
| LYN | Lycaonresources | -11.4% | 21.9% | 0.0% | 0.0% | 0.39 | $10,935,000 |
| WGX | Westgold Resources. | -11.4% | -10.9% | 1.4% | -24.5% | 1.79 | $778,657,984 |
| BDC | Bardoc Gold | -11.5% | -12.4% | 14.2% | -21.3% | 0.425 | $125,011,300 |
| DGO | DGO Gold | -11.7% | -0.4% | -19.7% | -6.7% | 2.65 | $225,388,202 |
| RXL | Rox Resources | -11.9% | 29.0% | 6.0% | -12.7% | 0.445 | $70,923,426 |
| DRE | Drednought Resources | -11.9% | -2.6% | -14.0% | 68.2% | 0.037 | $93,627,057 |
| LCL | Los Cerros | -12.0% | -8.3% | -33.3% | -35.3% | 0.11 | $70,190,049 |
| VAN | Vango Mining | -12.0% | -21.4% | -34.3% | -39.7% | 0.044 | $51,657,443 |
| TRN | Torrens Mining | -12.1% | -17.1% | -47.3% | -39.6% | 0.145 | $9,753,091 |
| RVR | Red River Resources | -12.2% | -2.7% | -12.2% | -30.8% | 0.18 | $93,323,608 |
| LRL | Labyrinth Resources | -12.2% | 2.9% | 9.1% | -21.7% | 0.036 | $32,173,764 |
| NWM | Norwest Minerals | -12.3% | -1.5% | -22.9% | -24.2% | 0.064 | $11,920,082 |
| HCH | Hot Chili | -12.4% | -2.7% | -12.2% | -18.8% | 1.625 | $174,949,387 |
| GED | Golden Deeps | -12.5% | -12.5% | -12.5% | -4.5% | 0.0105 | $8,534,366 |
| CST | Castile Resources | -12.5% | -7.9% | -7.9% | -7.9% | 0.175 | $33,950,721 |
| XAM | Xanadu Mines | -12.5% | -3.4% | -20.0% | -22.2% | 0.028 | $35,380,737 |
| M24 | Mamba Exploration | -12.5% | 5.0% | 13.5% | 0.0% | 0.21 | $8,651,501 |
| AYM | Australia United Min | -12.5% | -12.5% | -22.2% | 0.0% | 0.007 | $12,898,042 |
| MML | Medusa Mining | -12.8% | -7.9% | -29.9% | -23.2% | 0.645 | $137,251,159 |
| SBM | St Barbara | -13.0% | -12.4% | -30.4% | -45.6% | 1.235 | $876,265,906 |
| TTM | Titan Minerals | -13.0% | 2.0% | -16.7% | -9.1% | 0.1 | $140,972,053 |
| MKR | Manuka Resources. | -13.0% | -6.3% | 7.1% | -22.1% | 0.3 | $30,447,319 |
| LCY | Legacy Iron Ore | -13.0% | -13.0% | 33.3% | -39.4% | 0.02 | $128,136,524 |
| AQI | Alicanto Min | -13.0% | -16.7% | -37.5% | -16.7% | 0.1 | $38,271,362 |
| PNM | Pacific Nickel Mines | -13.0% | 25.0% | 63.9% | 61.3% | 0.1 | $26,280,097 |
| KSN | Kingston Resources | -13.2% | -7.8% | -29.8% | -42.2% | 0.1475 | $49,938,638 |
| NST | Northern Star | -13.3% | -9.1% | -14.0% | -36.3% | 8.44 | $9,922,487,415 |
| PUA | Peak Minerals | -13.3% | -8.6% | -23.0% | -45.8% | 0.013 | $13,537,801 |
| KZR | Kalamazoo Resources | -13.5% | -12.3% | -13.5% | -43.9% | 0.32 | $46,462,200 |
| RED | Red 5 | -13.6% | -8.9% | 37.8% | 18.9% | 0.255 | $589,090,163 |
| SAU | Southern Gold | -13.6% | 0.0% | -9.5% | -45.7% | 0.057 | $12,799,725 |
| CMM | Capricorn Metals | -13.7% | -3.8% | 67.8% | 81.2% | 3.08 | $1,151,649,897 |
| MM8 | Medallion Metals. | -13.7% | 4.8% | -15.4% | 0.0% | 0.22 | $23,770,107 |
| AL8 | Alderan Resource | -13.8% | -28.6% | -46.8% | -76.2% | 0.025 | $11,064,718 |
| MDI | Middle Island Res | -13.8% | 13.6% | 13.6% | -58.3% | 0.125 | $15,302,278 |
| AZS | Azure Minerals | -13.8% | 15.7% | 72.3% | -27.0% | 0.405 | $111,864,860 |
| TSO | Tesoro Resources | -14.0% | -1.3% | -52.3% | -72.1% | 0.074 | $41,585,809 |
| BGL | Bellevue Gold | -14.0% | -12.4% | -21.7% | -28.2% | 0.74 | $742,573,210 |
| CHN | Chalice Mining | -14.0% | -13.4% | 16.5% | 70.7% | 7.56 | $2,573,920,187 |
| MOH | Moho Resources | -14.1% | -14.1% | -19.1% | -37.5% | 0.055 | $6,791,872 |
| DDD | 3D Resources | -14.3% | 0.0% | -25.0% | -27.4% | 0.003 | $11,641,116 |
| RDS | Redstone Resources | -14.3% | -20.0% | 0.0% | 0.0% | 0.012 | $7,908,990 |
| RDT | Red Dirt Metals | -14.3% | 0.8% | 300.0% | 158.8% | 0.66 | $158,359,137 |
| ARN | Aldoro Resources | -14.3% | -10.8% | -25.0% | 34.7% | 0.33 | $28,620,348 |
| AXE | Archer Materials | -14.3% | -5.3% | -26.4% | 29.5% | 1.075 | $235,188,847 |
| SVL | Silver Mines | -14.6% | -6.8% | -4.7% | -4.7% | 0.205 | $258,366,429 |
| KTA | Krakatoa Resources | -14.8% | 10.6% | 8.3% | -27.8% | 0.052 | $15,324,916 |
| NML | Navarre Minerals | -14.9% | 1.3% | -16.7% | -54.3% | 0.08 | $107,809,100 |
| NCM | Newcrest Mining | -14.9% | -9.6% | -16.0% | -16.6% | 21.74 | $18,780,319,606 |
| MKG | Mako Gold | -15.0% | -19.0% | -8.6% | -29.2% | 0.085 | $31,343,811 |
| BMR | Ballymore Resources | -15.0% | -2.9% | 0.0% | 0.0% | 0.17 | $12,491,274 |
| AWV | Anova Metals | -15.0% | -15.0% | -10.5% | -29.2% | 0.017 | $24,362,601 |
| BRB | Breaker Res NL | -15.1% | -22.4% | 45.2% | 15.4% | 0.225 | $71,685,004 |
| SRN | Surefire Rescs NL | -15.4% | 10.0% | -21.4% | -54.2% | 0.011 | $12,147,414 |
| DCN | Dacian Gold | -15.5% | -6.6% | -29.0% | -64.1% | 0.1775 | $189,888,486 |
| AUT | Auteco Minerals | -15.6% | 7.0% | -33.9% | -43.7% | 0.076 | $126,613,420 |
| IVR | Investigator Res | -15.7% | -15.7% | -4.8% | -15.7% | 0.059 | $78,348,850 |
| RMS | Ramelius Resources | -15.8% | -13.3% | -19.9% | -14.1% | 1.305 | $1,240,360,706 |
| EVN | Evolution Mining | -15.9% | -13.4% | -16.1% | -25.6% | 3.49 | $6,342,206,583 |
| SFM | Santa Fe Minerals | -15.9% | 42.3% | 120.2% | 96.8% | 0.185 | $13,471,476 |
| HXG | Hexagon Energy | -16.0% | -14.9% | -12.5% | -45.2% | 0.063 | $28,098,871 |
| LM8 | Lunnonmetals | -16.4% | 102.6% | 51.9% | 0.0% | 0.79 | $60,514,123 |
| MRZ | Mont Royal Resources | -16.4% | -10.3% | 41.9% | 1.7% | 0.305 | $17,792,465 |
| LNY | Laneway Res | -16.7% | -16.7% | 0.0% | -28.6% | 0.005 | $26,934,396 |
| RMX | Red Mount Min | -16.7% | 11.1% | 11.1% | -37.5% | 0.01 | $14,644,583 |
| KWR | Kingwest Resources | -16.7% | -2.8% | 124.4% | -5.4% | 0.175 | $40,090,549 |
| KCN | Kingsgate Consolid. | -16.8% | -0.8% | 133.7% | 94.4% | 1.905 | $401,696,622 |
| CAI | Calidus Resources | -17.1% | 17.5% | 50.0% | 62.1% | 0.705 | $276,182,860 |
| FFX | Firefinch | -17.1% | -12.7% | 61.7% | 235.9% | 0.655 | $742,225,806 |
| CLA | Celsius Resource | -17.1% | 52.6% | -19.4% | -44.2% | 0.029 | $29,511,386 |
| RRL | Regis Resources | -17.1% | -8.4% | -29.3% | -50.8% | 1.74 | $1,320,858,522 |
| KCC | Kincora Copper | -17.2% | 0.0% | -47.8% | 0.0% | 0.12 | $8,773,094 |
| PGD | Peregrine Gold | -17.6% | 17.0% | 14.4% | 0.0% | 0.515 | $16,129,822 |
| NAE | New Age Exploration | -17.6% | 27.3% | 16.7% | 7.7% | 0.014 | $18,666,686 |
| OKR | Okapi Resources | -17.6% | -23.3% | -23.3% | 33.3% | 0.28 | $29,847,413 |
| OBM | Ora Banda Mining | -18.2% | -18.2% | -58.5% | -82.9% | 0.054 | $54,556,572 |
| S2R | S2 Resources | -18.2% | -2.7% | 20.0% | -10.0% | 0.18 | $65,929,348 |
| DLC | Delecta | -18.2% | -18.2% | 63.6% | 28.6% | 0.009 | $10,844,178 |
| BEZ | Besragoldinc | -18.5% | 15.8% | 0.0% | 0.0% | 0.11 | $18,903,496 |
| PNR | Pantoro | -18.6% | -18.6% | 39.0% | 16.3% | 0.285 | $401,707,129 |
| SLR | Silver Lake Resource | -18.7% | -13.0% | 3.4% | -8.0% | 1.5 | $1,359,603,966 |
| TMZ | Thomson Res | -19.0% | 13.3% | -35.2% | -47.7% | 0.068 | $39,331,392 |
| GBR | Greatbould Resources | -19.1% | 1.9% | 61.8% | 187.5% | 0.1375 | $44,654,476 |
| SLZ | Sultan Resources | -19.5% | 0.0% | -13.2% | -17.5% | 0.165 | $11,125,502 |
| FG1 | Flynngold | -19.7% | -4.7% | -10.3% | 0.0% | 0.1525 | $9,832,588 |
| GTR | Gti Resources | -20.0% | -16.7% | 26.9% | -20.1% | 0.02 | $21,446,843 |
| ERM | Emmerson Resources | -20.0% | -14.3% | 76.5% | 71.4% | 0.12 | $57,297,426 |
| TSC | Twenty Seven Co. | -20.0% | 0.0% | 0.0% | -33.3% | 0.004 | $10,643,256 |
| TAR | Taruga Minerals | -20.0% | -7.7% | -30.8% | -28.0% | 0.036 | $20,482,400 |
| MRR | Minrex Resources | -20.3% | 63.9% | 227.8% | 145.8% | 0.059 | $38,060,044 |
| LEX | Lefroy Exploration | -20.3% | 0.0% | -57.2% | 47.5% | 0.295 | $43,762,400 |
| VKA | Viking Mines | -20.6% | -10.0% | -38.6% | -63.5% | 0.0135 | $13,328,360 |
| PUR | Pursuit Minerals | -20.7% | -11.5% | -63.5% | -39.5% | 0.023 | $22,693,181 |
| WAF | West African Res | -20.9% | -18.2% | 2.6% | 13.6% | 1.0675 | $1,092,228,014 |
| WWI | West Wits Mining | -20.9% | 6.3% | -51.1% | -49.0% | 0.034 | $62,499,904 |
| NVA | Nova Minerals | -21.0% | -22.4% | -23.0% | -52.2% | 0.885 | $154,973,965 |
| MEI | Meteoric Resources | -21.1% | -16.7% | -69.4% | -79.7% | 0.015 | $22,894,461 |
| SPQ | Superior Resources | -21.1% | 104.5% | 200.0% | 164.7% | 0.045 | $71,217,034 |
| A8G | Australasian Metals | -21.6% | 9.4% | 255.9% | 0.0% | 0.525 | $19,683,542 |
| AM7 | Arcadia Minerals | -21.7% | 11.9% | 30.6% | 0.0% | 0.235 | $7,582,834 |
| NES | Nelson Resources. | -21.9% | -21.9% | -49.4% | -68.9% | 0.025 | $4,857,305 |
| DEG | De Grey Mining | -21.9% | -3.0% | -1.3% | 16.6% | 1.125 | $1,638,483,407 |
| NAG | Nagambie Resources | -22.2% | -18.3% | -38.8% | -2.0% | 0.049 | $24,496,685 |
| RSG | Resolute Mining | -22.2% | -25.3% | -50.4% | -60.8% | 0.28 | $303,581,168 |
| FAU | First Au | -23.1% | 11.1% | -16.7% | -47.4% | 0.01 | $7,839,109 |
| BTR | Brightstar Resources | -23.1% | 16.3% | 108.3% | -15.3% | 0.05 | $25,155,600 |
| ADN | Andromeda Metals | -23.5% | 4.2% | 10.3% | -33.0% | 0.1875 | $471,908,139 |
| ADV | Ardiden | -23.7% | 31.8% | 70.6% | -42.0% | 0.0145 | $30,356,695 |
| NPM | Newpeak Metals | -25.0% | -25.0% | -25.0% | -50.0% | 0.0015 | $7,649,750 |
| SKY | SKY Metals | -25.0% | -4.5% | 9.4% | -40.0% | 0.105 | $37,678,347 |
| ANL | Amani Gold | -25.0% | 0.0% | 0.0% | 50.0% | 0.0015 | $22,875,564 |
| AZL | Arizona Lithium | -25.7% | 52.8% | 391.1% | 252.6% | 0.1375 | $269,381,481 |
| KRM | Kingsrose Mining | -26.0% | -10.8% | 37.0% | 51.0% | 0.074 | $52,254,056 |
| HMX | Hammer Metals | -26.8% | 13.0% | -38.1% | -40.2% | 0.052 | $43,194,715 |
| VRC | Volt Resources | -26.9% | -26.9% | -40.6% | 0.0% | 0.019 | $48,172,989 |
| AAJ | Aruma Resources | -27.0% | 21.7% | 42.4% | -6.7% | 0.084 | $10,454,805 |
| GSM | Golden State Mining | -28.0% | 9.8% | -37.9% | -45.5% | 0.09 | $7,477,919 |
| BNR | Bulletin Res | -28.6% | 44.9% | 75.3% | 22.3% | 0.1 | $25,535,297 |
| XTC | Xantippe Res | -30.8% | 80.0% | 500.0% | 260.0% | 0.009 | $41,896,711 |
| GSN | Great Southern | -31.3% | -35.3% | -4.3% | -43.6% | 0.044 | $23,424,152 |
There weren’t many winners this week.
The large producers in particular were unfairly punished. Is this a buying opportunity?
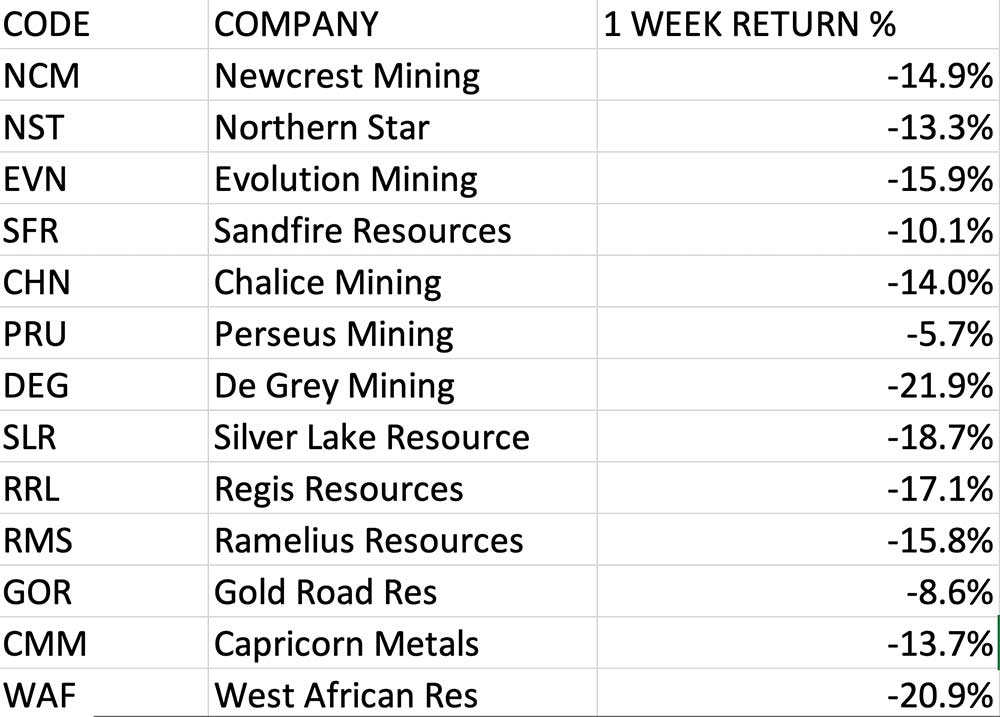
Despite rising production costs and associated COVID struggles these miners are still making good profits (and paying decent dividends).
African gold miner Perseus (ASX:PRU) pushed gold production up 14% quarter on quarter to 128,378oz, with its 2021 output a massive 66% up year on year to 432,410oz.
Its costs fell on the higher production rate as well, with the company’s weighted all in sustaining costs decreased 3% of US$32/oz quarter on quarter to US$934/oz and 5% lower year on year to US$985/oz.
St Barbara (ASX:SBM) produced 65,523oz at $1587/oz in the December quarter, selling its gold bounty at an average margin of $836/oz with realised prices of $2423/oz.
Evolution Mining (ASX:EVN) produced 148,084oz of gold in the December quarter at lower all in sustaining costs of $1,347/oz, led by a big fall in costs from sustaining capex at the flagship Cowal mine in New South Wales, despite as much as 15% of its workforce being absent at times after contracting Covid or isolating as close contacts.
That was down from 170,681oz at $1413/oz in the September quarter, along with lower silver and copper production, but generated a 5% increase in operating mine cash flow to $202.7 million despite the sale of the Mt Carlton mine to Navarre Minerals (ASX:NML).
Evolution stock tumbled 16% on the weaker production numbers and a big drop in gold stocks generally after US Fed chair Jerome Powell confirmed the likelihood of interest rate rises to tame runaway inflation from March.
But EVN boss Jake Klein presented the news with a brave face, saying gold remained a standout commodity despite jitters that have impacted gold miners since the start of 2021.
“The gold price is over $2500/oz. I did reflect on the fact that when I started in the industry it was $300/oz, so if we’re not happy at $2500/oz we need to find another sector to operate in,” he said.
Related Topics

Related Stories


UNLOCK INSIGHTS
Discover the untold stories of emerging ASX stocks.
Daily news and expert analysis, it's free to subscribe.
By proceeding, you confirm you understand that we handle personal information in accordance with our Privacy Policy.


