Gold Digger: Investors are falling in love with junior ASX gold stocks again
Pic: Nastco, iStock / Getty Images Plus
- Gold price volatile, but holding up quite well: OANDA’s Jeffrey Halley
- Junior gold stocks are moving the needle again
- This weeks biggest winners: Metalstech, Tombola Gold, Castile Resources, Ballymore Resources
Our Gold Digger column wraps all the news driving ASX stocks with exposure to precious metals.
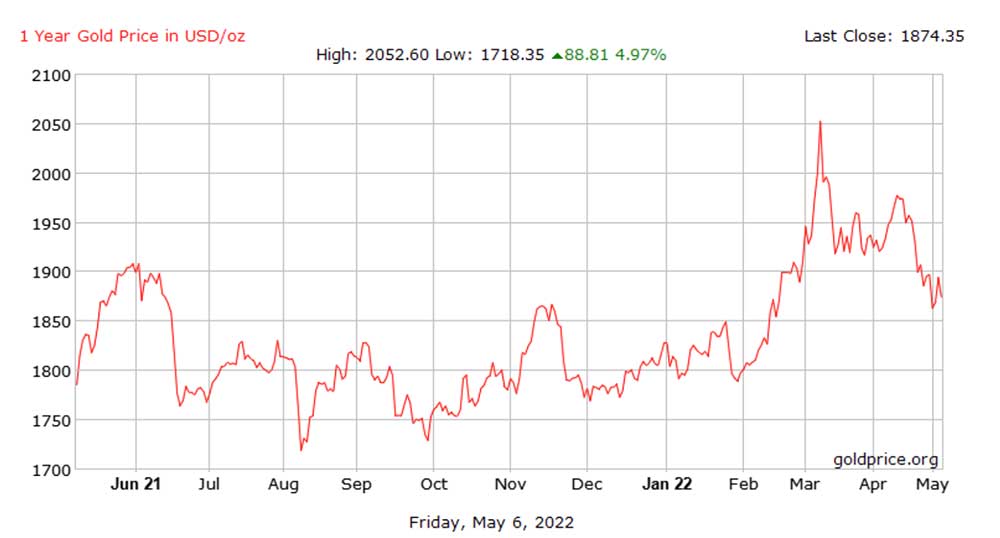
What a wild week for gold
Gold hit a 3-month low early in the week as traders priced in a super aggressive Fed tightening, which didn’t materialise.
On Thursday, the Fed hiked by 0.50%, and eased concerns around future 0.75% hikes. Gold jumped sharply to $US1881.50 an ounce in response, before continuing its rally in Asia, gaining an impressive 1.10% to $US1901.65 by close of play.
That rally didn’t last long, but gold continues to hold up quite well, says OANDA senior market analyst Jeffrey Halley.
“Gold staged quite an impressive rally in early trading yesterday, but as the US Dollar soared, it gave back all those gains to finish 0.23% lower at $1877.00 an ounce, where it remains in moribund Asian trading,” he said late Friday.
“Still, given the moves seen in other asset classes, gold is holding up reasonably well.
“It is steady despite US 10-year yields moving above 3.0% once again, and it is definitely outperforming Bitcoin right now.”
That said gold needs to close above resistance at $US1920, and preferably $US1960 an ounce, to get the gold bugs excited again, Halley says.
“I see more whipsaw trading ranges in the days ahead,” he says.
“Gold looks set to vacillate around its 100-day moving average, today at $1881.65, in a wide but real range of $1850.00 to $1920.00 an ounce, for the time being.”
Speccy gold stocks are stirring
For the first time in a long time, good news stories are moving the dial on junior ASX gold stocks.
Metalstech (ASX:MTC) led the pack last week on latest infill drilling results out of the 1.5Moz gold, 10.93Moz silver ‘Sturec’ mine in Slovakia, which included 173.2m grading 3.27g/t gold and 11.8g/t silver from surface.
This intersection is not true thickness, the company says, which is always the width of the vein/orebody etc at its narrowest point. Resource modelling suggests the true thickness on mineralisation in this area is about 55m, which is still excellent.
This ongoing drilling program was designed to increase confidence in the existing resource (infill drilling), as well as extend mineralisation to the south (extensional drilling).
MTC has an exploration target of between 2.2Moz and 5.1Moz of gold eq, which is in addition to the existing resource.
A scoping study – the first proper look at the economics of building a project — is due this quarter.
Ballymore Resources (ASX:BMR) could have some exciting news in the pipeline.
BMR hit the bourse late last year with a portfolio of Queensland gold and base metals projects including ‘Dittmer’ (a historic high-grade goldfield), ‘Ruddygore’ (a large copper-gold porphyry target) and ‘Ravenswood’ (a bunch of drill ready targets in a 17Moz gold province).
The company is currently punching deep holes in Ruddygore: a large 1,000m by 300m target corresponding closely with a strong, +500ppm copper-in-soil anomaly and extensive historic workings.
The early signs are positive.
“Drilling to date has encountered broad zones of strongly altered and brecciated granodiorite with extensive quartz-carbonate-pyrite chalcopyrite-sphalerite veining and breccia infill,” BMR said Friday.
Emphasis ours. Chalcopyrite is the most abundant copper ore mineral, while sphalerite is the most important ore of zinc.
Drilling at Ruddygore will continue this quarter with initial drill assay results expected in May, BMR says.
Tombola Gold (ASX:TBA) remains on track for first gold production and cashflow from its Mt Freda Complex in Queensland in Q3 this year.
Mt Freda is expected to produce ~64,000oz of gold over an initial 30-month life of mine, it says. At a gold price of $2,285/oz Aussie (currently $2,600/oz), TBA expects to make a nice $79m profit.
This week it hit some visual copper-cobalt right next door at the ‘Little Duke’ project.
“We are very excited with the significance of this drill hole,” TBA managing director Byron Miles says.
“The 170m of mineralisation from 70m beneath surface has the potential to establish this project as a very large target for the copper, gold and cobalt operation located proximate to our flagship Mt Freda Gold Mine that is expected to produce initial gold over the coming months.”
Last weekend noted analyst Warwick Grigor from Far East Capital called Castile Resources (ASX:CST) “a great example of a company with a sound development project that has been largely overlooked by the market”.
“I can only see upside from these prices,” he says.
“A recent note by Petra Capital analyst, David Brennan, has a share price target of 65¢. That is 260% higher than the market price last week.”
In 2020, Top 10 Aussie gold producer Westgold Resources (ASX:WGX) spun its Northern Territory gold-base metal assets into Castile, which hit the bourse with a market cap of about $40m.
Castile’s high-grade – but deep — Rover 1 iron oxide-copper-gold discovery was gathering dust in the basement of Westgold’s portfolio for several years. But no longer.
Rover 1 has a 4.7 Mt resource grading at 1.73 gpt gold, 1.63% copper and 0.08% cobalt for 242,00oz gold, 63,400t copper and 2,900t cobalt.
“The tonnage has shrunk a little but the quality of the resource has improved, as has the copper grade,” Grigor says.
“This is sufficient for an eight year mine life, but we would expect extensions to this figure.”
The company is scheduled to release its PFS in about six weeks.
Total capital expenditure is estimated to be $130m according to a research note released by Petra Capital, with the processing plant accounting for $80m.
“All up operating costs are estimated to be $220 pt, which is less than half of the anticipated revenue on recent metals prices of $560 pt,” Grigor says.
“This suggests an operating margin in the order of $150m p.a.”
Winners & Losers
Here’s how ASX-listed gold & silver stocks are performing:
Scroll or swipe to reveal table. Click headings to sort. Best viewed on a laptop
>> Stocks missing from this list? Email [email protected]
| CODE | COMPANY | 1 WEEK RETURN % | 1 MONTH RETURN % | 6 MONTH RETURN % | 1 YEAR RETURN % | PRICE | MARKET CAP |
|---|---|---|---|---|---|---|---|
| MTC | Metalstech Ltd | 50% | 6% | 9% | 288% | 0.36 | $56,665,960.60 |
| SIH | Sihayo Gold Limited | 33% | -20% | -56% | -69% | 0.004 | $14,741,845.65 |
| BMR | Ballymore Resources | 30% | 23% | 4% | 0% | 0.24 | $17,634,739.44 |
| PKO | Peako Limited | 22% | 10% | 0% | -45% | 0.022 | $7,402,898.42 |
| TBA | Tombola Gold Ltd | 20% | 48% | 91% | 30% | 0.065 | $54,377,895.26 |
| CST | Castile Resources | 16% | 23% | -10% | -23% | 0.215 | $42,937,676.02 |
| TG1 | Techgen Metals Ltd | 15% | 3% | -35% | -43% | 0.15 | $6,749,035.73 |
| SMI | Santana Minerals Ltd | 15% | 56% | 268% | 534% | 0.92 | $125,342,237.16 |
| STK | Strickland Metals | 14% | 49% | -9% | 229% | 0.079 | $101,186,320.50 |
| DCX | Discovex Res Ltd | 14% | 0% | 45% | 14% | 0.008 | $20,549,312.61 |
| AYM | Australia United Min | 14% | 14% | -11% | -11% | 0.008 | $12,898,042.40 |
| TNR | Torian Resources Ltd | 14% | 32% | 18% | -33% | 0.033 | $44,219,202.06 |
| TMX | Terrain Minerals | 10% | -15% | 38% | 10% | 0.011 | $8,093,371.10 |
| OGC | OceanaGold Corp. | 10% | 15% | 34% | 62% | 3.485 | $255,225,035.01 |
| MRZ | Mont Royal Resources | 9% | 7% | -23% | -5% | 0.36 | $25,138,481.63 |
| FFX | Firefinch Ltd | 8% | -14% | 63% | 175% | 1.045 | $1,317,086,191.42 |
| GBR | Greatbould Resources | 7% | -16% | -32% | -5% | 0.105 | $41,765,345.13 |
| CHN | Chalice Mining Ltd | 7% | -2% | 9% | 3% | 7.02 | $2,549,068,543.32 |
| S2R | S2 Resources | 6% | -8% | 0% | -11% | 0.165 | $57,019,976.80 |
| MEU | Marmota Limited | 6% | 23% | 17% | 26% | 0.054 | $55,864,635.01 |
| SMS | Starmineralslimited | 5% | 5% | 14% | 0% | 0.21 | $5,512,500.00 |
| AWJ | Auric Mining | 5% | 6% | -25% | -49% | 0.09 | $4,821,964.70 |
| OZM | Ozaurum Resources | 5% | 44% | 8% | 15% | 0.1725 | $9,154,560.00 |
| MDI | Middle Island Res | 4% | 12% | 47% | 8% | 0.14 | $17,138,551.08 |
| FG1 | Flynngold | 4% | -29% | -15% | 0% | 0.145 | $9,929,462.75 |
| CBY | Canterbury Resources | 3% | -9% | -44% | -38% | 0.062 | $7,638,308.86 |
| HAV | Havilah Resources | 3% | -8% | -3% | -14% | 0.18 | $58,863,283.83 |
| NML | Navarre Minerals Ltd | 2% | 1% | 0% | -25% | 0.09 | $126,914,510.14 |
| MZZ | Matador Mining Ltd | 2% | -13% | -34% | -36% | 0.245 | $53,169,778.73 |
| MM8 | Medallion Metals. | 2% | -15% | 24% | 0% | 0.255 | $26,509,914.00 |
| GCY | Gascoyne Res Ltd | 2% | -5% | -18% | -53% | 0.27 | $119,258,734.00 |
| GCY | Gascoyne Res Ltd | 2% | -5% | -18% | -53% | 0.27 | $119,258,734.00 |
| ALK | Alkane Resources Ltd | 2% | -18% | 14% | 18% | 1.005 | $619,406,756.80 |
| AGG | AngloGold Ashanti | 1% | -10% | 12% | 2% | 5.58 | $526,325,813.50 |
| PRU | Perseus Mining Ltd | 1% | 4% | 21% | 59% | 1.9325 | $2,492,818,262.94 |
| BGL | Bellevue Gold Ltd | 1% | -7% | 9% | -3% | 0.93 | $1,010,781,904.86 |
| SSR | SSR Mining Inc. | 0% | 6% | 30% | 43% | 30.23 | $620,099,424.00 |
| NPM | Newpeak Metals | 0% | 0% | -33% | -50% | 0.001 | $8,849,750.03 |
| NMR | Native Mineral Res | 0% | -7% | -14% | -40% | 0.19 | $7,943,119.20 |
| MKG | Mako Gold | 0% | -10% | -12% | -18% | 0.082 | $32,108,294.57 |
| IPT | Impact Minerals | 0% | -5% | -19% | -29% | 0.011 | $26,285,539.03 |
| CWX | Carawine Resources | 0% | 0% | 8% | -30% | 0.21 | $28,945,212.87 |
| RND | Rand Mining Ltd | 0% | -4% | 7% | 6% | 1.5 | $85,313,941.50 |
| CAZ | Cazaly Resources | 0% | -5% | -9% | -28% | 0.039 | $14,832,871.72 |
| DRE | Dreadnought Resources Ltd | 0% | -13% | 8% | 100% | 0.042 | $119,224,709.14 |
| GMR | Golden Rim Resources | 0% | -3% | -24% | -59% | 0.068 | $21,241,714.62 |
| TRY | Troy Resources Ltd | 0% | 0% | 0% | -45% | 0.037 | $31,631,563.33 |
| KGM | Kalnorth Gold Ltd | 0% | 0% | 0% | 0% | 0.013 | $11,625,120.78 |
| CGN | Crater Gold Min Ltd | 0% | 0% | 0% | -11% | 0.017 | $21,063,473.65 |
| TSC | Twenty Seven Co. Ltd | 0% | 0% | -20% | -20% | 0.004 | $7,982,441.72 |
| CY5 | Cygnus Gold Limited | 0% | -9% | 0% | 3% | 0.155 | $18,287,723.83 |
| AGS | Alliance Resources | 0% | -3% | -6% | 5% | 0.175 | $40,953,448.03 |
| VMC | Venus Metals Cor Ltd | 0% | -3% | 6% | 6% | 0.19 | $29,460,343.19 |
| RMX | Red Mount Min Ltd | 0% | 0% | -10% | -10% | 0.009 | $14,781,274.72 |
| PF1 | Pathfinder Resources | 0% | 0% | 75% | 108% | 0.5 | $26,560,505.00 |
| SI6 | SI6 Metals Limited | 0% | 0% | -9% | -17% | 0.01 | $14,281,439.85 |
| AGC | AGC Ltd | 0% | 9% | -14% | -34% | 0.095 | $6,434,091.98 |
| THR | Thor Mining PLC | 0% | -18% | -13% | 0% | 0.014 | $14,194,478.63 |
| CDR | Codrus Minerals Ltd | 0% | -8% | -39% | 0% | 0.091 | $3,440,000.00 |
| POL | Polymetals Resources | 0% | 13% | 0% | 0% | 0.135 | $5,407,636.41 |
| KAI | Kairos Minerals Ltd | 0% | 0% | -6% | 7% | 0.029 | $58,862,804.73 |
| BRV | Big River Gold Ltd | 0% | 19% | 42% | -9% | 0.34 | $74,924,275.10 |
| GML | Gateway Mining | 0% | 0% | -29% | -52% | 0.012 | $27,121,276.40 |
| SAU | Southern Gold | 0% | -13% | -26% | -44% | 0.048 | $10,239,780.29 |
| XAM | Xanadu Mines Ltd | 0% | -16% | 11% | -48% | 0.031 | $43,780,066.67 |
| AQI | Alicanto Min Ltd | 0% | -5% | -37% | -30% | 0.095 | $36,740,507.23 |
| MBK | Metal Bank Ltd | 0% | 0% | -25% | -37% | 0.006 | $15,646,908.96 |
| SPQ | Superior Resources | 0% | -22% | 129% | 255% | 0.039 | $71,451,257.56 |
| A1G | African Gold Ltd. | 0% | -16% | -33% | -27% | 0.155 | $18,508,600.84 |
| BTR | Brightstar Resources | 0% | -23% | -55% | -18% | 0.027 | $18,758,965.20 |
| DLC | Delecta Limited | 0% | 0% | -31% | 83% | 0.011 | $13,253,995.76 |
| MEK | Meeka Gold Limited | 0% | -4% | -8% | -8% | 0.046 | $44,178,492.72 |
| FEG | Far East Gold | 0% | 40% | 0% | 0% | 0.385 | $50,645,442.15 |
| WAF | West African Res Ltd | 0% | 0% | 0% | 31% | 1.28 | $1,393,705,599.20 |
| NCM | Newcrest Mining | -1% | -3% | 5% | 0% | 26.43 | $24,016,084,111.83 |
| AUT | Auteco Minerals | -1% | -5% | -4% | -24% | 0.069 | $150,913,058.26 |
| BCN | Beacon Minerals | -1% | 0% | 10% | 0% | 0.034 | $120,161,410.41 |
| RSG | Resolute Mining | -2% | 2% | -20% | -37% | 0.325 | $380,856,374.40 |
| AAU | Antilles Gold Ltd | -2% | -7% | -18% | -7% | 0.064 | $22,617,917.50 |
| IDA | Indiana Resources | -2% | 7% | 2% | -25% | 0.064 | $29,893,535.83 |
| GIB | Gibb River Diamonds | -2% | 5% | -30% | 2% | 0.063 | $14,171,132.82 |
| ARN | Aldoro Resources | -2% | -7% | -45% | -19% | 0.27 | $26,787,669.03 |
| SBM | St Barbara Limited | -2% | -9% | -11% | -32% | 1.28 | $1,089,005,915.28 |
| M24 | Mamba Exploration | -2% | -9% | -35% | -43% | 0.1275 | $5,377,312.88 |
| BRB | Breaker Res NL | -2% | -8% | -39% | 26% | 0.245 | $84,718,641.54 |
| KNB | Koonenberrygold | -2% | 3% | -44% | 0% | 0.096 | $7,156,300.99 |
| KCC | Kincora Copper | -2% | -24% | -30% | -68% | 0.095 | $7,030,619.42 |
| AAR | Astral Resources NL | -2% | -18% | 7% | -8% | 0.09 | $53,656,131.51 |
| MVL | Marvel Gold Limited | -2% | -6% | -36% | -12% | 0.044 | $31,694,371.65 |
| SVL | Silver Mines Limited | -2% | -9% | -2% | -9% | 0.215 | $297,121,392.89 |
| NST | Northern Star | -3% | -10% | -1% | -12% | 9.505 | $11,255,119,304.52 |
| STN | Saturn Metals | -3% | -4% | -31% | -15% | 0.37 | $50,660,679.03 |
| BNZ | Benzmining | -3% | -4% | 5% | -19% | 0.675 | $36,551,959.73 |
| TLM | Talisman Mining | -3% | -6% | 18% | 14% | 0.165 | $30,977,017.01 |
| NAG | Nagambie Resources | -3% | -6% | -40% | -39% | 0.049 | $26,170,454.06 |
| CMM | Capricorn Metals | -3% | -8% | 44% | 125% | 3.9 | $1,549,490,405.61 |
| GMD | Genesis Minerals | -3% | -23% | -1% | 124% | 1.405 | $370,751,049.06 |
| KCN | Kingsgate Consolid. | -3% | -22% | -2% | 65% | 1.355 | $317,594,850.06 |
| SLZ | Sultan Resources Ltd | -3% | -9% | -17% | -48% | 0.15 | $12,076,236.41 |
| RML | Resolution Minerals | -3% | -19% | -24% | -44% | 0.0145 | $9,980,498.99 |
| ZAG | Zuleika Gold Ltd | -3% | -6% | 38% | -24% | 0.029 | $15,646,518.75 |
| OKU | Oklo Resources Ltd | -3% | -7% | -39% | -34% | 0.086 | $43,386,697.19 |
| RRL | Regis Resources | -3% | -4% | 1% | -27% | 1.96 | $1,569,934,699.84 |
| ASO | Aston Minerals Ltd | -4% | -29% | 13% | -23% | 0.135 | $153,239,158.52 |
| KAL | Kalgoorliegoldmining | -4% | -18% | 0% | 0% | 0.135 | $10,140,844.00 |
| DEX | Duke Exploration | -4% | -21% | -25% | -66% | 0.135 | $12,178,505.52 |
| GRL | Godolphin Resources | -4% | -13% | -10% | -28% | 0.13 | $10,935,670.98 |
| LCY | Legacy Iron Ore | -4% | 30% | 86% | 63% | 0.026 | $172,984,307.37 |
| MAU | Magnetic Resources | -4% | -4% | -13% | -4% | 1.395 | $325,297,087.55 |
| DEG | De Grey Mining | -4% | -10% | 5% | -20% | 1.14 | $1,669,479,577.13 |
| RXL | Rox Resources | -4% | -4% | 1% | -31% | 0.37 | $63,352,855.13 |
| TRM | Truscott Mining Corp | -4% | 23% | 69% | 88% | 0.049 | $7,445,135.66 |
| HRZ | Horizon | -4% | -14% | -4% | 4% | 0.12 | $70,996,900.00 |
| TIE | Tietto Minerals | -4% | -4% | 17% | 64% | 0.475 | $410,968,474.29 |
| AL8 | Alderan Resource Ltd | -4% | -12% | -41% | -70% | 0.023 | $10,213,585.92 |
| FML | Focus Minerals Ltd | -4% | -4% | -12% | -25% | 0.23 | $65,908,488.35 |
| REZ | Resourc & En Grp Ltd | -4% | -8% | -19% | 16% | 0.044 | $23,490,872.08 |
| LCL | Los Cerros Limited | -4% | -28% | -36% | -54% | 0.086 | $55,123,465.18 |
| ADT | Adriatic Metals | -5% | -10% | -8% | 3% | 2.31 | $506,662,958.25 |
| GSR | Greenstone Resources | -5% | -17% | 26% | 31% | 0.0315 | $29,326,518.05 |
| MAT | Matsa Resources | -5% | -15% | 3% | -16% | 0.063 | $23,691,004.92 |
| EVN | Evolution Mining Ltd | -5% | -12% | 2% | -19% | 3.805 | $7,222,050,271.02 |
| NXM | Nexus Minerals Ltd | -5% | -36% | -37% | 222% | 0.29 | $85,454,281.65 |
| IVR | Investigator Res Ltd | -5% | -16% | -20% | -34% | 0.057 | $78,606,505.76 |
| ZNC | Zenith Minerals Ltd | -5% | -12% | 55% | 31% | 0.38 | $137,561,662.00 |
| ADN | Andromeda Metals Ltd | -5% | -46% | -50% | -47% | 0.095 | $301,110,804.60 |
| LYN | Lycaonresources | -5% | -5% | 0% | 0% | 0.38 | $11,805,000.00 |
| ICG | Inca Minerals Ltd | -5% | -37% | -32% | -17% | 0.095 | $50,563,792.34 |
| GTR | Gti Resources | -5% | -28% | -40% | -12% | 0.018 | $26,025,029.05 |
| PNR | Pantoro Limited | -5% | -7% | 23% | 32% | 0.27 | $441,006,086.36 |
| NSM | Northstaw | -5% | -7% | -10% | -23% | 0.27 | $11,235,560.00 |
| LRL | Labyrinth Resources | -5% | -20% | 3% | -35% | 0.036 | $31,441,203.18 |
| TBR | Tribune Res Ltd | -5% | -5% | -4% | -14% | 4.48 | $235,581,665.73 |
| MKR | Manuka Resources. | -5% | -12% | -31% | -37% | 0.26 | $30,721,010.32 |
| KRM | Kingsrose Mining Ltd | -5% | -12% | 3% | 35% | 0.069 | $53,429,382.85 |
| EM2 | Eagle Mountain | -6% | -29% | -48% | -69% | 0.34 | $90,181,911.44 |
| BAT | Battery Minerals Ltd | -6% | -15% | -29% | -50% | 0.0085 | $18,779,716.57 |
| RMS | Ramelius Resources | -6% | -1% | -14% | -20% | 1.4 | $1,253,371,482.51 |
| G50 | Gold50Limited | -6% | 0% | -6% | 0% | 0.235 | $13,164,230.24 |
| CAI | Calidus Resources | -6% | -5% | 60% | 133% | 0.92 | $386,205,127.68 |
| HRN | Horizon Gold Ltd | -6% | -13% | -9% | -13% | 0.36 | $41,076,426.16 |
| GWR | GWR Group Ltd | -6% | -18% | 38% | -49% | 0.145 | $44,970,331.70 |
| HMG | Hamelingoldlimited | -6% | -3% | -19% | 0% | 0.145 | $15,950,000.00 |
| DCN | Dacian Gold Ltd | -7% | -17% | 2% | -37% | 0.215 | $244,142,339.18 |
| CXU | Cauldron Energy Ltd | -7% | -22% | -46% | -64% | 0.014 | $8,031,169.16 |
| PDI | Predictive Disc Ltd | -7% | 0% | 2% | 153% | 0.21 | $309,293,622.90 |
| GOR | Gold Road Res Ltd | -7% | -9% | 3% | 9% | 1.4275 | $1,307,247,199.80 |
| DGO | DGO Gold Limited | -7% | -12% | 4% | -15% | 3.04 | $265,101,017.32 |
| MML | Medusa Mining Ltd | -7% | -12% | 3% | -8% | 0.76 | $180,085,477.79 |
| DTM | Dart Mining NL | -7% | -18% | -35% | -50% | 0.068 | $8,963,346.96 |
| PGD | Peregrine Gold | -7% | -13% | 23% | 46% | 0.475 | $18,377,601.12 |
| SNG | Siren Gold | -7% | 0% | 3% | 52% | 0.395 | $33,353,769.59 |
| QML | Qmines Limited | -7% | -13% | -32% | -13% | 0.26 | $17,960,853.33 |
| TRN | Torrens Mining | -7% | -4% | -13% | -7% | 0.13 | $9,218,941.94 |
| WGX | Westgold Resources. | -7% | -22% | -25% | -28% | 1.465 | $731,551,576.47 |
| TCG | Turaco Gold Limited | -7% | -19% | -43% | 48% | 0.089 | $40,205,366.89 |
| SFR | Sandfire Resources | -7% | -7% | 2% | -16% | 5.395 | $2,328,697,152.24 |
| GUL | Gullewa Limited | -7% | 9% | -12% | -20% | 0.075 | $14,277,982.50 |
| CYL | Catalyst Metals | -7% | -12% | -15% | -19% | 1.685 | $168,359,671.08 |
| VRC | Volt Resources Ltd | -8% | 3% | -34% | -23% | 0.0185 | $63,052,275.54 |
| AAJ | Aruma Resources Ltd | -8% | -48% | -1% | 31% | 0.085 | $14,597,419.78 |
| AWV | Anova Metals Ltd | -8% | -14% | -40% | -43% | 0.012 | $19,475,224.60 |
| KAU | Kaiser Reef | -8% | -14% | -8% | -37% | 0.18 | $24,599,435.66 |
| CEL | Challenger Exp Ltd | -8% | -9% | 3% | -14% | 0.3 | $301,220,741.40 |
| TSO | Tesoro Gold Ltd | -8% | -16% | -17% | -63% | 0.068 | $46,790,504.32 |
| AQX | Alice Queen Ltd | -8% | -31% | -54% | -69% | 0.0055 | $9,197,088.06 |
| BBX | BBX Minerals Ltd | -8% | -19% | -37% | -69% | 0.11 | $52,902,469.63 |
| MHC | Manhattan Corp Ltd | -8% | -15% | 10% | -21% | 0.011 | $18,315,344.32 |
| EMR | Emerald Res NL | -8% | -10% | 11% | 13% | 1.1 | $658,403,787.48 |
| OKR | Okapi Resources | -8% | -8% | -50% | 49% | 0.275 | $34,556,056.04 |
| TAM | Tanami Gold NL | -8% | -8% | -21% | -29% | 0.055 | $64,630,337.53 |
| A8G | Australasian Metals | -8% | -17% | -39% | 0% | 0.44 | $18,732,574.77 |
| GNM | Great Northern | -8% | -8% | -31% | -39% | 0.0055 | $9,399,780.37 |
| LM8 | Lunnonmetalslimited | -8% | -4% | 162% | 0% | 0.97 | $111,524,268.91 |
| MI6 | Minerals260Limited | -9% | -16% | -9% | 0% | 0.43 | $96,800,000.00 |
| TTM | Titan Minerals | -9% | -11% | -19% | -23% | 0.085 | $121,235,965.84 |
| NVA | Nova Minerals Ltd | -9% | -33% | -53% | -56% | 0.635 | $119,834,519.53 |
| KZR | Kalamazoo Resources | -9% | 6% | 9% | -13% | 0.37 | $55,173,862.12 |
| AUC | Ausgold Limited | -9% | -6% | 44% | 44% | 0.062 | $133,945,319.71 |
| PNX | PNX Metals Limited | -9% | 0% | -26% | -31% | 0.005 | $22,220,289.04 |
| LEX | Lefroy Exploration | -9% | -3% | -27% | -67% | 0.3 | $43,762,400.40 |
| VKA | Viking Mines Ltd | -9% | -17% | -55% | -69% | 0.01 | $10,252,584.31 |
| NES | Nelson Resources. | -9% | 0% | -50% | -74% | 0.02 | $6,180,240.44 |
| ENR | Encounter Resources | -9% | 0% | -22% | 7% | 0.145 | $45,938,439.77 |
| HMX | Hammer Metals Ltd | -10% | -14% | 94% | 0% | 0.095 | $81,499,462.30 |
| NWM | Norwest Minerals | -10% | -11% | -24% | -26% | 0.054 | $9,210,976.74 |
| RDS | Redstone Resources | -10% | -25% | -47% | -25% | 0.009 | $6,631,491.56 |
| CHZ | Chesser Resources | -10% | -14% | -29% | -32% | 0.099 | $61,437,926.55 |
| GSM | Golden State Mining | -10% | -36% | -33% | -44% | 0.07 | $7,370,840.29 |
| ICL | Iceni Gold | -10% | 18% | -49% | -40% | 0.13 | $18,588,482.06 |
| HXG | Hexagon Energy | -11% | -23% | -68% | -70% | 0.034 | $16,071,092.39 |
| MGV | Musgrave Minerals | -11% | -12% | -23% | -23% | 0.295 | $163,837,749.45 |
| PGO | Pacgold | -11% | -14% | 95% | 0% | 0.63 | $33,378,771.54 |
| AME | Alto Metals Limited | -11% | 0% | -18% | -8% | 0.082 | $43,299,075.98 |
| ANX | Anax Metals Ltd | -11% | 3% | 3% | 22% | 0.1025 | $40,042,816.00 |
| BGD | Bartongoldholdings | -11% | -16% | 21% | 0% | 0.205 | $17,597,199.18 |
| VAN | Vango Mining Ltd | -11% | 41% | -26% | -34% | 0.048 | $60,477,006.34 |
| SKY | SKY Metals Ltd | -11% | -21% | 5% | -42% | 0.087 | $33,910,512.30 |
| E2M | E2 Metals | -11% | -19% | -17% | -30% | 0.195 | $41,817,787.83 |
| KSN | Kingston Resources | -11% | -14% | -24% | -23% | 0.155 | $66,043,110.24 |
| AMI | Aurelia Metals Ltd | -11% | -20% | 0% | -1% | 0.385 | $501,007,865.09 |
| YRL | Yandal Resources | -12% | -4% | -47% | -59% | 0.23 | $29,022,888.25 |
| MXR | Maximus Resources | -12% | 1% | -1% | -17% | 0.076 | $25,432,461.44 |
| WWI | West Wits Mining Ltd | -12% | -20% | -25% | -68% | 0.0265 | $51,470,508.91 |
| MTH | Mithril Resources | -12% | -38% | -53% | -53% | 0.0075 | $23,361,864.33 |
| KTA | Krakatoa Resources | -12% | 64% | 54% | 59% | 0.097 | $36,194,541.29 |
| DTR | Dateline Resources | -12% | 16% | 26% | 26% | 0.11 | $50,951,946.00 |
| AZS | Azure Minerals | -12% | -22% | -17% | -12% | 0.29 | $94,774,394.91 |
| DDD | 3D Resources Limited | -13% | 0% | -13% | -30% | 0.0035 | $16,721,488.37 |
| SFM | Santa Fe Minerals | -13% | -30% | 14% | 8% | 0.105 | $8,010,066.79 |
| PNT | Panthermetalsltd | -13% | -9% | 0% | 0% | 0.205 | $6,160,000.00 |
| BMO | Bastion Minerals | -13% | -8% | -41% | -15% | 0.17 | $12,907,974.20 |
| ERM | Emmerson Resources | -13% | -31% | 25% | 45% | 0.1 | $56,993,658.75 |
| CLA | Celsius Resource Ltd | -13% | -29% | -23% | -56% | 0.02 | $25,650,781.13 |
| OBM | Ora Banda Mining Ltd | -13% | -26% | -47% | -81% | 0.0365 | $49,463,542.91 |
| FAU | First Au Ltd | -13% | -13% | 18% | -28% | 0.013 | $10,515,842.34 |
| MEI | Meteoric Resources | -13% | -7% | -30% | -76% | 0.013 | $19,841,865.82 |
| RVR | Red River Resources | -13% | -15% | -5% | -7% | 0.195 | $104,989,058.82 |
| SLR | Silver Lake Resource | -13% | -21% | -5% | -9% | 1.625 | $1,571,985,527.19 |
| M2R | Miramar | -14% | -11% | -23% | -34% | 0.155 | $7,970,403.20 |
| WCN | White Cliff Min Ltd | -14% | -35% | 85% | -8% | 0.024 | $16,340,084.05 |
| MCT | Metalicity Limited | -14% | -8% | -33% | -54% | 0.006 | $14,055,393.03 |
| ADV | Ardiden Ltd | -14% | -20% | -8% | -8% | 0.012 | $36,022,527.31 |
| XTC | Xantippe Res Ltd | -14% | -8% | 140% | 380% | 0.012 | $99,638,264.69 |
| GMN | Gold Mountain Ltd | -14% | -14% | -70% | -85% | 0.006 | $7,755,469.61 |
| RED | Red 5 Limited | -14% | -9% | 47% | 85% | 0.36 | $918,980,654.28 |
| BEZ | Besragoldinc | -15% | -23% | -66% | 0% | 0.047 | $7,905,098.16 |
| HAW | Hawthorn Resources | -15% | 56% | 166% | 169% | 0.145 | $53,362,498.08 |
| SRN | Surefire Rescs NL | -15% | 100% | 209% | 21% | 0.034 | $45,601,204.68 |
| PRS | Prospech Limited | -15% | 6% | -41% | -56% | 0.051 | $3,780,498.29 |
| TAR | Taruga Minerals | -15% | -37% | -63% | -80% | 0.017 | $9,826,820.08 |
| AXE | Archer Materials | -15% | -19% | -54% | -13% | 0.745 | $197,054,429.57 |
| NAE | New Age Exploration | -15% | -27% | 0% | -42% | 0.011 | $17,230,786.92 |
| PUR | Pursuit Minerals | -15% | -39% | -35% | -65% | 0.022 | $22,693,180.66 |
| SVY | Stavely Minerals Ltd | -15% | -18% | -23% | -41% | 0.355 | $97,860,544.50 |
| BC8 | Black Cat Syndicate | -16% | -25% | -20% | -39% | 0.4425 | $84,922,686.72 |
| BYH | Bryah Resources Ltd | -16% | -9% | -23% | -36% | 0.048 | $10,405,530.05 |
| MEG | Megado | -17% | 14% | 36% | -34% | 0.125 | $5,596,343.74 |
| EMU | EMU NL | -17% | -29% | -44% | -68% | 0.015 | $8,797,031.74 |
| CPM | Coopermetalslimited | -17% | -15% | 0% | 0% | 0.375 | $9,997,400.00 |
| AVW | Avira Resources Ltd | -17% | -29% | -29% | -29% | 0.005 | $11,653,345.00 |
| SBR | Sabre Resources | -17% | -17% | -17% | -9% | 0.005 | $15,340,406.70 |
| GSN | Great Southern | -17% | -14% | -28% | -16% | 0.048 | $28,747,822.64 |
| MRR | Minrex Resources Ltd | -17% | -30% | 171% | 148% | 0.057 | $61,531,646.05 |
| PRX | Prodigy Gold NL | -17% | -14% | -42% | -56% | 0.019 | $11,652,552.12 |
| G88 | Golden Mile Res Ltd | -17% | -24% | 0% | -37% | 0.052 | $11,040,293.77 |
| MOH | Moho Resources | -18% | -25% | -28% | -45% | 0.042 | $6,246,177.31 |
| CTO | Citigold Corp Ltd | -18% | -22% | -30% | -36% | 0.007 | $19,835,613.64 |
| OAU | Ora Gold Limited | -18% | -18% | -8% | -36% | 0.014 | $13,754,237.97 |
| RGL | Riversgold | -18% | -41% | 243% | 33% | 0.059 | $34,858,211.73 |
| ARL | Ardea Resources Ltd | -19% | -27% | 184% | 200% | 1.32 | $232,540,747.64 |
| RDT | Red Dirt Metals Ltd | -19% | -39% | -45% | 190% | 0.435 | $136,392,074.46 |
| PUA | Peak Minerals Ltd | -19% | -32% | -14% | -39% | 0.013 | $13,537,819.76 |
| PAK | Pacific American Hld | -19% | -24% | -24% | -34% | 0.013 | $6,212,406.23 |
| PNM | Pacific Nickel Mines | -19% | -23% | -19% | 63% | 0.085 | $25,771,206.32 |
| CDT | Castle Minerals | -19% | -33% | 62% | 223% | 0.042 | $45,976,677.26 |
| HCH | Hot Chili Ltd | -19% | -12% | -41% | -28% | 1.325 | $150,395,105.02 |
| LNY | Laneway Res Ltd | -20% | -27% | -17% | -17% | 0.004 | $31,510,082.05 |
| KWR | Kingwest Resources | -21% | -3% | 19% | 48% | 0.155 | $41,305,414.25 |
| GBZ | GBM Rsources Ltd | -21% | -37% | -30% | -17% | 0.095 | $51,792,567.70 |
| BNR | Bulletin Res Ltd | -21% | -37% | 118% | 152% | 0.17 | $50,765,789.73 |
| RDN | Raiden Resources Ltd | -21% | -13% | -46% | -48% | 0.013 | $19,791,155.41 |
| AM7 | Arcadia Minerals | -21% | -11% | -17% | 0% | 0.24 | $8,573,162.50 |
| GED | Golden Deeps | -24% | -30% | 33% | 45% | 0.016 | $19,637,708.88 |
| WMC | Wiluna Mining Corp | -24% | -37% | -46% | -42% | 0.56 | $118,336,369.20 |
| WRM | White Rock Min Ltd | -26% | -33% | -51% | -67% | 0.145 | $22,076,619.74 |
| TMZ | Thomson Res Ltd | -27% | -35% | -59% | -74% | 0.03 | $20,793,626.65 |
| MLS | Metals Australia | -33% | -35% | 150% | 67% | 0.1 | $43,512,637.14 |
| ALY | Alchemy Resource Ltd | -34% | 61% | 108% | 60% | 0.025 | $23,826,851.43 |
| ARV | Artemis Resources | -34% | -44% | -55% | -60% | 0.04 | $63,863,225.26 |
| ANL | Amani Gold Ltd | -50% | -50% | -50% | 0% | 0.001 | $34,940,161.69 |
Related Topics

Related Stories


UNLOCK INSIGHTS
Discover the untold stories of emerging ASX stocks.
Daily news and expert analysis, it's free to subscribe.
By proceeding, you confirm you understand that we handle personal information in accordance with our Privacy Policy.


