Gold Digger: Gold miners catching up to bullion as records tumble

Gold investments are looking suave right now. Pic: Getty Images
- Gold surges to record high, climbing above US$2730/oz
- Big miners disappoint in September quarterlies
- Yandal and Advanced Metals surge higher on gold hit and silver acquisition
Gold pulled up to a record high this week, leaving analysts to lay out how they’ve travelled so far and investors to wonder how long they can keep running higher for.
At US$2732/oz yesterday ($4125/oz), gold miners are staring at conditions they’ve never seen before, with prices limbing a staggering 37% over the past 12 months.
Silver prices have been even more staggering, running 46% higher after years in the wilderness.
“Gold’s price performance has caught the world’s attention. Lower interest rates, geopolitical uncertainty, and increased investor focus have all been catalysts for the rally,” the World Gold Council’s head of Asia Pacific and central banks Shaokai Fan said.
“While WGC does not forecast the gold price, easing policy rates have historically been positive for gold. As central banks continue to lower rates, investors are further incentivised to turn to gold as the cost of holding the metal decreases.”
A number of analysts now have forecasts showing gold could hit US$3000/oz within a year.
ANZ’s Daniel Hynes and Soni Kumari say safe haven demand for gold has been increased by political and geopolitical uncertainty. To that end we are now less than a fortnight out from a tempestuous US Election.
“Further, concerns around rising US fiscal debt outlook is strengthening the investment case for gold,” they said in a note, but cautioned that air could yet come out of the balloon.
“We think that the recent rally can fade once the market focus shifts to prospects of a gradual easing cycle by the Fed rather than deeper cuts. While long-term drivers for gold remain in place, a pause or shallow rate cuts will provide reason for investors to book profit after the recent price rally.”
Miners disappoint on costs
It’s worth noting that gold miners aren’t just a proxy for the price of bullion, and have been underperforming the commodity rally this year, though Aussie producers have caught up in recent weeks.
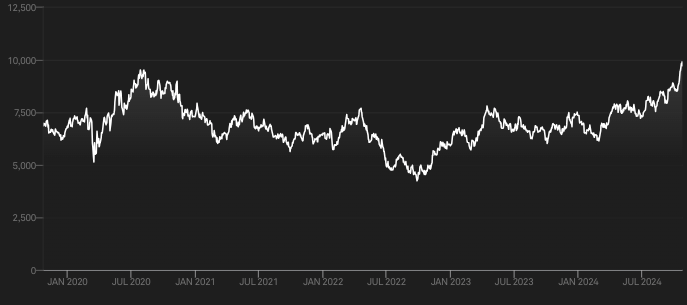
They’re now 44.35% higher in the past year and 31.5% up in 2024 to date. That saw the ASX gold sector hit an all time high in terms of value this week, climbing over 9700 points at the close on Thursday.
That eclipsed the mark of 9353 set at the peak of the Covid gold boom on August 7, 2020.
But this week has also seen a couple of big miners humbled on their quarterly reports.
Northern Star Resources (ASX:NST) reported a 10% fall in gold production in the September quarter QoQ.
It tends to backload its output, but analysts focused in costs with Jarden’s Ben Lyons saying inflation trends were becoming embedded. Cash operating costs ($705m in total) were 7% above Jarden estimates with all in sustaining costs ($821m) were 3% higher thanks to a $25m beat on sustaining capex and corporate overheads, he noted.
“In our opinion, a key feature of the SQ24 results was the breadth of cost increases across the NST asset
base, which we have observed throughout CY24 YTD,” Lyons and his fellow analysts reported.
“We take some comfort, accordingly, that our operating cost forecasts sit materially higher than consensus, a key contributor to our A$13.10 12-month target price and Underweight rating.”
While Northern Star has looked to mill expansions to add economies of scale, including a major project to double the size of its Fimiston Mill at the Kalgoorlie Super Pit by 2027, Jarden warns inputs have kept the gold miner from seeing the full benefits.
“In our view, it is possible the increases for key inputs (energy, labour, reagents, maintenance, grinding media, etc.) have more than eroded any scale efficiencies, or perhaps the proportion of fixed costs is greater than our understanding,” Lyons and his team wrote.
Northern Star delivered 394,000oz at AISC of $2082/oz in the September quarter, but has maintained guidance of 1.65-1.8Moz at $1850-2100/oz for FY25. It aims to hit a 2Mtpa runrate from FY26.
““We continue to deliver consistently strong operational results across all three production centres during the September quarter. As a result of the positive start into FY25, we are confident we will achieve our full-year production and cost guidance providing shareholders the continued benefits of current higher gold prices,” MD Stu Tonkin said.
Newmont Corporation (ASX:NEM) sank more than 13% today, with its costs coming in 11% above consensus. The world’s top gold producer rolled 1.67Moz off the production line in the quarter at US$1611/oz. Its guidance of 1.8Moz at US$1475/oz imply a miss on costs for 2024, RBC’s Josh Wolfson and Alex Barkley said (US$1520/oz vs guidance of US$1400/oz).
Winners & Losers
Here’s how ASX-listed precious metals stocks are performing:
Scroll or swipe to reveal table. Click headings to sort. Best viewed on a laptop.
Stocks missing from this list? Email [email protected]
| CODE | COMPANY | PRICE | WEEK % | MONTH % | 6 MONTH % | YEAR % | YTD % | MARKET CAP |
|---|---|---|---|---|---|---|---|---|
| MRR | Minrex Resources Ltd | 0.009 | 6% | 0% | -25% | -44% | -47% | $ 8,678,940.02 |
| NPM | Newpeak Metals | 0.012 | 0% | -8% | -33% | -87% | -16% | $ 3,970,265.85 |
| ASO | Aston Minerals Ltd | 0.01 | -5% | -23% | -23% | -74% | -58% | $ 12,950,642.69 |
| MTC | Metalstech Ltd | 0.14 | 8% | -15% | -20% | -13% | -36% | $ 27,581,173.62 |
| GED | Golden Deeps | 0.03 | -3% | -21% | -19% | -42% | -35% | $ 4,394,148.12 |
| G88 | Golden Mile Res Ltd | 0.017 | 31% | 89% | 42% | -11% | -11% | $ 6,168,342.83 |
| LAT | Latitude 66 Limited | 0.115 | 10% | 5% | -43% | -43% | -43% | $ 14,974,687.67 |
| NMR | Native Mineral Res | 0.034 | 3% | 48% | 36% | -11% | 70% | $ 14,341,432.46 |
| AQX | Alice Queen Ltd | 0.007 | -13% | -13% | 40% | -42% | 40% | $ 9,175,120.54 |
| SLZ | Sultan Resources Ltd | 0.012 | 100% | 100% | 9% | -36% | -47% | $ 2,371,037.87 |
| MKG | Mako Gold | 0.018 | 13% | 100% | 20% | 6% | 80% | $ 17,759,143.35 |
| KSN | Kingston Resources | 0.105 | 24% | 30% | 48% | 26% | 37% | $ 69,304,752.10 |
| AMI | Aurelia Metals Ltd | 0.1925 | -4% | 10% | 1% | 98% | 75% | $ 321,397,270.58 |
| GIB | Gibb River Diamonds | 0.041 | 3% | -2% | 86% | 8% | 37% | $ 8,794,887.25 |
| KCN | Kingsgate Consolid. | 1.53 | 0% | 10% | -5% | 35% | 11% | $ 402,092,639.52 |
| TMX | Terrain Minerals | 0.0035 | 0% | -13% | -30% | -22% | -30% | $ 5,400,086.41 |
| BNR | Bulletin Res Ltd | 0.045 | -2% | 5% | -2% | -57% | -68% | $ 12,625,372.89 |
| NXM | Nexus Minerals Ltd | 0.059 | 4% | 34% | -9% | 55% | 26% | $ 29,179,509.60 |
| SKY | SKY Metals Ltd | 0.056 | 10% | 37% | 60% | 40% | 56% | $ 32,488,674.13 |
| LM8 | Lunnonmetalslimited | 0.325 | 3% | 110% | 16% | -53% | -46% | $ 69,447,655.31 |
| CST | Castile Resources | 0.086 | -2% | 10% | -9% | 76% | 5% | $ 20,803,608.72 |
| YRL | Yandal Resources | 0.25 | 150% | 166% | 61% | 303% | 201% | $ 64,273,827.36 |
| FAU | First Au Ltd | 0.0015 | 50% | 0% | -25% | -50% | -50% | $ 2,717,989.92 |
| ARL | Ardea Resources Ltd | 0.415 | -14% | 4% | -51% | -14% | -13% | $ 84,865,238.88 |
| GWR | GWR Group Ltd | 0.091 | 1% | 14% | -21% | 30% | -4% | $ 28,588,282.30 |
| IVR | Investigator Res Ltd | 0.05 | 22% | 39% | -6% | 32% | 32% | $ 82,621,737.85 |
| GTR | Gti Energy Ltd | 0.0045 | -10% | 13% | -31% | -44% | -44% | $ 13,322,023.48 |
| IPT | Impact Minerals | 0.014 | 17% | 8% | -30% | 40% | 27% | $ 39,772,638.33 |
| BNZ | Benzmining | 0.26 | -7% | 58% | 63% | -25% | 4% | $ 27,787,350.76 |
| MOH | Moho Resources | 0.006 | 0% | 0% | 20% | -14% | -40% | $ 3,235,069.18 |
| BCM | Brazilian Critical | 0.0075 | -17% | -32% | -70% | -67% | -71% | $ 6,953,530.67 |
| PUA | Peak Minerals Ltd | 0.0045 | 80% | 125% | 81% | 81% | 81% | $ 14,982,661.58 |
| MRZ | Mont Royal Resources | 0.051 | -12% | -2% | -11% | -69% | -66% | $ 4,506,579.03 |
| SMS | Starmineralslimited | 0.058 | 0% | 18% | 57% | 29% | 45% | $ 5,304,476.30 |
| MVL | Marvel Gold Limited | 0.011 | -15% | 0% | 22% | 0% | -8% | $ 10,365,488.44 |
| PRX | Prodigy Gold NL | 0.003 | 50% | 100% | 12% | -58% | -44% | $ 6,997,367.44 |
| AAU | Antilles Gold Ltd | 0.0045 | 13% | 50% | -75% | -80% | -80% | $ 7,422,970.90 |
| CWX | Carawine Resources | 0.097 | -1% | 3% | -8% | -10% | -12% | $ 22,904,168.55 |
| RND | Rand Mining Ltd | 2.11 | 6% | 21% | 33% | 62% | 54% | $ 119,439,518.10 |
| CAZ | Cazaly Resources | 0.015 | 0% | 0% | -12% | -50% | -48% | $ 6,919,544.87 |
| BMR | Ballymore Resources | 0.13 | -7% | -7% | 0% | 18% | 4% | $ 22,091,323.13 |
| DRE | Dreadnought Resources Ltd | 0.017 | -6% | 13% | 6% | -53% | -43% | $ 63,796,750.00 |
| ZNC | Zenith Minerals Ltd | 0.05 | 6% | 16% | -47% | -47% | -67% | $ 17,175,639.69 |
| REZ | Resourc & En Grp Ltd | 0.026 | -13% | 13% | 100% | 73% | 86% | $ 17,397,617.17 |
| LEX | Lefroy Exploration | 0.082 | 9% | 17% | -32% | -52% | -53% | $ 16,437,595.52 |
| ERM | Emmerson Resources | 0.047 | 2% | -2% | 4% | -22% | -20% | $ 24,511,940.46 |
| AM7 | Arcadia Minerals | 0.039 | 0% | 15% | -47% | -57% | -47% | $ 4,564,953.90 |
| ADT | Adriatic Metals | 4.265 | 4% | 21% | 2% | 25% | 6% | $ 1,154,058,161.97 |
| AS1 | Asara Resources Ltd | 0.022 | 0% | 38% | 100% | 16% | 120% | $ 22,923,187.06 |
| CYL | Catalyst Metals | 3.54 | 11% | 25% | 307% | 449% | 340% | $ 784,159,427.68 |
| CHN | Chalice Mining Ltd | 1.9525 | 18% | 49% | 69% | 6% | 15% | $ 752,766,834.78 |
| KAL | Kalgoorliegoldmining | 0.022 | 0% | -8% | -35% | -21% | -19% | $ 6,081,939.05 |
| MLS | Metals Australia | 0.0225 | 2% | -10% | 2% | -38% | -39% | $ 15,998,829.53 |
| ADN | Andromeda Metals Ltd | 0.0075 | -6% | 0% | -61% | -63% | -70% | $ 24,001,035.36 |
| MEI | Meteoric Resources | 0.1025 | 5% | 3% | -53% | -55% | -61% | $ 222,974,987.66 |
| SRN | Surefire Rescs NL | 0.0055 | 0% | -8% | -39% | -61% | -35% | $ 11,917,846.88 |
| WA8 | Warriedarresourltd | 0.058 | 2% | 5% | 26% | -11% | 9% | $ 44,269,389.89 |
| HMX | Hammer Metals Ltd | 0.046 | 21% | 28% | 0% | 2% | -12% | $ 39,888,330.71 |
| WCN | White Cliff Min Ltd | 0.021 | -9% | 11% | 50% | 75% | 133% | $ 41,590,356.46 |
| AVM | Advance Metals Ltd | 0.043 | 105% | 105% | 87% | -22% | 17% | $ 4,717,976.87 |
| ASR | Asra Minerals Ltd | 0.0045 | 0% | -18% | -36% | -36% | -36% | $ 11,157,789.99 |
| ARI | Arika Resources | 0.031 | -9% | -11% | 55% | 55% | 24% | $ 20,413,288.57 |
| AME | Alto Metals Limited | 0.073 | 14% | 12% | 70% | 66% | 70% | $ 50,506,622.04 |
| CTO | Citigold Corp Ltd | 0.004 | -11% | 0% | -20% | 0% | -20% | $ 12,000,000.00 |
| SMI | Santana Minerals Ltd | 2.1 | -1% | -7% | 65% | 282% | 108% | $ 445,943,807.40 |
| M2R | Miramar | 0.007 | -13% | -13% | -26% | -78% | -65% | $ 2,777,763.00 |
| MHC | Manhattan Corp Ltd | 0.002 | 0% | 100% | 20% | -52% | -40% | $ 8,995,939.72 |
| GRL | Godolphin Resources | 0.019 | 27% | 19% | -34% | -47% | -51% | $ 5,375,590.76 |
| SVG | Savannah Goldfields | 0.022 | 5% | 0% | -21% | -61% | -56% | $ 6,183,868.15 |
| EMC | Everest Metals Corp | 0.13 | -4% | 4% | 40% | 24% | 63% | $ 24,216,804.17 |
| GUL | Gullewa Limited | 0.08 | 23% | 23% | 45% | 45% | 45% | $ 16,861,848.00 |
| CY5 | Cygnus Metals Ltd | 0.15 | 7% | 100% | 61% | 25% | 11% | $ 66,450,954.50 |
| G50 | G50Corp Ltd | 0.17 | -6% | 17% | -3% | 36% | 26% | $ 20,835,200.00 |
| ADV | Ardiden Ltd | 0.135 | 4% | 0% | -13% | -22% | -23% | $ 8,127,275.78 |
| AAR | Astral Resources NL | 0.1425 | 19% | 30% | 101% | 74% | 95% | $ 156,248,766.18 |
| VMC | Venus Metals Cor Ltd | 0.062 | 11% | 3% | -33% | -38% | -38% | $ 13,336,750.44 |
| NAE | New Age Exploration | 0.006 | 0% | 20% | 50% | 9% | 0% | $ 10,763,393.46 |
| VKA | Viking Mines Ltd | 0.009 | 0% | 29% | -18% | 0% | -36% | $ 9,563,325.88 |
| LCL | LCL Resources Ltd | 0.011 | 22% | 10% | -8% | -65% | -35% | $ 9,648,780.26 |
| MTH | Mithril Silver Gold | 0.565 | 27% | -7% | 183% | 183% | 183% | $ 66,594,019.93 |
| ADG | Adelong Gold Limited | 0.005 | 25% | 25% | 25% | -29% | 0% | $ 5,589,944.79 |
| RMX | Red Mount Min Ltd | 0.008 | -11% | -20% | -20% | -77% | -70% | $ 3,486,220.16 |
| PRS | Prospech Limited | 0.028 | -7% | -22% | -28% | 33% | -10% | $ 8,473,577.14 |
| TTM | Titan Minerals | 0.595 | 25% | 45% | 105% | 72% | 113% | $ 106,069,313.73 |
| NML | Navarre Minerals Ltd | 0.019 | 0% | 0% | 0% | 0% | 0% | $ 28,555,653.83 |
| AAM | Aumegametals | 0.05 | -17% | 11% | -37% | 11% | 6% | $ 26,834,656.79 |
| KZR | Kalamazoo Resources | 0.094 | 9% | 19% | 3% | 1% | -22% | $ 18,074,870.91 |
| BCN | Beacon Minerals | 0.024 | 4% | 9% | -17% | -8% | -4% | $ 90,162,436.10 |
| MAU | Magnetic Resources | 1.25 | -1% | -9% | 18% | 21% | 23% | $ 325,425,557.20 |
| BC8 | Black Cat Syndicate | 0.635 | 13% | 55% | 135% | 243% | 154% | $ 281,666,744.90 |
| EM2 | Eagle Mountain | 0.044 | -12% | 2% | -25% | -35% | -41% | $ 17,679,371.49 |
| EMR | Emerald Res NL | 4.245 | -1% | 11% | 24% | 53% | 41% | $ 2,798,617,765.02 |
| BYH | Bryah Resources Ltd | 0.005 | 25% | 25% | -38% | -64% | -62% | $ 2,516,434.28 |
| HCH | Hot Chili Ltd | 0.86 | 6% | 2% | -28% | -15% | -20% | $ 127,950,280.25 |
| WAF | West African Res Ltd | 1.81 | 13% | 4% | 40% | 141% | 92% | $ 1,988,823,342.78 |
| MEU | Marmota Limited | 0.042 | 14% | 20% | 5% | 31% | -2% | $ 45,636,290.78 |
| NVA | Nova Minerals Ltd | 0.27 | 42% | 64% | -8% | 2% | -25% | $ 70,703,589.06 |
| SVL | Silver Mines Limited | 0.125 | 14% | 37% | -31% | -26% | -22% | $ 196,044,713.41 |
| PGD | Peregrine Gold | 0.17 | -3% | 3% | -23% | -40% | -29% | $ 12,218,115.78 |
| ICL | Iceni Gold | 0.047 | 18% | 27% | 81% | -30% | -10% | $ 12,819,769.44 |
| FG1 | Flynngold | 0.03 | 0% | 3% | -27% | -47% | -34% | $ 7,578,177.63 |
| WWI | West Wits Mining Ltd | 0.017 | 21% | 10% | 6% | 21% | 42% | $ 40,683,629.02 |
| RML | Resolution Minerals | 0.002 | 0% | 0% | -33% | -60% | -33% | $ 3,220,043.61 |
| AAJ | Aruma Resources Ltd | 0.017 | 3% | 0% | 6% | -48% | -37% | $ 3,774,988.92 |
| AL8 | Alderan Resource Ltd | 0.003 | 0% | 0% | -33% | -66% | -33% | $ 5,727,876.29 |
| GMN | Gold Mountain Ltd | 0.002 | 0% | -33% | -50% | -60% | -64% | $ 7,814,946.37 |
| MEG | Megado Minerals Ltd | 0.016 | 7% | 0% | 60% | -56% | -54% | $ 4,071,288.93 |
| HMG | Hamelingoldlimited | 0.084 | -1% | 31% | 14% | 1% | 6% | $ 13,072,500.00 |
| BM8 | Battery Age Minerals | 0.1 | -9% | -9% | 3% | -53% | -47% | $ 9,767,534.70 |
| TBR | Tribune Res Ltd | 4.97 | 1% | 8% | 13% | 57% | 68% | $ 256,568,896.53 |
| FML | Focus Minerals Ltd | 0.19 | 12% | 46% | -5% | 23% | 3% | $ 52,296,952.71 |
| VRC | Volt Resources Ltd | 0.004 | 0% | 0% | -33% | -47% | -38% | $ 16,634,712.51 |
| ARV | Artemis Resources | 0.013 | -7% | -7% | -19% | -43% | -32% | $ 24,919,471.54 |
| HRN | Horizon Gold Ltd | 0.395 | 7% | 10% | 46% | 32% | 32% | $ 56,487,569.97 |
| CLA | Celsius Resource Ltd | 0.011 | -8% | -8% | 10% | 0% | -8% | $ 30,852,294.01 |
| QML | Qmines Limited | 0.073 | -3% | -24% | 18% | -18% | -11% | $ 25,090,475.44 |
| RDN | Raiden Resources Ltd | 0.033 | 3% | -23% | -11% | 0% | -18% | $ 96,877,792.54 |
| TCG | Turaco Gold Limited | 0.3575 | -1% | 13% | 110% | 615% | 175% | $ 255,238,897.94 |
| KCC | Kincora Copper | 0.0355 | -19% | -23% | -9% | 18% | -13% | $ 8,523,806.77 |
| GBZ | GBM Rsources Ltd | 0.009 | 13% | 13% | -18% | -50% | 0% | $ 10,410,200.00 |
| DTM | Dart Mining NL | 0.013 | -7% | -19% | -54% | -24% | -17% | $ 5,599,389.19 |
| MKR | Manuka Resources. | 0.054 | 2% | 42% | -34% | 20% | -30% | $ 42,887,221.80 |
| AUC | Ausgold Limited | 0.62 | 15% | 42% | 107% | 107% | 94% | $ 210,206,066.12 |
| ANX | Anax Metals Ltd | 0.012 | -11% | -40% | -50% | -64% | -60% | $ 10,892,936.78 |
| EMU | EMU NL | 0.027 | 4% | 17% | 96% | -2% | -2% | $ 3,262,978.86 |
| SFM | Santa Fe Minerals | 0.03 | 0% | -21% | -36% | -30% | -30% | $ 2,184,563.67 |
| SSR | SSR Mining Inc. | 9.45 | 9% | 14% | 17% | -58% | -40% | $ 36,511,574.84 |
| PNR | Pantoro Limited | 0.1225 | -2% | 11% | 42% | 192% | 115% | $ 806,753,814.25 |
| CMM | Capricorn Metals | 6.42 | 0% | 4% | 29% | 34% | 36% | $ 2,382,201,875.61 |
| X64 | Ten Sixty Four Ltd | 0.57 | 0% | 0% | 0% | 0% | 0% | $ 129,844,903.32 |
| SI6 | SI6 Metals Limited | 0.0015 | 50% | -25% | -50% | -73% | -70% | $ 2,368,859.43 |
| HAW | Hawthorn Resources | 0.058 | 0% | 4% | -16% | -36% | -38% | $ 19,430,905.55 |
| BGD | Bartongoldholdings | 0.27 | 8% | 13% | -5% | 10% | 2% | $ 61,224,498.16 |
| SVY | Stavely Minerals Ltd | 0.031 | 0% | 0% | 3% | -56% | -31% | $ 14,927,753.14 |
| AGC | AGC Ltd | 0.225 | 15% | -2% | 185% | 252% | 217% | $ 47,470,486.07 |
| RGL | Riversgold | 0.004 | 33% | -20% | -33% | -60% | -67% | $ 6,509,850.37 |
| TSO | Tesoro Gold Ltd | 0.03 | -9% | -3% | -19% | 88% | 3% | $ 49,709,249.31 |
| GUE | Global Uranium | 0.074 | -18% | 17% | -21% | -41% | -24% | $ 19,129,480.92 |
| CPM | Coopermetalslimited | 0.051 | 0% | -11% | -59% | -61% | -85% | $ 4,231,205.10 |
| MM8 | Medallion Metals. | 0.105 | 25% | 102% | 72% | 81% | 62% | $ 44,879,455.72 |
| FFM | Firefly Metals Ltd | 1.1 | 3% | 5% | 54% | 153% | 75% | $ 581,383,200.82 |
| CBY | Canterbury Resources | 0.03 | -6% | -9% | 7% | 11% | 20% | $ 6,318,108.67 |
| LYN | Lycaonresources | 0.255 | -12% | -11% | -9% | 34% | 28% | $ 12,716,357.52 |
| SFR | Sandfire Resources | 10.615 | -3% | 8% | 16% | 80% | 45% | $ 4,822,372,218.52 |
| TMZ | Thomson Res Ltd | 0.005 | 0% | 0% | 0% | 0% | 0% | $ 4,881,018.47 |
| TAM | Tanami Gold NL | 0.036 | 0% | 16% | -5% | -8% | 3% | $ 43,478,590.70 |
| NWM | Norwest Minerals | 0.02 | 0% | -5% | -57% | -38% | -26% | $ 9,702,390.20 |
| ALK | Alkane Resources Ltd | 0.6 | 11% | 32% | -8% | -5% | -8% | $ 353,960,658.68 |
| BMO | Bastion Minerals | 0.007 | 17% | 27% | 0% | -56% | -61% | $ 3,600,572.65 |
| IDA | Indiana Resources | 0.097 | 1% | 2% | 17% | 95% | 22% | $ 61,679,513.77 |
| GSM | Golden State Mining | 0.011 | 10% | 0% | 10% | -50% | -27% | $ 2,793,706.30 |
| NSM | Northstaw | 0.014 | -53% | 14% | -57% | -53% | -66% | $ 3,817,471.00 |
| GSN | Great Southern | 0.016 | -11% | -11% | -20% | -30% | -16% | $ 12,698,755.47 |
| VAU | Vault Minerals Ltd | 0.3925 | 5% | 19% | -9% | 33% | 27% | $ 2,686,976,985.89 |
| DEG | De Grey Mining | 1.445 | 5% | 7% | 12% | 18% | 17% | $ 3,463,314,594.73 |
| THR | Thor Energy PLC | 0.015 | -6% | -12% | -25% | -40% | -50% | $ 3,469,099.04 |
| CDR | Codrus Minerals Ltd | 0.021 | 0% | -5% | -46% | -63% | -63% | $ 3,473,137.58 |
| MDI | Middle Island Res | 0.018 | 0% | 0% | -5% | -5% | 13% | $ 4,641,014.60 |
| WTM | Waratah Minerals Ltd | 0.345 | -3% | 11% | 146% | 721% | 188% | $ 68,613,416.10 |
| POL | Polymetals Resources | 0.54 | 35% | 69% | 89% | 89% | 74% | $ 109,065,972.40 |
| RDS | Redstone Resources | 0.003 | 0% | 0% | -14% | -57% | -50% | $ 2,776,135.38 |
| NAG | Nagambie Resources | 0.017 | 0% | -6% | 55% | 0% | -41% | $ 13,542,806.51 |
| BGL | Bellevue Gold Ltd | 1.6325 | 11% | 35% | -5% | 9% | -3% | $ 2,099,198,338.68 |
| GBR | Greatbould Resources | 0.051 | 0% | 4% | -16% | -23% | -22% | $ 31,079,992.47 |
| KAI | Kairos Minerals Ltd | 0.017 | 21% | 31% | 42% | -15% | 21% | $ 44,725,507.21 |
| KAU | Kaiser Reef | 0.21 | 20% | 40% | 45% | 27% | 24% | $ 42,933,217.74 |
| HRZ | Horizon | 0.052 | 4% | 6% | 53% | 49% | 24% | $ 70,469,223.43 |
| CAI | Calidus Resources | 0.115 | 0% | 0% | -12% | -26% | -47% | $ 93,678,205.58 |
| CDT | Castle Minerals | 0.003 | 0% | 0% | -50% | -73% | -68% | $ 4,118,442.32 |
| RSG | Resolute Mining | 0.8725 | 3% | 18% | 115% | 139% | 96% | $ 1,830,983,011.18 |
| MXR | Maximus Resources | 0.048 | 4% | 37% | 29% | 29% | 40% | $ 20,540,529.17 |
| EVN | Evolution Mining Ltd | 5.28 | 5% | 19% | 33% | 43% | 33% | $ 10,343,930,859.60 |
| CXU | Cauldron Energy Ltd | 0.015 | -17% | -38% | -63% | 92% | -36% | $ 21,908,986.08 |
| DLI | Delta Lithium | 0.25 | 2% | 11% | -14% | -56% | -47% | $ 164,083,642.66 |
| ALY | Alchemy Resource Ltd | 0.008 | 14% | 14% | 33% | -27% | -20% | $ 9,424,610.05 |
| HXG | Hexagon Energy | 0.022 | -8% | -4% | 0% | 175% | 83% | $ 11,284,149.82 |
| OBM | Ora Banda Mining Ltd | 0.915 | 20% | 37% | 205% | 732% | 281% | $ 1,705,611,593.19 |
| AVW | Avira Resources Ltd | 0.001 | 0% | 0% | 0% | -33% | -50% | $ 2,938,790.00 |
| LCY | Legacy Iron Ore | 0.013 | 0% | 0% | -19% | -28% | -24% | $ 100,276,127.41 |
| PDI | Predictive Disc Ltd | 0.2725 | 1% | -1% | 30% | 18% | 30% | $ 611,234,515.58 |
| MAT | Matsa Resources | 0.04 | -5% | 29% | 25% | 25% | 54% | $ 25,353,412.62 |
| ZAG | Zuleika Gold Ltd | 0.016 | 23% | 23% | -20% | -6% | -11% | $ 11,854,078.83 |
| GML | Gateway Mining | 0.025 | 4% | 9% | 39% | 4% | 0% | $ 10,677,404.48 |
| SBM | St Barbara Limited | 0.4825 | 10% | 53% | 82% | 130% | 130% | $ 376,437,075.74 |
| SBR | Sabre Resources | 0.013 | 8% | -13% | -19% | -61% | -61% | $ 5,501,467.06 |
| STK | Strickland Metals | 0.07 | -13% | -22% | -46% | -36% | -26% | $ 154,519,031.94 |
| ION | Iondrive Limited | 0.013 | 18% | 0% | 44% | 0% | 8% | $ 9,210,597.51 |
| CEL | Challenger Gold Ltd | 0.055 | 6% | 2% | -29% | -30% | -26% | $ 80,153,441.37 |
| LRL | Labyrinth Resources | 0.029 | 45% | 123% | 587% | 587% | 489% | $ 119,921,667.21 |
| NST | Northern Star | 18.19 | 7% | 14% | 22% | 49% | 33% | $ 20,016,013,430.01 |
| OZM | Ozaurum Resources | 0.04 | 5% | 8% | -44% | -51% | -73% | $ 5,715,000.00 |
| TG1 | Techgen Metals Ltd | 0.029 | -12% | -17% | -9% | -3% | -63% | $ 4,918,637.01 |
| XAM | Xanadu Mines Ltd | 0.07 | 3% | 19% | 0% | 0% | 19% | $ 116,688,408.61 |
| AQI | Alicanto Min Ltd | 0.036 | 50% | 50% | 96% | -9% | 9% | $ 27,681,289.59 |
| KTA | Krakatoa Resources | 0.0095 | -5% | -5% | -14% | -50% | -74% | $ 4,485,018.59 |
| ARN | Aldoro Resources | 0.082 | 14% | 1% | 17% | -7% | -34% | $ 10,769,899.44 |
| WGX | Westgold Resources. | 3.28 | 10% | 18% | 53% | 62% | 50% | $ 3,083,968,686.30 |
| MBK | Metal Bank Ltd | 0.019 | 6% | 36% | -5% | -44% | -30% | $ 7,418,726.53 |
| A8G | Australasian Metals | 0.11 | -8% | 0% | 59% | -44% | -35% | $ 5,733,254.34 |
| TAR | Taruga Minerals | 0.012 | 20% | 41% | 50% | 20% | 9% | $ 7,766,294.64 |
| DTR | Dateline Resources | 0.0045 | -10% | -10% | -63% | -55% | -55% | $ 10,065,041.88 |
| GOR | Gold Road Res Ltd | 1.95 | 3% | 17% | 18% | 5% | -1% | $ 2,119,261,230.95 |
| S2R | S2 Resources | 0.078 | 0% | 1% | -35% | -62% | -53% | $ 33,964,349.48 |
| NES | Nelson Resources. | 0.002 | 0% | -33% | -33% | -50% | -50% | $ 1,763,152.49 |
| TLM | Talisman Mining | 0.235 | -6% | 4% | -10% | 74% | 0% | $ 44,255,282.02 |
| BEZ | Besragoldinc | 0.082 | -4% | 0% | -7% | -18% | -45% | $ 31,577,160.28 |
| PRU | Perseus Mining Ltd | 2.95 | 4% | 12% | 33% | 68% | 59% | $ 4,045,886,544.84 |
| SPQ | Superior Resources | 0.007 | 0% | 0% | -36% | -69% | -46% | $ 13,019,182.79 |
| PUR | Pursuit Minerals | 0.0025 | -17% | -17% | -50% | -72% | -69% | $ 10,906,199.96 |
| RMS | Ramelius Resources | 2.4 | 0% | 9% | 19% | 35% | 42% | $ 2,783,461,164.99 |
| PKO | Peako Limited | 0.003 | 0% | -25% | -3% | -35% | -22% | $ 2,635,424.60 |
| ICG | Inca Minerals Ltd | 0.006 | 20% | 20% | 33% | -67% | -43% | $ 4,078,112.67 |
| A1G | African Gold Ltd. | 0.091 | 0% | 107% | 174% | 148% | 295% | $ 31,947,397.28 |
| OAU | Ora Gold Limited | 0.008 | 0% | 14% | 60% | 7% | 14% | $ 57,243,874.59 |
| GNM | Great Northern | 0.014 | 8% | 0% | 8% | -33% | -30% | $ 2,319,436.16 |
| KRM | Kingsrose Mining Ltd | 0.04 | 3% | 14% | 11% | -17% | -2% | $ 29,387,534.24 |
| BTR | Brightstar Resources | 0.0225 | 41% | 25% | 25% | 105% | 41% | $ 160,486,313.74 |
| RRL | Regis Resources | 2.79 | 6% | 40% | 27% | 61% | 28% | $ 2,122,892,432.54 |
| M24 | Mamba Exploration | 0.014 | 0% | 17% | -33% | -60% | -72% | $ 2,633,151.86 |
| TRM | Truscott Mining Corp | 0.077 | -3% | 10% | 11% | 23% | 41% | $ 14,090,889.12 |
| TNC | True North Copper | 0.03 | 3% | -9% | -62% | -80% | -69% | $ 26,264,705.94 |
| MOM | Moab Minerals Ltd | 0.005 | 0% | 0% | 0% | -23% | -29% | $ 4,044,071.24 |
| KNB | Koonenberrygold | 0.016 | 0% | 78% | -16% | -48% | -58% | $ 4,892,387.06 |
| AWJ | Auric Mining | 0.38 | 1% | 12% | 111% | 692% | 217% | $ 56,450,280.98 |
| ENR | Encounter Resources | 0.34 | -8% | -25% | -3% | 39% | 17% | $ 155,880,678.63 |
| SNG | Siren Gold | 0.115 | 22% | 64% | 92% | 80% | 69% | $ 24,860,867.28 |
| STN | Saturn Metals | 0.295 | 7% | 7% | 20% | 127% | 74% | $ 86,487,767.52 |
| USL | Unico Silver Limited | 0.34 | 26% | 48% | 113% | 240% | 172% | $ 118,291,991.04 |
| PNM | Pacific Nickel Mines | 0.024 | 0% | 0% | -29% | -69% | -71% | $ 10,103,834.52 |
| AYM | Australia United Min | 0.002 | 0% | 0% | -33% | -33% | -33% | $ 3,685,154.97 |
| ANL | Amani Gold Ltd | 0.001 | 0% | 0% | 0% | 0% | 0% | $ 24,692,167.95 |
| HAV | Havilah Resources | 0.2125 | -1% | 21% | 12% | -8% | 9% | $ 74,636,385.12 |
| SPR | Spartan Resources | 1.5625 | 5% | 12% | 154% | 293% | 202% | $ 1,758,112,409.34 |
| PNT | Panthermetalsltd | 0.036 | 9% | 38% | 43% | -31% | -14% | $ 8,237,202.33 |
| MEK | Meeka Metals Limited | 0.08 | 29% | 45% | 135% | 90% | 100% | $ 160,580,840.36 |
| GMD | Genesis Minerals | 2.515 | 8% | 21% | 42% | 65% | 41% | $ 2,810,085,204.75 |
| PGO | Pacgold | 0.087 | -4% | -40% | -47% | -64% | -54% | $ 9,150,816.60 |
| FEG | Far East Gold | 0.205 | -5% | 17% | 71% | 24% | 64% | $ 56,086,901.91 |
| MI6 | Minerals260Limited | 0.135 | 0% | 4% | -16% | -64% | -58% | $ 32,760,000.00 |
| IGO | IGO Limited | 5.32 | -3% | 1% | -27% | -51% | -41% | $ 3,884,783,880.69 |
| GAL | Galileo Mining Ltd | 0.155 | 7% | -11% | -40% | -52% | -46% | $ 28,655,614.42 |
| RXL | Rox Resources | 0.195 | 44% | 50% | -13% | -11% | 6% | $ 80,066,080.97 |
| PTN | Patronus Resources | 0.072 | 24% | 47% | 4% | 41% | 7% | $ 104,793,459.46 |
| CLZ | Classic Min Ltd | 0.001 | 0% | 0% | -86% | -98% | -98% | $ 1,544,025.56 |
| TGM | Theta Gold Mines Ltd | 0.18 | -3% | 6% | 13% | 33% | 57% | $ 152,598,977.47 |
| FAL | Falconmetalsltd | 0.165 | 0% | -15% | 18% | 10% | 14% | $ 30,090,000.00 |
| SXG | Southern Cross Gold | 3.25 | -1% | 2% | 58% | 274% | 158% | $ 642,966,996.96 |
| SPD | Southernpalladium | 0.54 | 8% | 15% | 8% | 42% | 44% | $ 48,465,000.00 |
| ORN | Orion Minerals Ltd | 0.019 | 0% | 12% | 6% | 12% | 36% | $ 136,730,781.56 |
| TMB | Tambourahmetals | 0.035 | 9% | -8% | -55% | -73% | -69% | $ 3,159,231.87 |
| TMS | Tennant Minerals Ltd | 0.014 | 8% | 0% | -42% | -46% | -58% | $ 13,382,465.81 |
| AZY | Antipa Minerals Ltd | 0.027 | -18% | 23% | 145% | 108% | 59% | $ 152,845,715.74 |
| PXX | Polarx Limited | 0.009 | 0% | 13% | -31% | 3% | 32% | $ 21,379,508.80 |
| TRE | Toubani Res Ltd | 0.29 | 0% | -8% | 115% | 176% | 100% | $ 68,357,987.70 |
| AUN | Aurumin | 0.051 | -6% | 9% | 4% | 82% | 96% | $ 23,242,905.44 |
| GPR | Geopacific Resources | 0.027 | 8% | 8% | 0% | 59% | 35% | $ 30,759,882.95 |
| FXG | Felix Gold Limited | 0.087 | 2% | 1% | 19% | 45% | 78% | $ 30,236,335.07 |
| ILT | Iltani Resources Lim | 0.235 | -2% | -2% | 34% | 57% | 47% | $ 10,562,521.20 |
| BRX | Belararoxlimited | 0.235 | -18% | -2% | 15% | -51% | -24% | $ 25,365,955.90 |
| TM1 | Terra Metals Limited | 0.044 | 13% | 16% | -25% | -6% | -4% | $ 15,491,615.49 |
| TOR | Torque Met | 0.076 | 1% | -13% | -46% | -53% | -65% | $ 17,785,058.38 |
| ARD | Argent Minerals | 0.029 | 61% | 61% | 53% | 190% | 222% | $ 41,873,844.31 |
Top ASX Gold Stories This Week
Yandal Resources (ASX:YRL)
Look no further than Yandal for your gains this week. The Northern Goldfields explorer jumped 150% on a monster hit at its Ironstone Well-Barwidgee gold project near Wiluna in WA.
Yandal is located in a very interesting position, given any gold discovery even if it isn’t a standalone operation, is in a prime location for the always acquisitive Northern Star to take a look.
NST notably paid $61m for Strickland Metals’ (ASX:STK) Millrose project to feed its Jundee gold ops, then used that cash to head to Serbia where its exploring the massive 5.4Moz gold equivalent Rogozna project.
Yandal returned the final assay results from a 12-hole, 2400m RC program at the New England prospect on Monday.
But the hit that had investors really looking deeply into Yandal’s dreamy eyes was a 78m intercept at 1.2g/t gold from a relatively shallow 96m in hole 24IWBRC0039.
Another hole, 24IWBRC0044, was completed 170m to the north-west, intersecting 14m at 1.8g/t gold from 63m including 3m at 4.9g/t gold from 64m.
Gold mineralisation within the emerging discovery, now called Siona, remains open at depth and along strike.
YRL managing director Chris Oorschot described the results as “exceptional”, suggesting they may point to a “significant emerging gold discovery” within the Ironstone Well-Barwidgee project area. YRL wants to conduct follow up drilling to work out the scale at Siona very soon.
It now says it’s seeing strong uptake from option holders who are in the money at over 24c. The options are expiring at the end of the month – how fortuitous – with two company directors and large shareholder Gold Road Resources (ASX:GOR) among the investors making hay while the sun shines and the market cares.
GOR exercised over 2m shares at 24c and close to 6.7m at 11c, which were due to expire on November 17 next year.
Advance Metals (ASX:AVM)
AVM bounded over 50% higher today on the acquisition of the 17.23Moz silver equivalent Yoquivo project in Mexico, becoming the latest ASX explorer to step into the world’s premier silver jurisdiction.
The Yoquivo district is a past-producing, epithermal vein gold and silver region with numerous bonanza-grade silver drill intersections scattered throughout the project area including highlights of 1.2m at 34g/t gold and 1895g/t silver from 47.3m.
AVM entered into a binding sale agreement with NYSE-listed Golden Minerals Company who’ve completed in excess of 16,500m of drilling at Yoquivo since 2020.
Silver is trading around decade long highs at over US$34/oz, having entered 2024 at ~US$24/oz.
This article does not constitute financial product advice. You should consider obtaining independent advice before making any financial decisions.
Related Topics

Related Stories


UNLOCK INSIGHTS
Discover the untold stories of emerging ASX stocks.
Daily news and expert analysis, it's free to subscribe.
By proceeding, you confirm you understand that we handle personal information in accordance with our Privacy Policy.


