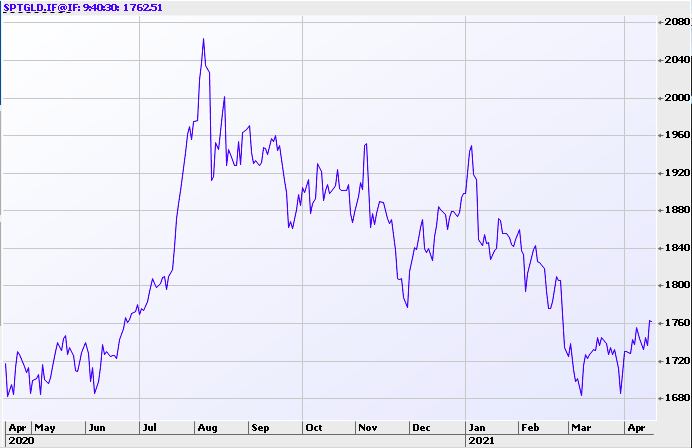
Gold Digger: Geopolitical tantrums help, but they aren’t the main reason gold prices will recover later this year

Pic: Getty
The gold price traditionally thrives on geopolitical drama.
Heightened tensions in eastern Ukraine, the recent incident at an Iranian nuclear site, and news of an unofficial US delegation visiting Taiwan are recent reminders that 2021 will be yet another year when geopolitical risks abound.
These potential flareups – in a world still knocked about by COVID-19 – could benefit the gold price, and by extension, gold stocks.
However, history shows us that the positive impact is short-lived, Metals Focus says.
>>> scroll down for the performance of ASX-listed gold & silver stocks over the past week >>>
“We think it unlikely that such events will have a lasting effect on gold and other precious metals prices,” it says.
“This assessment is based on how gold has often reacted to crises over the past 30-40 years.
“In most cases … gold did achieve some healthy upside, in some cases quite dramatically.
“However, this often proved to be a knee-jerk reaction, with prices quite often returning to pre-crisis levels in a relatively short period of time.”
An outlier was the Soviet Union’s invasion of Afghanistan in December 1979, Metals Focus says.

“Who Are You?” “Your Worst Nightmare.” (Rambo III (1988), TriStar Pictures)
“Although the price had been rising for some time before the invasion (as the second oil crisis unfolded), this saw gold more than double in a matter of days to a then all-time high of around $850/oz,” it says.
“Gold then remained strong for an extended period, but this owed more to the oil crisis and its impact on the global economy, including the US dollar, which at that time had weakened to multi-year lows.”
The emphasis — and ‘Rambo fighting Russians in Afghanistan’ gif — are ours.
It indicates that the macro backdrop is more important to the gold price than Rambo’s geopolitical posturing.
The backdrop is positive in 2021, Metals Focus says.
“Monetary and fiscal policies, including the persistence of ultra-low interest rates and negative real yields, and concerns about future inflation will continue to make the case for strong gold investment for the foreseeable future,” it says.
“Partly related to this, we are sceptical that the recent strength in the US dollar will continue as we progress through this year.
“We believe all this will eventually help gold to recover, with the price expected to strengthen later this year and into 2022.”
Winners and Losers
Here’s how ASX-listed gold and silver stocks are performing:
Scroll or swipe to reveal table. Click headings to sort. Best viewed on a laptop
| CODE | COMPANY | 1 WEEK RETURN % | 1 MONTH RETURN % | 6 MONTH RETURN % | 1 YEAR RETURN % | PRICE | MARKET CAP |
|---|---|---|---|---|---|---|---|
| ANL | Amani Gold | 50 | 0 | -25 | -25 | 0.0015 | $ 10,786,996.75 |
| NPM | Newpeak Metals | 50 | 50 | 0 | 0 | 0.003 | $ 17,022,483.89 |
| LCY | Legacy Iron Ore | 47 | 47 | 340 | 2100 | 0.022 | $ 128,094,770.34 |
| PNM | Pacific Nickel Mines | 33 | 5 | 15 | -40 | 0.06 | $ 8,986,475.28 |
| FFX | Firefinch | 33 | 36 | 74 | 578 | 0.305 | $ 226,854,714.73 |
| NAE | New Age Exploration | 31 | 31 | 6 | 750 | 0.017 | $ 18,293,143.65 |
| E2M | E2 Metals | 27 | 13 | 90 | 525 | 0.4 | $ 54,057,026.16 |
| ARN | Aldoro Resources | 25 | 128 | 359 | 256 | 0.445 | $ 29,955,553.32 |
| ONX | Orminex | 24 | 68 | 108 | 44 | 0.052 | $ 25,524,429.26 |
| BBX | BBX Minerals | 21 | -15 | -48 | 109 | 0.23 | $ 88,982,476.10 |
| KCC | Kincora Copper | 20 | 0.265 | $ 12,000,000.00 | |||
| GTR | Gti Resources | 19 | 25 | 9 | 400 | 0.025 | $ 16,757,467.95 |
| VRC | Volt Resources | 19 | 12 | 58 | 217 | 0.019 | $ 45,226,233.92 |
| AME | Alto Metals Limited | 18 | 35 | -5 | 72 | 0.105 | $ 42,324,415.09 |
| GWR | GWR Group | 17 | 17 | 49 | 336 | 0.305 | $ 89,322,000.69 |
| RED | Red 5 Limited | 17 | 7 | -33 | -14 | 0.19 | $ 409,998,317.57 |
| PDI | Predictive Disc | 16 | 27 | 46 | 80 | 0.089 | $ 84,416,966.21 |
| GBZ | GBM Rsources | 15 | 5 | -23 | 77 | 0.115 | $ 51,962,167.20 |
| TLM | Talisman Mining | 14 | 24 | 4 | 62 | 0.12 | $ 19,595,980.43 |
| PNX | PNX Metals Limited | 14 | 14 | -27 | 14 | 0.008 | $ 27,391,451.33 |
| BRB | Breaker Res NL | 14 | 23 | 4 | 20 | 0.24 | $ 74,943,413.67 |
| HRN | Horizon Gold | 14 | 2 | 2 | 144 | 0.44 | $ 38,631,448.68 |
| SKY | SKY Metals | 13 | 10 | -6 | -38 | 0.17 | $ 40,697,221.62 |
| AMI | Aurelia Metals | 13 | 20 | -8 | 33 | 0.46 | $ 549,275,303.63 |
| MM8 | Medallion Metals. | 13 | 0.27 | $ 20,447,019.71 | |||
| RDN | Raiden Resources | 13 | 23 | -27 | 575 | 0.027 | $ 32,732,185.89 |
| SNG | Siren Gold | 13 | -4 | 1 | 0.405 | $ 24,824,347.02 | |
| SRN | Surefire Rescs NL | 13 | -4 | -10 | 1250 | 0.027 | $ 26,331,849.84 |
| RSG | Resolute Mining | 12 | -16 | -46 | -46 | 0.52 | $ 557,465,816.53 |
| CAZ | Cazaly Resources | 12 | 9 | -4 | 124 | 0.047 | $ 16,630,347.02 |
| CMM | Capricorn Metals | 12 | 13 | -2 | 47 | 1.79 | $ 623,221,866.13 |
| STK | Strickland Metals | 12 | 7 | -73 | 71 | 0.022 | $ 9,686,484.98 |
| KAU | Kaiser Reef | 11 | -6 | -17 | 100 | 0.34 | $ 30,010,589.74 |
| PRU | Perseus Mining | 11 | 10 | -4 | 27 | 1.33 | $ 1,563,732,509.25 |
| AQX | Alice Queen | 11 | -23 | -38 | -9 | 0.02 | $ 20,834,707.81 |
| AYM | Australia United Min | 11 | 0 | -47 | 400 | 0.01 | $ 18,425,774.85 |
| DGO | DGO Gold Limited | 11 | 23 | 1 | 89 | 3.55 | $ 255,960,083.04 |
| NAG | Nagambie Resources | 10 | 56 | 48 | 100 | 0.086 | $ 42,994,181.76 |
| FFR | Firefly Resources | 10 | -8 | -31 | 456 | 0.11 | $ 32,270,650.65 |
| RMX | Red Mount Min | 10 | 0 | -15 | 267 | 0.011 | $ 13,764,547.38 |
| PF1 | Pathfinder Resources | 10 | 17 | 0.275 | $ 13,674,152.25 | ||
| EM2 | Eagle Mountain | 10 | 74 | 124 | 795 | 0.895 | $ 150,275,096.66 |
| MBK | Metal Bank | 9 | 9 | 9 | 151 | 0.012 | $ 13,029,591.34 |
| BTR | Brightstar Resources | 9 | -25 | 29 | 800 | 0.036 | $ 14,511,775.21 |
| CDT | Castle Minerals | 9 | 0 | -8 | 100 | 0.012 | $ 7,325,008.18 |
| KRM | Kingsrose Mining | 9 | 0 | 37 | 66 | 0.048 | $ 34,310,345.54 |
| SPQ | Superior Resources | 9 | 0 | 0 | 540 | 0.012 | $ 15,194,693.70 |
| DEG | De Grey Mining | 9 | 33 | 2 | 325 | 1.3 | $ 1,598,795,315.64 |
| SLR | Silver Lake Resource | 9 | 15 | -23 | 4 | 1.86 | $ 1,573,611,937.28 |
| SFM | Santa Fe Minerals | 9 | -9 | 25 | 100 | 0.1 | $ 7,281,878.90 |
| GBR | Greatbould Resources | 9 | 3 | -41 | 48 | 0.038 | $ 10,520,899.37 |
| KWR | Kingwest Resources | 8 | -4 | -32 | -14 | 0.13 | $ 21,388,534.83 |
| ZNC | Zenith Minerals | 8 | 0 | 18 | 217 | 0.13 | $ 38,266,803.90 |
| WAF | West African Res | 8 | 21 | -4 | 99 | 1.04 | $ 900,708,832.50 |
| RML | Resolution Minerals | 8 | 17 | -39 | -73 | 0.027 | $ 11,438,385.33 |
| FML | Focus Minerals | 8 | -1 | -22 | 28 | 0.31 | $ 54,824,569.50 |
| AMG | Ausmex Mining Gp | 8 | 8 | 17 | 27 | 0.056 | $ 31,040,563.62 |
| AUT | Auteco Minerals | 8 | 9 | -32 | 206 | 0.098 | $ 148,881,998.92 |
| OKU | Oklo Resources | 8 | -20 | -52 | -44 | 0.14 | $ 68,044,024.62 |
| GSN | Great Southern | 8 | -2 | -38 | 33 | 0.057 | $ 25,481,143.52 |
| HMX | Hammer Metals | 7 | 9 | 139 | 425 | 0.105 | $ 78,759,113.16 |
| MRZ | Mont Royal Resources | 7 | 15 | -12 | 114 | 0.3 | $ 9,963,261.00 |
| GOR | Gold Road Res | 7 | 9 | -14 | -26 | 1.3 | $ 1,114,314,007.07 |
| DCN | Dacian Gold | 7 | -6 | 1 | -4 | 0.385 | $ 308,318,263.38 |
| YRL | Yandal Resources | 6 | 9 | -1 | 151 | 0.495 | $ 44,075,993.70 |
| RMS | Ramelius Resources | 6 | 14 | -21 | 54 | 1.75 | $ 1,400,109,697.52 |
| M2R | Miramar | 6 | 19 | 0.25 | $ 9,923,467.20 | ||
| WGX | Westgold Resources. | 6 | 11 | -16 | 11 | 2.32 | $ 957,912,910.20 |
| ARL | Ardea Resources | 6 | 1 | 6 | 91 | 0.525 | $ 66,388,702.64 |
| SVL | Silver Mines Limited | 6 | -1 | 6 | 147 | 0.22 | $ 249,342,240.63 |
| OKR | Okapi Resources | 6 | 0 | 0 | 227 | 0.18 | $ 8,856,137.16 |
| HAW | Hawthorn Resources | 6 | -28 | -49 | -43 | 0.056 | $ 18,676,874.33 |
| RXL | Rox Resources | 5 | 3 | -35 | 56 | 0.039 | $ 89,836,338.73 |
| BAR | Barra Resources | 5 | -5 | -26 | 43 | 0.02 | $ 12,874,553.92 |
| MAT | Matsa Resources | 5 | -10 | -45 | -27 | 0.08 | $ 21,420,590.01 |
| CLA | Celsius Resource | 5 | -13 | 8 | 300 | 0.04 | $ 33,448,287.08 |
| IDA | Indiana Resources | 5 | 12 | 38 | 343 | 0.083 | $ 23,845,070.14 |
| NCM | Newcrest Mining | 5 | 14 | -12 | -5 | 27.7 | $ 21,944,228,230.20 |
| CBY | Canterbury Resources | 5 | 0 | -21 | 57 | 0.11 | $ 12,305,171.67 |
| PAK | Pacific American Hld | 5 | -8 | 5 | 50 | 0.022 | $ 7,008,867.80 |
| CHN | Chalice Mining | 5 | 47 | 112 | 526 | 6.48 | $ 2,227,107,197.56 |
| HRZ | Horizon | 5 | 15 | -4 | 77 | 0.115 | $ 70,996,900.00 |
| TMZ | Thomson Res | 5 | -18 | 44 | 535 | 0.115 | $ 52,269,108.97 |
| CYL | Catalyst Metals | 5 | -2 | -21 | -5 | 2.09 | $ 205,438,061.07 |
| DEX | Duke Exploration | 4 | 11 | 0.35 | $ 20,212,898.69 | ||
| KCN | Kingsgate Consolid. | 4 | 10 | 12 | 103 | 0.935 | $ 209,258,994.50 |
| KZR | Kalamazoo Resources | 4 | 0 | -27 | -11 | 0.47 | $ 58,054,230.96 |
| AL8 | Alderan Resource | 4 | -10 | -45 | 373 | 0.071 | $ 21,153,817.53 |
| ARV | Artemis Resources | 4 | 17 | -37 | 296 | 0.095 | $ 105,719,081.48 |
| AAJ | Aruma Resources | 4 | 29 | -40 | 140 | 0.072 | $ 7,629,186.74 |
| TAR | Taruga Minerals | 4 | 6 | -31 | 456 | 0.05 | $ 21,945,672.29 |
| ICG | Inca Minerals | 4 | 18 | 141 | 351 | 0.13 | $ 46,392,426.00 |
| MTC | Metalstech | 4 | -21 | -21 | -16 | 0.135 | $ 18,320,954.75 |
| NST | Northern Star | 4 | 20 | -30 | -14 | 11.19 | $ 12,669,889,031.91 |
| CWX | Carawine Resources | 4 | -19 | 2 | 45 | 0.275 | $ 28,855,824.03 |
| GML | Gateway Mining | 4 | -6 | 38 | 123 | 0.029 | $ 53,301,796.80 |
| CEL | Challenger Exp | 3 | 2 | 41 | 182 | 0.31 | $ 168,490,289.60 |
| TSO | Tesoro Resources | 3 | 0 | -62 | 319 | 0.19 | $ 94,909,562.85 |
| EVN | Evolution Mining | 3 | 13 | -25 | -7 | 4.59 | $ 7,552,308,515.70 |
| BMO | Bastion Minerals | 3 | -3 | 0.195 | $ 10,916,309.40 | ||
| TBR | Tribune Res | 2 | 9 | -26 | -5 | 5.41 | $ 284,376,977.34 |
| HCH | Hot Chili | 2 | -4 | 18 | 144 | 0.045 | $ 141,566,272.59 |
| GUL | Gullewa Limited | 2 | 2 | -16 | 104 | 0.092 | $ 16,778,325.20 |
| WWI | West Wits Mining | 2 | -12 | 142 | 736 | 0.092 | $ 126,095,076.45 |
| SSR | SSR Mining Inc. | 2 | 5 | -24 | 20.48 | $ 357,561,580.26 | |
| ALK | Alkane Resources | 2 | 1 | -47 | -17 | 0.735 | $ 428,679,936.00 |
| BC8 | Black Cat Syndicate | 2 | 5 | -8 | 86 | 0.745 | $ 78,357,493.57 |
| M24 | Mamba Exploration | 2 | 14 | 0.28 | $ 9,990,000.00 | ||
| A1G | African Gold . | 2 | 12 | 81 | 218 | 0.28 | $ 25,496,196.32 |
| ADT | Adriatic Metals | 2 | 2 | 2 | 83 | 2.26 | $ 408,446,864.28 |
| PGD | Peregrine Gold | 2 | 0.285 | $ 7,796,661.21 | |||
| BDC | Bardoc Gold | 1 | -5 | -5 | 11 | 0.073 | $ 123,203,273.70 |
| XAM | Xanadu Mines | 1 | 45 | 76 | 147 | 0.074 | $ 80,796,272.63 |
| LCL | Los Cerros Limited | 1 | 50 | -9 | 650 | 0.19 | $ 84,825,189.00 |
| MOH | Moho Resources | 1 | -1 | -27 | 0 | 0.08 | $ 8,244,612.16 |
| MKG | Mako Gold | 1 | -6 | -17 | 107 | 0.091 | $ 23,408,985.78 |
| BGL | Bellevue Gold | 1 | 17 | -26 | 64 | 0.91 | $ 762,088,277.07 |
| SBM | St Barbara Limited | 0 | 5 | -30 | -16 | 2.12 | $ 1,465,609,243.23 |
| OZM | Ozaurum Resources | 0 | -8 | 0.18 | $ 9,883,800.00 | ||
| DLC | Delecta Limited | 0 | 0 | 0 | 50 | 0.006 | $ 7,060,348.44 |
| TRM | Truscott Mining Corp | 0 | 0 | 5 | 320 | 0.021 | $ 2,686,772.42 |
| GMR | Golden Rim Resources | 0 | 25 | -44 | 67 | 0.01 | $ 26,703,496.79 |
| GMN | Gold Mountain | 0 | 3 | -2 | -20 | 0.04 | $ 29,006,734.54 |
| GNM | Great Northern | 0 | -9 | -50 | 100 | 0.01 | $ 10,579,196.04 |
| ERM | Emmerson Resources | 0 | 9 | -15 | 7 | 0.075 | $ 36,371,409.70 |
| ALY | Alchemy Resource | 0 | 33 | -27 | 49 | 0.016 | $ 10,755,895.25 |
| FAU | First Au | 0 | 0 | -16 | 100 | 0.016 | $ 9,814,060.06 |
| WCN | White Cliff Min | 0 | -5 | -28 | 500 | 0.018 | $ 9,309,535.18 |
| AWV | Anova Metals | 0 | 4 | -11 | 184 | 0.025 | $ 35,827,355.00 |
| PRS | Prospech Limited | 0 | -7 | 0 | 0 | 0.125 | $ 8,127,573.63 |
| BYH | Bryah Resources | 0 | 25 | 15 | 169 | 0.07 | $ 10,747,835.56 |
| MEG | Megado | 0 | -3 | 0.17 | $ 6,935,795.66 | ||
| MAU | Magnetic Resources | 0 | 2 | 23 | 126 | 1.58 | $ 341,550,775.66 |
| DCX | Discovex Res | 0 | 0 | 0 | 133 | 0.007 | $ 17,980,648.53 |
| KGM | Kalnorth Gold | 0 | 0 | 0 | 333 | 0.013 | $ 11,625,120.78 |
| KTA | Krakatoa Resources | 0 | -8 | -41 | 45 | 0.058 | $ 16,737,000.00 |
| LNY | Laneway Res | 0 | 0 | -14 | 33 | 0.006 | $ 22,650,395.60 |
| MLS | Metals Australia | 0 | -20 | 0 | 100 | 0.002 | $ 8,454,376.09 |
| TNR | Torian Resources | 0 | -22 | 80 | 291 | 0.045 | $ 36,060,788.02 |
| XTC | Xantippe Res | 0 | -33 | -33 | -33 | 0.002 | $ 8,149,128.80 |
| MEU | Marmota Limited | 0 | -4 | -6 | 19 | 0.044 | $ 43,584,016.05 |
| PNR | Pantoro Limited | 0 | -5 | -17 | 70 | 0.195 | $ 274,637,654.46 |
| MML | Medusa Mining | 0 | -6 | 1 | 54 | 0.84 | $ 171,495,473.33 |
| NXM | Nexus Minerals | 0 | -5 | -37 | 128 | 0.091 | $ 22,217,802.06 |
| EMR | Emerald Res NL | 0 | 0 | 30 | 105 | 0.81 | $ 412,317,765.60 |
| TTM | Titan Minerals | 0 | -9 | -26 | 49 | 0.1 | $ 110,526,886.10 |
| MHC | Manhattan Corp | 0 | -22 | -52 | 180 | 0.014 | $ 21,367,901.70 |
| BAT | Battery Minerals | 0 | -16 | 50 | 320 | 0.021 | $ 42,866,744.36 |
| CTO | Citigold Corp | 0 | -8 | -20 | 200 | 0.012 | $ 36,140,000.00 |
| RND | Rand Mining | 0 | 8 | -30 | -6 | 1.62 | $ 97,440,529.50 |
| CAI | Calidus Resources | 0 | -10 | -37 | 39 | 0.42 | $ 165,970,441.98 |
| MTH | Mithril Resources | 0 | -5 | -40 | 200 | 0.018 | $ 42,304,194.74 |
| VAN | Vango Mining | 0 | 18 | -14 | -39 | 0.085 | $ 86,797,855.28 |
| MCT | Metalicity Limited | 0 | -13 | -43 | 275 | 0.013 | $ 22,972,615.32 |
| WMX | Wiluna Mining Corp | -1 | -7 | -44 | -9 | 1 | $ 126,215,506.00 |
| STN | Saturn Metals | -1 | 17 | -44 | 19 | 0.415 | $ 46,110,449.10 |
| AGG | AngloGold Ashanti | -2 | -1 | -26 | -23 | 5.77 | $ 500,455,561.65 |
| TIN | Tnt Mines Limited | -2 | -6 | -30 | 223 | 0.155 | $ 14,945,596.00 |
| WRM | White Rock Min | -2 | 2 | 9 | 50 | 0.6 | $ 42,897,297.56 |
| CST | Castile Resources | -2 | 38 | -39 | 132 | 0.255 | $ 50,926,080.86 |
| AUC | Ausgold Limited | -2 | 4 | -7 | 257 | 0.05 | $ 65,017,477.05 |
| PRX | Prodigy Gold NL | -2 | 10 | -4 | 25 | 0.045 | $ 26,708,869.88 |
| AXE | Archer Materials | -2 | -15 | 76 | 433 | 0.88 | $ 201,172,525.94 |
| REZ | Resourc & En Grp | -2 | 11 | 37 | 310 | 0.041 | $ 16,835,550.77 |
| ZAG | Zuleika Gold | -2 | -5 | -2 | 86 | 0.041 | $ 16,813,828.29 |
| HWK | Hawkstone Mng | -2 | 14 | 215 | 583 | 0.041 | $ 67,023,792.24 |
| NSM | Northstaw | -3 | -11 | -8 | 0.39 | $ 15,600,000.00 | |
| NWM | Norwest Minerals | -3 | -7 | -22 | -54 | 0.076 | $ 8,707,214.32 |
| ANX | Anax Metals | -3 | 4 | 203 | 412 | 0.074 | $ 25,213,240.08 |
| VMC | Venus Metals Cor | -3 | -3 | -29 | -3 | 0.18 | $ 27,194,162.94 |
| TRY | Troy Resources | -3 | 1 | -54 | -14 | 0.071 | $ 53,029,463.76 |
| AGC | AGC | -3 | 0 | 0.17 | $ 11,513,638.28 | ||
| AGC | AGC | -3 | 0 | 0.17 | $ 11,513,638.28 | ||
| AOP | Apollo Consolidated | -3 | -8 | -3 | 53 | 0.33 | $ 92,358,588.80 |
| AGS | Alliance Resources | -3 | -11 | -24 | 98 | 0.165 | $ 34,322,827.11 |
| MZZ | Matador Mining | -3 | 8 | -29 | 103 | 0.325 | $ 55,586,978.88 |
| CY5 | Cygnus Gold Limited | -3 | -6 | -18 | 290 | 0.16 | $ 17,347,215.68 |
| TIE | Tietto Minerals | -3 | -11 | -43 | 16 | 0.315 | $ 141,107,491.36 |
| S2R | S2 Resources | -3 | -9 | -50 | 50 | 0.15 | $ 45,659,220.96 |
| MEI | Meteoric Resources | -3 | -15 | 4 | 287 | 0.058 | $ 74,943,117.72 |
| NML | Navarre Minerals | -3 | -6 | -28 | 65 | 0.145 | $ 79,205,111.90 |
| MKR | Manuka Resources. | -3 | 14 | -12 | 0.435 | $ 40,121,951.52 | |
| BRV | Big River Gold | -3 | 8 | -15 | 102 | 0.42 | $ 89,922,456.65 |
| PUR | Pursuit Minerals | -4 | 40 | 625 | 2074 | 0.081 | $ 71,355,868.36 |
| ASO | Aston Minerals | -4 | 65 | 202 | 900 | 0.13 | $ 113,320,665.77 |
| PUA | Peak Minerals | -4 | 4 | -24 | 134 | 0.026 | $ 15,982,268.95 |
| SMI | Santana Minerals | -4 | -4 | -38 | -38 | 0.13 | $ 14,824,242.68 |
| NUS | Nusantara Resources | -4 | 0 | -13 | 16 | 0.26 | $ 59,610,981.82 |
| TAM | Tanami Gold NL | -4 | -10 | 7 | 81 | 0.076 | $ 89,307,375.50 |
| OBM | Ora Banda Mining | -4 | 2 | -26 | 49 | 0.25 | $ 214,766,599.04 |
| MGV | Musgrave Minerals | -4 | 9 | -37 | 204 | 0.365 | $ 197,292,491.13 |
| BNR | Bulletin Res | -4 | -3 | -3 | 89 | 0.07 | $ 12,550,515.18 |
| GED | Golden Deeps | -4 | 15 | -26 | 64 | 0.0115 | $ 8,523,365.84 |
| MRR | Minrex Resources | -4 | 0 | -19 | 57 | 0.022 | $ 11,573,878.16 |
| IPT | Impact Minerals | -5 | -19 | -16 | 200 | 0.021 | $ 37,398,615.26 |
| SVY | Stavely Minerals | -5 | -15 | 9 | 45 | 0.63 | $ 157,881,678.46 |
| OAU | Ora Gold Limited | -5 | -9 | -16 | 62 | 0.021 | $ 20,180,285.33 |
| NMR | Native Mineral Res | -5 | -3 | 0.29 | $ 8,355,915.00 | ||
| DRE | Drednought Resources | -5 | 12 | -42 | 280 | 0.019 | $ 45,476,948.82 |
| GRL | Godolphin Resources | -5 | -5 | -24 | 73 | 0.19 | $ 15,980,980.18 |
| ADN | Andromeda Metals | -5 | -34 | 104 | 733 | 0.275 | $ 594,200,152.43 |
| GIB | Gibb River Diamonds | -5 | -10 | -45 | 163 | 0.071 | $ 15,863,208.38 |
| LEX | Lefroy Exploration | -5 | 120 | 412 | 731 | 1.33 | $ 162,613,098.79 |
| BCN | Beacon Minerals | -6 | -6 | 2 | 10 | 0.034 | $ 121,693,088.29 |
| ADV | Ardiden | -6 | -15 | -47 | 467 | 0.017 | $ 34,389,667.46 |
| IVR | Investigator Res | -6 | -8 | 53 | 440 | 0.081 | $ 107,239,675.17 |
| BNZ | Benzmining | -6 | 3 | 0.8 | $ 26,676,529.43 | ||
| ENR | Encounter Resources | -6 | 3 | -50 | 60 | 0.16 | $ 50,490,192.48 |
| NVA | Nova Minerals | -6 | -6 | 55 | 288 | 0.155 | $ 250,491,997.05 |
| EMU | EMU NL | -6 | -21 | -4 | 142 | 0.046 | $ 19,948,237.73 |
| THR | Thor Mining PLC | -6 | 7 | 0 | 275 | 0.015 | $ 7,543,343.91 |
| TRN | Torrens Mining | -6 | -17 | 0.145 | $ 9,843,243.37 | ||
| GSM | Golden State Mining | -7 | -3 | -53 | 57 | 0.14 | $ 11,584,770.12 |
| CHZ | Chesser Resources | -7 | -21 | -49 | 101 | 0.135 | $ 60,952,786.88 |
| DTM | Dart Mining NL | -7 | -29 | -21 | 179 | 0.135 | $ 13,492,639.26 |
| CXU | Cauldron Energy | -7 | 8 | 14 | 111 | 0.04 | $ 18,079,980.48 |
| VKA | Viking Mines | -7 | -3 | 114 | 800 | 0.039 | $ 36,405,892.80 |
| AAU | Antilles Gold | -7 | -19 | 141 | 305 | 0.089 | $ 16,587,040.17 |
| MVL | Marvel Gold Limited | -8 | 4 | -32 | 102 | 0.049 | $ 25,940,846.96 |
| SIH | Sihayo Gold Limited | -8 | 0 | -52 | -4 | 0.012 | $ 44,225,536.96 |
| RDS | Redstone Resources | -8 | 0 | -20 | 200 | 0.012 | $ 7,908,989.69 |
| RVR | Red River Resources | -8 | -10 | 19 | 233 | 0.22 | $ 111,321,488.91 |
| SAU | Southern Gold | -9 | 6 | -29 | -37 | 0.085 | $ 18,132,944.26 |
| G88 | Golden Mile Res | -9 | 102 | 54 | 304 | 0.105 | $ 13,206,741.16 |
| AWJ | Auric Mining | -9 | 18 | 0.2 | $ 8,098,567.60 | ||
| AAR | Anglo Australian | -9 | 8 | -41 | -26 | 0.1 | $ 58,900,838.40 |
| PKO | Peako Limited | -9 | 15 | -9 | 192 | 0.03 | $ 5,761,625.31 |
| MDI | Middle Island Res | -10 | -11 | -36 | 2 | 0.235 | $ 28,762,999.61 |
| RRL | Regis Resources | -10 | -5 | -45 | -31 | 2.73 | $ 1,380,698,061.95 |
| DDD | 3D Resources Limited | -10 | -9 | -9 | 263 | 0.0045 | $ 18,101,860.46 |
| DTR | Dateline Resources | -10 | 29 | 80 | 125 | 0.0045 | $ 35,324,312.30 |
| KSN | Kingston Resources | -10 | 0 | -12 | 57 | 0.22 | $ 62,422,128.12 |
| SI6 | SI6 Metals Limited | -11 | -16 | 23 | 700 | 0.016 | $ 23,681,216.99 |
| KAI | Kairos Minerals | -11 | 28 | -59 | 243 | 0.032 | $ 51,969,668.64 |
| SLZ | Sultan Resources | -12 | -3 | -12 | 177 | 0.18 | $ 12,863,861.97 |
| RGL | Riversgold | -12 | 2 | -22 | 525 | 0.05 | $ 19,977,109.80 |
| AQI | Alicanto Min | -13 | 0 | -48 | 94 | 0.105 | $ 34,326,333.41 |
| AVW | Avira Resources | -13 | 0 | -13 | 250 | 0.007 | $ 9,625,280.00 |
| CGN | Crater Gold Min | -14 | -21 | 58 | 73 | 0.019 | $ 24,549,917.34 |
| SBR | Sabre Resources | -14 | 33 | -40 | 500 | 0.006 | $ 10,098,381.89 |
| MSR | Manas Res | -14 | 0 | -25 | 200 | 0.006 | $ 19,321,915.19 |
| TSC | Twenty Seven Co. | -14 | -8 | -25 | 0 | 0.006 | $ 11,707,034.07 |
| AZS | Azure Minerals | -14 | 9 | -8 | 286 | 0.355 | $ 104,749,145.14 |
| HXG | Hexagon Energy | -15 | -18 | 129 | 59 | 0.094 | $ 37,016,768.15 |
| TMX | Terrain Minerals | -15 | 10 | -21 | 175 | 0.011 | $ 8,829,132.11 |
| NES | Nelson Resources | -20 | -24 | 8 | 169 | 0.084 | $ 11,928,801.74 |
Small Cap Standouts
NEW AGE EXPLORATION (ASX:NAE) +31%
The explorer has kicked off an early stage, pre-drilling survey in the Central Pilbara gold district in WA.
This tenure is next door to Novo’s (TSE:NVO) Egina gold project and less than 50km from De Grey’s (ASX:DEG) colossal Hemi discovery.
Most of the ground is under cover and has received little attention from historical gold prospectors, NAE exec director Joshua Wellisch says.
“We are excited to see the results in the coming weeks in the lead up to our maiden drill program to the North,” he says.
ORMINEX (ASX:ONX) +24%
In December, this former struggler sold 50% of its undeveloped 248,000oz Penny’s Find gold mine for $1.5m to Horizon Minerals (ASX:HRZ), which will shell out another $1m to fund early development.
The JV has now reported multiple significant drilling intercepts testing for the edges of this gold system, including 5m @ 5.27g/t gold from 180.3m and 3.7m @ 7.46g/t gold from 215.3m.
“The first round of high-grade drilling results demonstrating multiple areas of significant width are a testament to the calibre of the Penny’s Find gold deposit and we very much look forward to receiving results for the remaining 8 holes of this program, expected in the current June quarter,” Orminex director Dean Hely says.
RESOLUTE MINING (ASX:RSG) +12%
Another goldie which has struggled over the past year.
The share price of gold miner Resolute was spanked last month when Ghana decided to cancel its mining licence at the undeveloped Bibiani gold mine.
This happened just as Resolute was in the process of selling it to Chinese company Chifeng for ~$US105m.
That mining licence has now been restored “to maintain investor confidence globally and in particular maintain Ghana’s reputation as the preferred destination for mining investment in Africa”, the company says.
The share price is still down 46% over the past year, making Resolute the third worst performer in that period.
Related Topics

Related Stories


UNLOCK INSIGHTS
Discover the untold stories of emerging ASX stocks.
Daily news and expert analysis, it's free to subscribe.
By proceeding, you confirm you understand that we handle personal information in accordance with our Privacy Policy.


