Gold Digger: Geopolitical risk keeps gold in high demand

Gold to remain king with geopolitical turmoil from all directions. Pic: Getty Images.
- Alarm bells ring for investors, as Geopolitical Risk spikes intensify
- That’s bad for the world, but ironically good for gold investors
- World Gold Council says safe haven status makes gold a highly valuable investment in this day and age
We all know market uncertainties send investors into the ‘safety of gold’, yet the reasons behind those uncertainties are often a round robin of causes and human greed could be seen as the underlying theme behind all of it.
During times of war (when is there not a time of war, though?), nation states involved often seek to accumulate gold to finance their military efforts.
Flip that coin, and when conflict kicks off, it can lead to economic instability and a sizeable depreciation of currencies, prompting nations to hoard gold as a safe haven asset, even if they’re not directly involved.
Latest geopolitical ructions send gold rocketing
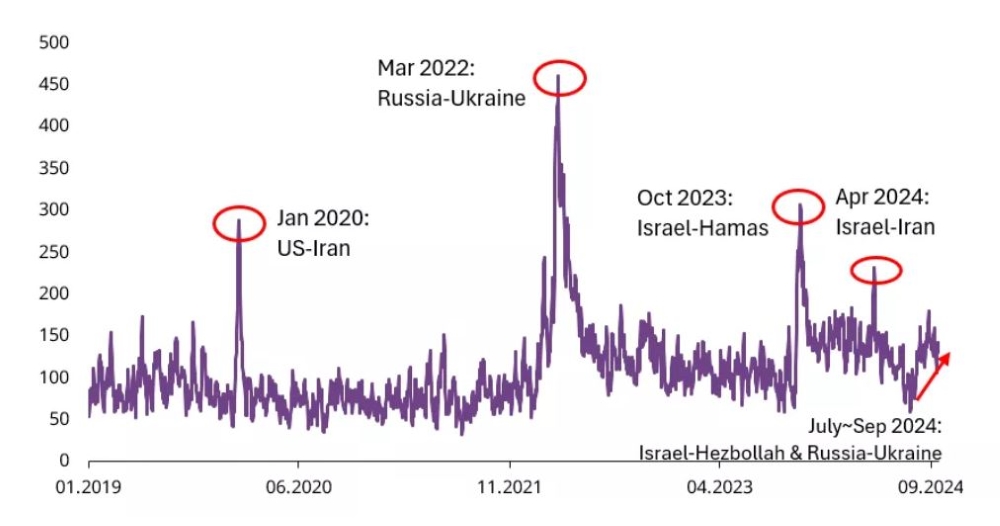
The Geopolitical Risk Index (GPR) indicates increasingly frequent periods when geopolitical risk is elevated – which have been particularly challenging for investors over the past three years.
So far in 2024, the GPR Index has recorded 15 spikes – days when the Index surged by more than 100% – on the back of tensions in the Russia-Ukraine war and developments in the Middle East. This follows 31 spikes in 2023, 20 spikes in 2022 and 41 spikes in 2021.
The latest over these past two months came with Ukraine’s cross-border attack on Russia and military action between Israel and Iran/Hezbollah after the assassination of Hamas leader Ismail Haniyeh.
World Gold Council APAC and China researchers Marissa Salim and Ray Jia say that the GPR spikes are leading to asset allocation into bullion as an effective hedge that’s consistently seeing the price punch through all-time highs.
“We believe one of the keys to building this resilience is to prepare for “unknown unknowns”,” Salim and Jia wrote.
“While scenarios such as global economic growth can be deduced from economic data clues, geopolitical risks tend to be sudden and unpredictable. And these geopolitical tensions often lead to financial market turmoil, damaging investor portfolios.
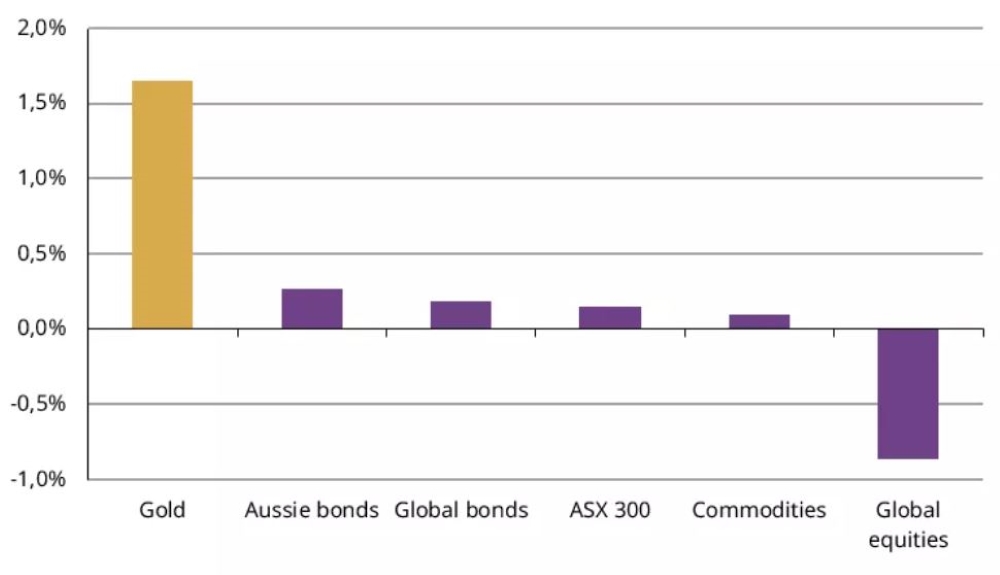
“We believe that gold’s key attributes – its safe-haven nature, its ability to generate long-term returns (especially now that a global easing cycle has begun), and its low correlation with risk assets – will continue to represent immense value to investors who seek to build a resilient portfolio in today’s world.”
Winners & Losers
Here’s how ASX-listed precious metals stocks are performing:
Scroll or swipe to reveal table. Click headings to sort. Best viewed on a laptop.
Stocks missing from this list? Email [email protected]
| CODE | COMPANY | PRICE | WEEK % | MONTH % | 6 MONTH % | YEAR % | YTD % | MARKET CAP |
|---|---|---|---|---|---|---|---|---|
| MHC | Manhattan Corp Ltd | 0.002 | 100% | 100% | -4% | -66% | 0% | $6,185,067 |
| LM8 | Lunnon Metals | 0.285 | 90% | 68% | 14% | -63% | -32% | $62,833,593 |
| MBK | Metal Bank Ltd | 0.025 | 79% | 47% | 25% | -34% | 0% | $9,761,482 |
| G88 | Golden Mile Res Ltd | 0.014 | 40% | 56% | 17% | -52% | -1% | $5,345,897 |
| RDS | Redstone Resources | 0.004 | 33% | 0% | 0% | -50% | 0% | $3,701,514 |
| ADN | Andromeda Metals Ltd | 0.009 | 29% | 0% | -55% | -55% | -2% | $27,148,834 |
| KNB | Koonenberry Gold | 0.014 | 27% | 40% | -18% | -54% | -2% | $4,029,025 |
| GUE | Global Uranium | 0.086 | 26% | 48% | -13% | -41% | -1% | $22,849,102 |
| SKY | SKY Metals Ltd | 0.05 | 25% | 61% | 61% | 16% | 1% | $29,535,158 |
| VKA | Viking Mines Ltd | 0.01 | 25% | 25% | 0% | 11% | 0% | $9,563,326 |
| A8G | Australasian Metals | 0.135 | 23% | 0% | 111% | -33% | -4% | $7,036,267 |
| AS1 | Asara Resources Ltd | 0.018 | 20% | 64% | 80% | -14% | 1% | $16,943,225 |
| G50 | G50Corp Ltd | 0.155 | 19% | 11% | 3% | 11% | 2% | $19,950,150 |
| HXG | Hexagon Energy | 0.025 | 19% | 0% | 4% | 178% | 1% | $12,822,898 |
| MM8 | Medallion Metals. | 0.063 | 19% | 21% | 2% | -7% | 0% | $22,260,195 |
| SMS | Starmineralslimited | 0.058 | 18% | 87% | 71% | 45% | 2% | $5,493,922 |
| BC8 | Black Cat Syndicate | 0.525 | 18% | 38% | 123% | 150% | 28% | $219,566,990 |
| MKR | Manuka Resources | 0.04 | 18% | 25% | -46% | -5% | -4% | $28,851,404 |
| SVY | Stavely Minerals Ltd | 0.034 | 17% | 31% | 13% | -52% | -1% | $16,372,374 |
| MOH | Moho Resources | 0.007 | 17% | 40% | 17% | -13% | 0% | $3,774,247 |
| SRN | Surefire Rescs NL | 0.007 | 17% | 17% | -22% | -50% | 0% | $13,904,155 |
| AL8 | Alderan Resource Ltd | 0.0035 | 17% | 17% | -21% | -72% | 0% | $5,499,371 |
| HAV | Havilah Resources | 0.21 | 17% | 17% | 24% | -16% | 2% | $65,509,437 |
| PGD | Peregrine Gold | 0.185 | 16% | 16% | -16% | -34% | -6% | $12,896,900 |
| REZ | Resourc & En Grp Ltd | 0.027 | 15% | 17% | 145% | 93% | 1% | $17,397,617 |
| NVA | Nova Minerals Ltd | 0.155 | 15% | 3% | -38% | -35% | -21% | $39,430,848 |
| WCN | White Cliff Min Ltd | 0.024 | 14% | 55% | 71% | 85% | 2% | $34,217,136 |
| SPQ | Superior Resources | 0.008 | 14% | -27% | -19% | -65% | 0% | $17,358,910 |
| NXM | Nexus Minerals Ltd | 0.049 | 14% | 20% | -13% | 4% | 0% | $25,288,908 |
| DRE | Dreadnought Resources Ltd | 0.017 | 13% | 6% | -6% | -65% | -1% | $63,792,500 |
| CY5 | Cygnus Metals Ltd | 0.085 | 13% | 21% | 73% | -53% | -5% | $32,281,716 |
| MLS | Metals Australia | 0.027 | 13% | 29% | 13% | -18% | -1% | $18,907,708 |
| AAJ | Aruma Resources Ltd | 0.018 | 13% | -5% | 0% | -50% | -1% | $3,552,931 |
| MXR | Maximus Resources | 0.045 | 13% | 50% | 44% | 59% | 1% | $19,684,674 |
| KRM | Kingsrose Mining Ltd | 0.039 | 11% | 11% | 11% | -17% | 0% | $26,373,428 |
| TAR | Taruga Minerals | 0.01 | 11% | 25% | 43% | -9% | 0% | $7,060,268 |
| MVL | Marvel Gold Limited | 0.011 | 10% | 38% | 10% | -8% | 0% | $9,501,698 |
| SNG | Siren Gold | 0.078 | 10% | 16% | 42% | 16% | 1% | $15,745,216 |
| VMC | Venus Metals Cor Ltd | 0.067 | 10% | -4% | -28% | -46% | -3% | $13,140,622 |
| AAM | Aumegametals | 0.048 | 9% | 4% | -8% | -4% | 0% | $27,360,827 |
| BGD | Bartongoldholdings | 0.255 | 9% | 9% | -2% | 28% | -1% | $56,851,320 |
| KCC | Kincora Copper | 0.0455 | 8% | -13% | 6% | 26% | 0% | $9,372,232 |
| GML | Gateway Mining | 0.026 | 8% | 18% | 13% | -10% | 0% | $9,886,486 |
| M24 | Mamba Exploration | 0.013 | 8% | -19% | -48% | -74% | -4% | $2,445,070 |
| BRX | Belararoxlimited | 0.26 | 8% | -10% | 2% | -57% | -5% | $26,673,479 |
| EM2 | Eagle Mountain | 0.05 | 8% | 4% | -11% | -39% | -2% | $20,036,621 |
| CHN | Chalice Mining Ltd | 1.55 | 7% | 48% | 43% | -32% | -15% | $620,497,727 |
| FML | Focus Minerals Ltd | 0.15 | 7% | 7% | -19% | -12% | -4% | $42,983,797 |
| SBR | Sabre Resources | 0.015 | 7% | 0% | -17% | -58% | -2% | $5,501,467 |
| ZNC | Zenith Minerals Ltd | 0.046 | 7% | 15% | -50% | -62% | -10% | $15,857,140 |
| ILT | Iltani Resources Lim | 0.245 | 7% | 23% | 63% | 36% | 9% | $10,562,521 |
| GWR | GWR Group Ltd | 0.083 | 6% | 11% | -17% | -1% | -1% | $27,945,849 |
| MRR | Minrex Resources Ltd | 0.0085 | 6% | -15% | -39% | -39% | -1% | $9,221,374 |
| MEG | Megado Minerals Ltd | 0.017 | 6% | 42% | 55% | -60% | -2% | $4,325,744 |
| AMI | Aurelia Metals Ltd | 0.18 | 6% | 13% | 13% | 100% | 7% | $321,397,271 |
| SFM | Santa Fe Minerals | 0.037 | 6% | -5% | -18% | -16% | -1% | $2,694,295 |
| MAT | Matsa Resources | 0.037 | 6% | 23% | 19% | 28% | 1% | $22,102,975 |
| GSN | Great Southern | 0.019 | 6% | 6% | -17% | -21% | 0% | $15,238,507 |
| SVL | Silver Mines Limited | 0.098 | 5% | -7% | -46% | -41% | -6% | $135,723,263 |
| CYL | Catalyst Metals | 2.91 | 5% | 29% | 296% | 355% | 211% | $659,285,028 |
| AVM | Advance Metals Ltd | 0.021 | 5% | -13% | -40% | -77% | -2% | $3,706,982 |
| FFM | Firefly Metals Ltd | 1.06 | 5% | 12% | 48% | 136% | 43% | $586,451,311 |
| KSN | Kingston Resources | 0.087 | 5% | 13% | 9% | 13% | 1% | $59,404,073 |
| SVG | Savannah Goldfields | 0.022 | 5% | 5% | -21% | -64% | -3% | $6,183,868 |
| POL | Polymetals Resources | 0.34 | 5% | 39% | 28% | 0% | 3% | $66,218,626 |
| CDR | Codrus Minerals Ltd | 0.023 | 5% | -12% | -44% | -62% | -3% | $3,473,138 |
| BM8 | Battery Age Minerals | 0.12 | 4% | 9% | 20% | -52% | -7% | $11,162,897 |
| KAL | Kalgoorliegoldmining | 0.025 | 4% | 4% | -4% | -14% | 0% | $6,487,402 |
| HRN | Horizon Gold Ltd | 0.38 | 4% | 19% | 46% | 16% | 8% | $53,590,772 |
| HRZ | Horizon | 0.051 | 4% | 19% | 42% | 38% | 1% | $53,690,837 |
| LEX | Lefroy Exploration | 0.077 | 4% | -7% | -23% | -53% | -10% | $15,635,762 |
| EMC | Everest Metals Corp | 0.13 | 4% | 24% | 57% | 18% | 5% | $24,216,804 |
| PTN | Patronus Resources | 0.053 | 4% | 2% | -24% | 39% | -1% | $86,782,084 |
| MI6 | Minerals260Limited | 0.135 | 4% | 4% | -16% | -71% | -19% | $31,590,000 |
| S2R | S2 Resources | 0.082 | 4% | -9% | -41% | -50% | -8% | $37,134,355 |
| WA8 | Warriedarresourltd | 0.057 | 4% | -14% | 33% | -15% | 0% | $45,032,655 |
| IGO | IGO Limited | 5.625 | 3% | 9% | -21% | -55% | -343% | $4,331,571,890 |
| CWX | Carawine Resources | 0.097 | 3% | -3% | -10% | -27% | -1% | $22,904,169 |
| SFR | Sandfire Resources | 10.7 | 3% | 25% | 21% | 75% | 336% | $4,917,541,759 |
| TAM | Tanami Gold NL | 0.033 | 3% | 10% | -13% | -11% | 0% | $38,778,203 |
| RND | Rand Mining Ltd | 1.8 | 3% | 13% | 29% | 38% | 43% | $102,092,350 |
| TG1 | Techgen Metals Ltd | 0.036 | 3% | 9% | 38% | 24% | -4% | $4,356,507 |
| DEG | De Grey Mining | 1.3775 | 3% | 14% | 10% | 31% | 14% | $3,259,590,207 |
| MEU | Marmota Limited | 0.037 | 3% | -5% | -14% | 9% | -1% | $39,116,821 |
| IVR | Investigator Res Ltd | 0.038 | 3% | 9% | -16% | 0% | 0% | $58,788,544 |
| KZR | Kalamazoo Resources | 0.081 | 3% | -16% | -16% | -19% | -4% | $14,400,028 |
| AAR | Astral Resources NL | 0.1125 | 2% | 13% | 81% | 34% | 4% | $132,968,769 |
| ERM | Emmerson Resources | 0.046 | 2% | -12% | -4% | -23% | -1% | $25,601,360 |
| MRZ | Mont Royal Resources | 0.053 | 2% | -12% | -13% | -69% | -10% | $4,506,579 |
| MEK | Meeka Metals Limited | 0.06 | 2% | 11% | 62% | 54% | 2% | $87,070,570 |
| ARN | Aldoro Resources | 0.076 | 1% | -14% | 6% | -15% | -5% | $11,173,771 |
| QML | Qmines Limited | 0.098 | 1% | 40% | 36% | -2% | 2% | $32,500,393 |
| ADT | Adriatic Metals | 3.49 | 1% | 21% | -14% | -3% | -52% | $976,938,142 |
| BGL | Bellevue Gold Ltd | 1.2925 | 0% | 10% | -32% | -3% | -38% | $1,651,198,693 |
| NPM | Newpeak Metals | 0.015 | 0% | 15% | 53% | -83% | 0% | $4,275,671 |
| ASO | Aston Minerals Ltd | 0.013 | 0% | 30% | -7% | -61% | -1% | $16,188,303 |
| LAT | Latitude 66 Limited | 0.12 | 0% | 4% | -40% | -52% | -8% | $17,827,009 |
| AQX | Alice Queen Ltd | 0.008 | 0% | -11% | 60% | -33% | 0% | $10,322,011 |
| SLZ | Sultan Resources Ltd | 0.006 | 0% | 0% | -45% | -68% | -2% | $1,185,519 |
| MKG | Mako Gold | 0.009 | 0% | 29% | -40% | -31% | 0% | $8,879,572 |
| TMX | Terrain Minerals | 0.004 | 0% | 14% | 0% | -20% | 0% | $7,200,115 |
| BNR | Bulletin Res Ltd | 0.047 | 0% | 2% | -33% | -41% | -9% | $13,799,826 |
| GTR | Gti Energy Ltd | 0.004 | 0% | 33% | -43% | -60% | 0% | $11,161,224 |
| BCM | Brazilian Critical | 0.012 | 0% | 0% | -48% | -56% | -1% | $9,968,873 |
| PUA | Peak Minerals Ltd | 0.002 | 0% | 0% | -20% | -40% | 0% | $4,994,221 |
| PRX | Prodigy Gold NL | 0.002 | 0% | 0% | -25% | -68% | 0% | $4,664,912 |
| CAZ | Cazaly Resources | 0.015 | 0% | 0% | -17% | -55% | -1% | $6,919,545 |
| HMX | Hammer Metals Ltd | 0.038 | 0% | -5% | -16% | -16% | -1% | $34,569,887 |
| ARI | Arika Resources | 0.029 | 0% | 45% | 45% | 16% | 0% | $14,458,951 |
| CTO | Citigold Corp Ltd | 0.004 | 0% | 0% | 0% | -11% | 0% | $15,000,000 |
| M2R | Miramar | 0.007 | 0% | -56% | -59% | -80% | -1% | $2,777,763 |
| GUL | Gullewa Limited | 0.065 | 0% | 0% | 18% | 18% | 1% | $13,310,252 |
| LCL | LCL Resources Ltd | 0.01 | 0% | 11% | -17% | -62% | -1% | $9,648,780 |
| NML | Navarre Minerals Ltd | 0.019 | 0% | 0% | 0% | 0% | 0% | $28,555,654 |
| BCN | Beacon Minerals | 0.022 | 0% | -4% | -19% | -4% | 0% | $84,527,284 |
| BYH | Bryah Resources Ltd | 0.004 | 0% | 0% | -60% | -69% | -1% | $2,013,147 |
| FG1 | Flynngold | 0.03 | 0% | 15% | -30% | -41% | -2% | $7,647,494 |
| WWI | West Wits Mining Ltd | 0.015 | 0% | 0% | -6% | 15% | 0% | $38,125,902 |
| RML | Resolution Minerals | 0.002 | 0% | -20% | -20% | -71% | 0% | $3,220,044 |
| GMN | Gold Mountain Ltd | 0.003 | 0% | -14% | -40% | -57% | 0% | $15,629,893 |
| VRC | Volt Resources Ltd | 0.0035 | 0% | -13% | -30% | -56% | 0% | $16,634,713 |
| CLA | Celsius Resource Ltd | 0.012 | 0% | -14% | -14% | 0% | 0% | $29,566,782 |
| RDN | Raiden Resources Ltd | 0.043 | 0% | 43% | 79% | 43% | 0% | $120,287,732 |
| EMU | EMU NL | 0.025 | 0% | 19% | -9% | -64% | 0% | $3,388,478 |
| PNR | Pantoro Limited | 0.115 | 0% | 0% | 53% | 219% | 6% | $742,213,509 |
| X64 | Ten Sixty Four Ltd | 0.57 | 0% | 0% | 0% | 0% | 0% | $129,844,903 |
| SI6 | SI6 Metals Limited | 0.001 | 0% | -33% | -71% | -86% | 0% | $2,368,859 |
| HAW | Hawthorn Resources | 0.058 | 0% | -6% | -17% | -36% | -4% | $19,430,906 |
| RGL | Riversgold | 0.005 | 0% | 11% | -29% | -62% | -1% | $7,964,776 |
| CBY | Canterbury Resources | 0.034 | 0% | 3% | -8% | 26% | 1% | $6,318,109 |
| LYN | Lycaonresources | 0.275 | 0% | 4% | 77% | 10% | 8% | $14,835,750 |
| TMZ | Thomson Res Ltd | 0.005 | 0% | 0% | 0% | 0% | 0% | $4,881,018 |
| NWM | Norwest Minerals | 0.022 | 0% | 0% | -27% | -27% | -1% | $10,187,510 |
| NAG | Nagambie Resources | 0.015 | 0% | -29% | 7% | -29% | -1% | $11,949,535 |
| KAI | Kairos Minerals Ltd | 0.013 | 0% | 30% | 0% | -35% | 0% | $32,886,402 |
| CAI | Calidus Resources | 0.115 | 0% | 0% | -4% | -21% | -10% | $93,678,206 |
| CDT | Castle Minerals | 0.003 | 0% | -25% | -50% | -70% | -1% | $4,118,442 |
| ALY | Alchemy Resource Ltd | 0.007 | 0% | 17% | -13% | -36% | 0% | $8,246,534 |
| AVW | Avira Resources Ltd | 0.001 | 0% | 0% | 0% | -50% | 0% | $2,938,790 |
| LCY | Legacy Iron Ore | 0.013 | 0% | 0% | -13% | -28% | 0% | $100,276,127 |
| ZAG | Zuleika Gold Ltd | 0.014 | 0% | -7% | -26% | 27% | 0% | $10,372,319 |
| LRL | Labyrinth Resources | 0.016 | 0% | 42% | 279% | 355% | 1% | $62,614,033 |
| XAM | Xanadu Mines Ltd | 0.066 | 0% | 16% | -10% | -7% | 1% | $104,676,367 |
| DTR | Dateline Resources | 0.005 | 0% | -17% | -62% | -62% | -1% | $12,473,399 |
| NES | Nelson Resources. | 0.003 | 0% | 0% | 0% | -40% | 0% | $1,915,783 |
| PKO | Peako Limited | 0.004 | 0% | 0% | 30% | -14% | 0% | $3,513,899 |
| ICG | Inca Minerals Ltd | 0.005 | 0% | 0% | -17% | -69% | -1% | $4,472,703 |
| BTR | Brightstar Resources | 0.018 | 0% | 6% | 0% | 80% | 0% | $128,389,051 |
| TRM | Truscott Mining Corp | 0.072 | 0% | 20% | 39% | 25% | 2% | $13,175,896 |
| PNM | Pacific Nickel Mines | 0.024 | 0% | 0% | -29% | -74% | -6% | $10,103,835 |
| AYM | Australia United Min | 0.002 | 0% | 0% | -50% | -33% | 0% | $3,685,155 |
| ANL | Amani Gold Ltd | 0.001 | 0% | 0% | 0% | 0% | 0% | $25,743,441 |
| PNT | Panthermetalsltd | 0.02 | 0% | -13% | -5% | -64% | -2% | $4,942,321 |
| FEG | Far East Gold | 0.17 | 0% | 10% | 6% | 10% | 5% | $45,620,022 |
| RXL | Rox Resources | 0.13 | 0% | -2% | -29% | -44% | -5% | $51,324,411 |
| CLZ | Classic Min Ltd | 0.001 | 0% | 0% | -92% | -98% | -5% | $1,544,026 |
| TGM | Theta Gold Mines Ltd | 0.175 | 0% | 25% | -3% | 40% | 6% | $136,618,541 |
| ORN | Orion Minerals Ltd | 0.017 | 0% | 6% | 21% | -11% | 0% | $116,221,164 |
| AUN | Aurumin | 0.046 | 0% | 15% | 18% | 84% | 2% | $21,875,676 |
| SXG | Southern Cross Gold | 3.11 | 0% | 11% | 69% | 282% | 185% | $635,029,133 |
| GOR | Gold Road Res Ltd | 1.6925 | -1% | 0% | 5% | 7% | -27% | $1,815,567,826 |
| EVN | Evolution Mining Ltd | 4.595 | -1% | 10% | 22% | 47% | 64% | $8,991,262,978 |
| CST | Castile Resources | 0.078 | -1% | -3% | 8% | 53% | 0% | $19,352,194 |
| SSR | SSR Mining Inc. | 8.4 | -2% | 10% | 17% | -58% | -742% | $34,433,786 |
| IDA | Indiana Resources | 0.095 | -2% | -1% | 24% | 59% | 2% | $61,534,014 |
| DLI | Delta Lithium | 0.235 | -2% | 15% | -16% | -66% | -24% | $167,650,678 |
| NST | Northern Star | 15.89 | -2% | 7% | 8% | 58% | 224% | $18,211,008,198 |
| RRL | Regis Resources | 2.025 | -2% | 15% | 5% | 39% | -16% | $1,510,955,468 |
| GED | Golden Deeps | 0.037 | -3% | -50% | -24% | -29% | -1% | $5,757,849 |
| HMG | Hamelingoldlimited | 0.065 | -3% | -18% | -13% | -23% | -1% | $10,867,500 |
| HCH | Hot Chili Ltd | 0.81 | -3% | 2% | -31% | -28% | -27% | $128,707,383 |
| MTC | Metalstech Ltd | 0.16 | -3% | -38% | -3% | -27% | -6% | $29,528,757 |
| ALK | Alkane Resources Ltd | 0.455 | -3% | 15% | -31% | -24% | -20% | $262,992,200 |
| WTM | Waratah Minerals Ltd | 0.295 | -3% | -29% | 231% | 883% | 18% | $61,550,270 |
| CMM | Capricorn Metals | 5.765 | -3% | 0% | 8% | 47% | 106% | $2,178,336,739 |
| CPM | Coopermetalslimited | 0.056 | -3% | -13% | -53% | -53% | -28% | $4,231,205 |
| GBR | Greatbould Resources | 0.056 | -3% | 14% | -5% | 8% | -1% | $34,127,051 |
| STN | Saturn Metals | 0.28 | -3% | 37% | 47% | 100% | 11% | $88,032,192 |
| ADV | Ardiden Ltd | 0.135 | -4% | 13% | -16% | -37% | -4% | $8,439,863 |
| IPT | Impact Minerals | 0.0125 | -4% | -7% | -17% | 0% | 0% | $39,772,638 |
| BMR | Ballymore Resources | 0.125 | -4% | 9% | 0% | 39% | 0% | $25,625,935 |
| AGC | AGC Ltd | 0.25 | -4% | -12% | 221% | 303% | 18% | $62,866,319 |
| AZY | Antipa Minerals Ltd | 0.025 | -4% | 92% | 127% | 108% | 1% | $109,680,087 |
| TLM | Talisman Mining | 0.23 | -4% | 2% | -13% | 77% | -1% | $43,313,680 |
| GPR | Geopacific Resources | 0.023 | -4% | -8% | 21% | 64% | 0% | $25,171,365 |
| PRU | Perseus Mining Ltd | 2.565 | -4% | 1% | 17% | 64% | 72% | $3,495,539,143 |
| BEZ | Besragoldinc | 0.089 | -4% | -4% | -11% | -39% | -6% | $39,471,450 |
| NMR | Native Mineral Res | 0.022 | -4% | -4% | -8% | -49% | 0% | $8,764,209 |
| MAU | Magnetic Resources | 1.305 | -4% | -10% | 40% | 56% | 29% | $323,427,825 |
| EMR | Emerald Res NL | 3.795 | -4% | -1% | 21% | 49% | 79% | $2,476,711,027 |
| TCG | Turaco Gold Limited | 0.32 | -4% | 23% | 83% | 527% | 19% | $240,224,845 |
| TM1 | Terra Metals Limited | 0.04 | -5% | 7% | -26% | -23% | -1% | $15,435,369 |
| TBR | Tribune Res Ltd | 4.51 | -5% | 20% | 12% | 48% | 156% | $243,451,877 |
| ICL | Iceni Gold | 0.038 | -5% | 6% | 73% | -49% | -1% | $10,910,442 |
| OZM | Ozaurum Resources | 0.038 | -5% | 9% | -16% | -62% | -11% | $6,032,500 |
| AUC | Ausgold Limited | 0.465 | -5% | 16% | 33% | 60% | 15% | $161,217,364 |
| GMD | Genesis Minerals | 2.04 | -5% | -7% | 7% | 53% | 25% | $2,279,472,248 |
| FAL | Falconmetalsltd | 0.175 | -5% | -46% | 30% | 21% | 3% | $30,975,000 |
| AM7 | Arcadia Minerals | 0.034 | -6% | 10% | -60% | -68% | -4% | $3,979,703 |
| PRS | Prospech Limited | 0.034 | -6% | 13% | -13% | 31% | 0% | $10,289,344 |
| MDI | Middle Island Res | 0.017 | -6% | 42% | 6% | -10% | 0% | $3,712,812 |
| SBM | St Barbara Limited | 0.335 | -6% | 34% | 81% | 86% | 13% | $270,052,685 |
| TTM | Titan Minerals | 0.4 | -6% | -8% | 43% | 16% | 12% | $74,798,278 |
| KAU | Kaiser Reef | 0.155 | -6% | 7% | 3% | -11% | -2% | $31,688,804 |
| GNM | Great Northern | 0.015 | -6% | 7% | 0% | -38% | -1% | $2,164,807 |
| USL | Unico Silver Limited | 0.225 | -6% | 25% | 55% | 168% | 10% | $75,488,741 |
| TMS | Tennant Minerals Ltd | 0.014 | -7% | -22% | -50% | -52% | -2% | $13,382,466 |
| KCN | Kingsgate Consolid. | 1.36 | -7% | 3% | 1% | 20% | -2% | $350,542,301 |
| RMS | Ramelius Resources | 2.135 | -7% | -2% | 12% | 52% | 45% | $2,411,068,670 |
| VAU | Vault Minerals Ltd | 0.32 | -7% | 5% | -18% | 21% | 1% | $2,142,779,115 |
| AME | Alto Metals Limited | 0.063 | -7% | -3% | 80% | 40% | 2% | $46,177,483 |
| CEL | Challenger Gold Ltd | 0.05 | -7% | -17% | -38% | -42% | -2% | $70,189,223 |
| STK | Strickland Metals | 0.087 | -7% | -7% | -21% | 24% | -1% | $194,252,497 |
| AQI | Alicanto Min Ltd | 0.024 | -8% | 71% | -3% | -45% | -1% | $18,703,574 |
| TMB | Tambourahmetals | 0.035 | -8% | -15% | -52% | -80% | -8% | $3,140,543 |
| ARD | Argent Minerals | 0.0175 | -8% | 17% | 17% | 75% | 1% | $24,546,736 |
| TSO | Tesoro Gold Ltd | 0.034 | -8% | 17% | 21% | 79% | 1% | $49,948,163 |
| RSG | Resolute Mining | 0.6975 | -8% | 6% | 57% | 111% | 25% | $1,511,625,509 |
| KTA | Krakatoa Resources | 0.011 | -8% | 0% | 38% | -52% | -3% | $5,665,287 |
| ARL | Ardea Resources Ltd | 0.375 | -9% | -14% | -44% | -36% | -10% | $79,873,166 |
| WAF | West African Res Ltd | 1.6625 | -9% | 20% | 24% | 131% | 72% | $1,889,342,232 |
| OBM | Ora Banda Mining Ltd | 0.6275 | -9% | 8% | 109% | 498% | 39% | $1,154,846,959 |
| MEI | Meteoric Resources | 0.1 | -9% | 5% | -55% | -53% | -16% | $241,049,677 |
| GSM | Golden State Mining | 0.01 | -9% | 0% | -17% | -73% | -1% | $2,793,706 |
| SPR | Spartan Resources | 1.285 | -9% | -6% | 94% | 215% | 77% | $1,429,857,244 |
| YRL | Yandal Resources | 0.084 | -10% | -33% | -10% | 75% | 0% | $22,495,840 |
| ASR | Asra Minerals Ltd | 0.0045 | -10% | -36% | -36% | -44% | 0% | $11,157,790 |
| GRL | Godolphin Resources | 0.0135 | -10% | -4% | -63% | -65% | -3% | $3,739,277 |
| RMXDD | Red Mount Min Ltd | 0.009 | -10% | -10% | -49% | -74% | -2% | $3,486,220 |
| ENR | Encounter Resources | 0.405 | -10% | -18% | 56% | 45% | 12% | $192,026,923 |
| SPD | Southernpalladium | 0.45 | -10% | 25% | 36% | 3% | 8% | $40,387,500 |
| PGO | Pacgold | 0.094 | -10% | 11% | -41% | -48% | -10% | $7,993,817 |
| AWJ | Auric Mining | 0.33 | -11% | 16% | 57% | 746% | 21% | $48,279,846 |
| TOR | Torque Met | 0.074 | -11% | -33% | -38% | -75% | -15% | $17,176,044 |
| WGX | Westgold Resources. | 2.505 | -11% | -15% | 6% | 59% | 33% | $2,348,343,128 |
| ADG | Adelong Gold Limited | 0.004 | -11% | -20% | 14% | -43% | 0% | $4,471,956 |
| GBZ | GBM Rsources Ltd | 0.008 | -11% | 14% | -27% | -47% | 0% | $9,253,511 |
| OAU | Ora Gold Limited | 0.008 | -11% | 60% | 33% | 14% | 0% | $50,049,206 |
| THR | Thor Energy PLC | 0.015 | -12% | 0% | -32% | -58% | -2% | $3,006,552 |
| DTM | Dart Mining NL | 0.014 | -13% | -24% | -61% | -23% | 0% | $5,573,320 |
| PDI | Predictive Disc Ltd | 0.2475 | -13% | 13% | 13% | 30% | 4% | $575,970,986 |
| ANX | Anax Metals Ltd | 0.019 | -14% | -10% | -30% | -41% | -1% | $13,197,454 |
| PXX | Polarx Limited | 0.0085 | -15% | -6% | -29% | -12% | 0% | $19,004,008 |
| TRE | Toubani Res Ltd | 0.25 | -15% | 28% | 79% | 160% | 11% | $54,923,839 |
| ARV | Artemis Resources | 0.011 | -15% | -15% | -35% | -58% | -1% | $23,002,589 |
| GIB | Gibb River Diamonds | 0.038 | -16% | 6% | 27% | 41% | 1% | $8,151,359 |
| BNZ | Benzmining | 0.15 | -17% | 15% | 15% | -59% | -10% | $16,026,889 |
| SMI | Santana Minerals Ltd | 2.01 | -17% | 18% | 55% | 265% | 100% | $410,944,294 |
| FXG | Felix Gold Limited | 0.099 | -18% | 22% | 130% | 43% | 5% | $30,564,991 |
| NSM | Northstaw | 0.014 | -18% | 43% | -62% | -46% | -3% | $2,250,861 |
| A1G | African Gold Ltd. | 0.037 | -18% | 9% | 24% | 6% | 1% | $12,922,543 |
| GAL | Galileo Mining Ltd | 0.135 | -18% | -23% | -51% | -67% | -15% | $27,667,490 |
| TNC | True North Copper | 0.031 | -18% | -11% | -68% | -80% | -7% | $27,140,196 |
| ION | Iondrive Limited | 0.012 | -20% | 0% | 33% | -8% | 0% | $9,210,598 |
| MOM | Moab Minerals Ltd | 0.004 | -20% | -20% | -33% | -50% | 0% | $3,235,257 |
| BMO | Bastion Minerals | 0.0055 | -21% | -8% | -31% | -75% | -1% | $3,086,205 |
| CXU | Cauldron Energy Ltd | 0.019 | -22% | 30% | -51% | 80% | 0% | $24,740,613 |
| AAU | Antilles Gold Ltd | 0.003 | -25% | -25% | -84% | -87% | -2% | $7,422,971 |
| MTH | Mithril Silver Gold | 0.48 | -28% | 317% | 140% | 220% | 28% | $49,476,587 |
| FAU | First Au Ltd | 0.001 | -33% | -50% | -50% | -67% | 0% | $1,811,993 |
| NAE | New Age Exploration | 0.004 | -33% | 14% | 0% | -33% | 0% | $7,175,596 |
| PUR | Pursuit Minerals | 0.002 | -33% | -33% | -60% | -80% | -1% | $7,270,800 |
| FXG | Felix Gold Limited | 0.089 | -1% | 141% | 218% | 13% | 82% | $ 22,486,713.48 |
| ILT | Iltani Resources Lim | 0.235 | 12% | 31% | 68% | 24% | 47% | $ 8,672,678.78 |
| BRX | Belararoxlimited | 0.24 | -4% | -13% | 12% | -62% | -23% | $ 26,150,470.00 |
| TM1 | Terra Metals Limited | 0.038 | 12% | -12% | -25% | -33% | -17% | $ 13,852,254.29 |
| TOR | Torque Met | 0.089 | -19% | -19% | -41% | -74% | -60% | $ 18,843,892.60 |
| ARD | Argent Minerals | 0.0175 | 3% | 25% | 94% | 46% | 94% | $ 25,268,699.16 |
Top ASX gold stories this week
Strickland Metals (ASX:STK) has moved drill rigs to the Gradina prospect at Rogozna for a 10,000m diamond drill program as it looks to emulate recent successes at Medenovac – both of which are outside the project’s now 5.4Moz gold equivalent resource.
A recently completed access track has now allowed the ability to drill-test shallower zones of gold and zinc mineralisation for the first time.
Gold has already been found at Gradina over ~1km of strike, at vertical depths of ~200-1000m below surface, with ~21,000m of previous drilling returning significant intercepts.
And Medenovac now has a mineralised strike-length of ~150m with the high-grade core extending 60m along strike to the south-east where an historical drill hole struck 97.7m at 5.1g/t AuEq within a broader zone of 352.1m at 2.1g/t AuEq from 240.2m.
A maiden mineral resource for the prospect is due out early next year, building on the 2.96Moz of gold, 214,000t of copper and 364,000t of zinc already contained within the project, mainly within the Shanac prospect.
Felix Gold (ASX:FXG) continues its winning streak as 1832 Asset Management has invested $2m to become a substantial holder in the explorer.
One of Stockhead’s biggest resources winners for the month of September, it’s currently exploring its historic Treasure Creek landholding in Alaska’s prolific Fairbanks gold district where it also holds a large historical antimony endowment at the Scrafford mine area.
Gold production in the region exceeds some 16Moz, with FXG’s leases sandwiched between Kinross’ 11.8Moz Fort Knox mine and Freegold Ventures’ 19.7Moz Golden Summit project (18km away).
Meanwhile Brightstar Resources’ (ASX:BTR) global resource base has jumped to 2Moz gold with the acquisition of Montague East.
This is partly due to the fact the MEGP already has a resource of 9.6Mt at 1.6g/t gold for 0.5Moz gold. It’s also just 70km from the Sandstone gold project, owned by Alto Metals (ASX:AME) – which is currently undertaking a merger with BTR.
The company is now planning a drilling program at the MEGP starting late October, targeting infill and extensional targets within and proximal to the resources at the advanced Whistler and Montague-Boulder deposits.
“We are working towards mobilising an RC drill rig to the Montague-Boulder and Whistler deposits in late October, which contain ~280koz gold of shallow, largely oxide material. It is our intent to move the Montague East Gold Project swiftly through resource drill-out and feasibility study workstreams to advance this asset towards development,” BTR MD Alex Rovira said.
At Stockhead, we tell it like it is. While Strickland Gold, Brightstar Resources and Felix Gold and are Stockhead advertisers at the time of writing, they did not sponsor this article.
Related Topics

Related Stories


UNLOCK INSIGHTS
Discover the untold stories of emerging ASX stocks.
Daily news and expert analysis, it's free to subscribe.
By proceeding, you confirm you understand that we handle personal information in accordance with our Privacy Policy.


