Gold Digger: Experts say ‘a gold bull market stands before us’ as Central Banks buy bullion at record rates
Pic: Peter Finch, Stone/ Via Getty Images
- Central banks are buying gold at record levels with holdings now at 50-year highs: Sprott
- Gold tends to hold its value in times of crisis
- Central Bank buying ‘extremely’ bullish: Goehring & Rozencwajg
- They say investors with no performance constraints “should maintain total precious metals exposure”
Our Gold Digger column wraps all the news driving ASX stocks with exposure to precious metals.
Why are Central Banks hoarding bullion at a record rate?
Central banks are buying gold at record levels with holdings now at 50 year highs, says Paul Wong, Market Strategist at Sprott.
Central banks hold a mix of assets as reserves to achieve specific policy objectives, like maintaining exchange rate stability, providing liquidity in times of crisis, earning income on reserves and managing risks.
They mostly comprise foreign currencies (63%), government bonds (23%),and gold bullion (7%)
Gold tends to hold its value in times of crisis, like right now.
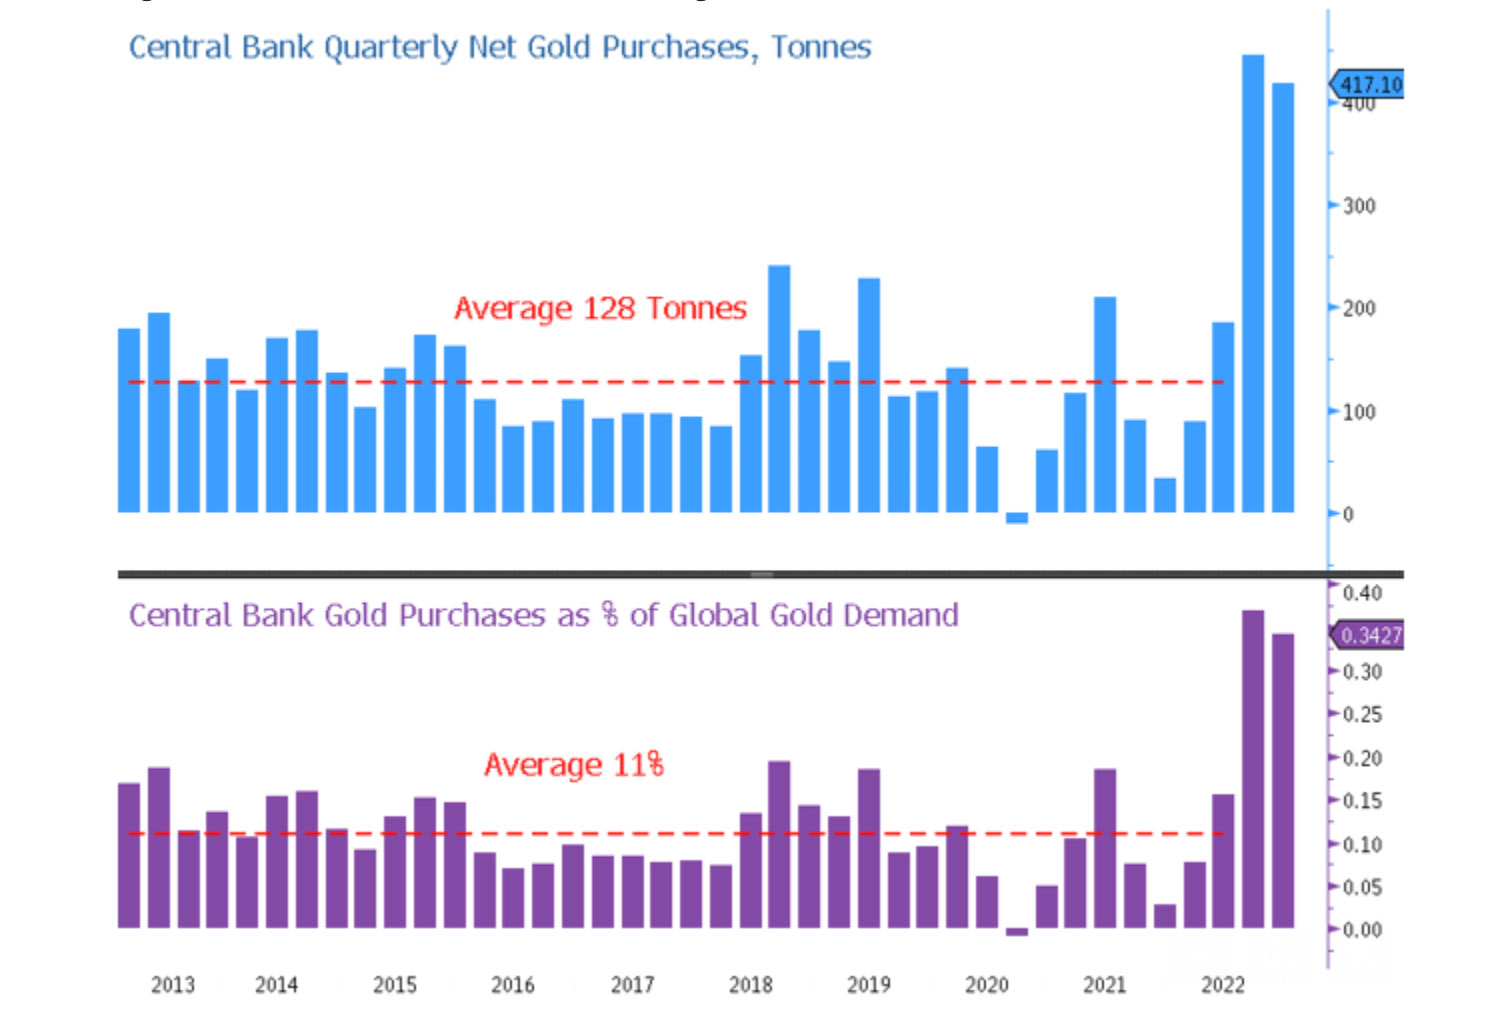
The latest gold purchasing data shows central banks bought 417 tonnes in Q4 2022, slightly down on Q3’s revised figure of 445 tonnes.
That’s huge. For context, the average quarterly purchase since 2013 was 128 tonnes.
Sprott have identified several reasons for central bank gold purchases over the past months, Wong says.
“These include the need to diversify reserves due to sanctions risk, the poor performance of sovereign bonds in the face of high inflation, a desire for outside money and the de-dollarization process,” he says.
“The current scale of central bank buying is massive — an annualized rate of 1,724 tonnes vs. an average of 512 tonnes over the past decade.
“Central bank gold purchases as a percentage of global gold demand have also tripled to 34% from their average of 11% over the past several years.”
In fact global central bank holdings are now at a 50 year high of ~37,000 tonnes, according to a December World Gold Council report.
“Given the seizure of Russia’s foreign exchange reserves, increasing U.S. dollar weaponization, growing deglobalization trends and the trend towards de-dollarization, we expect gold to increase as a percentage of foreign exchange reserves over the next few years,” Wong says.
“Rising geopolitical tensions would likely add fuel to this increase.”
Central Bank buying ‘extremely’ bullish: Goehring & Rozencwajg
Veteran natural resources investors Goehring & Rozencwajg “firmly believe” that the gold bull market has only started and that a substantial new bull market leg stands directly before us.
“The question remains timing,” they say.
“When should investors significantly increase their exposure to the precious metals complex? We’re watching these underlying data points.”
One of the big ones is Central Bank buying, which continues to set modern day records.
For all of 2022 central banks purchased 1136t of gold, the second-highest amount ever,” Goehring & Rozencwajg say.
“According to the World Gold Council (WGC), you must return to 1967 to find central bank purchases of that magnitude.
“According to the WGC, central banks purchased 417 tonnes in Q4 — almost surpassing the total amount of central bank purchases that occurred in all of 2021.”
A major buyer here has been China, which now has over 2000t of reserves, about 3.4% of the global total.
“Given China’s long-term desire to undermine the reserve currency status of the US dollar(look no further than China’s proposal to the Saudis that they tradeoil in renminbi ),— it will have to own a lot more gold to reinforce the long-term value, integrity, and ultimate convertibility of the renminbi on global currency exchanges,” Goehring & Rozencwajg say.
“Aggressive central bank buying, led by China, gives us further confidence that today’s corrective price pattern in the precious metals markets is nearing its end.”
When does the next leg of the gold market start?
Evidence strongly suggests that it is getting closer and closer, and investors with no performance constraints “should maintain total precious metals exposure”, Goehring & Rozencwajg say.
“Even for investors with performance constraints, we recommend they significantly raise their exposure.
“It has paid to have even minimal precious metals exposure over the last two and half years, especially relative to other natural resource sectors of the market.”
Winners & Losers
Here’s how ASX-listed precious metals stocks are performing:
Scroll or swipe to reveal table. Click headings to sort. Best viewed on a laptop.
Stocks missing from this list? Email [email protected]
| CODE | COMPANY | 1 WEEK RETURN % | 1 MONTH RETURN % | 6 MONTH RETURN % | 1 YEAR RETURN % | LAST SHARE PRICE | MARKET CAP |
|---|---|---|---|---|---|---|---|
| GWR | GWR Group Ltd | 29% | 36% | -9% | -52% | 0.08 | $20,236,649 |
| PUA | Peak Minerals Ltd | 25% | 0% | -44% | -62% | 0.005 | $5,206,883 |
| SRN | Surefire Rescs NL | 24% | 29% | 13% | 38% | 0.018 | $28,464,543 |
| BBX | BBX Minerals Ltd | 24% | -7% | 73% | 4% | 0.13 | $66,247,399 |
| CTO | Citigold Corp Ltd | 20% | 0% | -14% | -33% | 0.006 | $14,168,295 |
| XTC | Xantippe Res Ltd | 20% | 20% | -33% | -14% | 0.006 | $63,480,598 |
| MBK | Metal Bank Ltd | 20% | -27% | -40% | -60% | 0.024 | $5,806,196 |
| FAU | First Au Ltd | 17% | -22% | -50% | -65% | 0.0035 | $3,831,741 |
| YRL | Yandal Resources | 15% | -2% | -41% | -59% | 0.091 | $14,360,080 |
| OBM | Ora Banda Mining Ltd | 15% | 17% | 89% | 130% | 0.115 | $163,966,107 |
| ADT | Adriatic Metals | 15% | 11% | 76% | 72% | 3.76 | $846,061,955 |
| SXG | Southern Cross Gold | 13% | -17% | 59% | 0% | 0.605 | $57,488,618 |
| AAU | Antilles Gold Ltd | 11% | 5% | -20% | -45% | 0.04 | $19,492,425 |
| AVM | Advance Metals Ltd | 11% | -5% | -17% | -33% | 0.01 | $5,800,441 |
| GMN | Gold Mountain Ltd | 11% | -9% | -29% | -50% | 0.005 | $9,849,663 |
| FEG | Far East Gold | 10% | -19% | -41% | 0% | 0.32 | $43,215,427 |
| NWM | Norwest Minerals | 10% | -47% | -38% | -43% | 0.034 | $7,551,651 |
| G88 | Golden Mile Res Ltd | 9% | -16% | -45% | -70% | 0.018 | $3,682,616 |
| PRX | Prodigy Gold NL | 9% | 9% | 20% | -50% | 0.012 | $20,100,652 |
| ASR | Asra Minerals Ltd | 9% | -14% | -52% | -54% | 0.012 | $17,605,424 |
| VRC | Volt Resources Ltd | 9% | -8% | -54% | -14% | 0.012 | $47,273,087 |
| AWJ | Auric Mining | 9% | -23% | -39% | -42% | 0.049 | $6,412,120 |
| POL | Polymetals Resources | 9% | -3% | 3% | 54% | 0.185 | $8,358,798 |
| KRM | Kingsrose Mining Ltd | 8% | 1% | 26% | -9% | 0.068 | $51,171,803 |
| MI6 | Minerals260Limited | 8% | 10% | 5% | -34% | 0.345 | $75,900,000 |
| REZ | Resourc & En Grp Ltd | 8% | 0% | -36% | -67% | 0.014 | $6,997,281 |
| ICL | Iceni Gold | 8% | 0% | 5% | -20% | 0.1 | $12,819,643 |
| GML | Gateway Mining | 7% | -21% | -49% | -60% | 0.046 | $12,251,343 |
| GSM | Golden State Mining | 7% | -9% | -23% | -49% | 0.04 | $4,680,568 |
| LCY | Legacy Iron Ore | 6% | 6% | -15% | -15% | 0.017 | $115,322,872 |
| GBZ | GBM Rsources Ltd | 6% | -20% | -34% | -72% | 0.035 | $19,696,795 |
| GSN | Great Southern | 5% | -16% | -38% | -62% | 0.021 | $13,933,647 |
| EMC | Everest Metals Corp | 5% | -6% | -15% | -39% | 0.085 | $9,046,814 |
| ASO | Aston Minerals Ltd | 5% | 24% | 18% | -35% | 0.11 | $128,056,057 |
| BYH | Bryah Resources Ltd | 5% | -8% | -19% | -53% | 0.022 | $6,187,576 |
| BGD | Bartongoldholdings | 4% | 4% | 50% | -11% | 0.24 | $20,698,153 |
| PGO | Pacgold | 4% | 3% | -36% | -55% | 0.37 | $21,160,299 |
| AUC | Ausgold Limited | 4% | -6% | 11% | 2% | 0.05 | $101,473,727 |
| ERM | Emmerson Resources | 4% | -1% | -16% | -37% | 0.076 | $41,397,944 |
| RDT | Red Dirt Metals Ltd | 4% | -12% | -42% | -18% | 0.395 | $177,962,996 |
| GUL | Gullewa Limited | 4% | 10% | -7% | -20% | 0.057 | $11,159,067 |
| BCN | Beacon Minerals | 4% | -3% | 21% | -24% | 0.029 | $108,946,277 |
| MRR | Minrex Resources Ltd | 3% | -11% | -44% | -47% | 0.031 | $32,546,025 |
| TCG | Turaco Gold Limited | 3% | 20% | 27% | -38% | 0.065 | $27,373,867 |
| GBR | Greatbould Resources | 3% | 9% | 0% | -33% | 0.1 | $42,665,531 |
| MXR | Maximus Resources | 3% | -13% | -31% | -49% | 0.035 | $11,166,952 |
| MAU | Magnetic Resources | 3% | -9% | -28% | -51% | 0.72 | $167,544,038 |
| DTM | Dart Mining NL | 2% | -7% | -57% | -47% | 0.043 | $6,536,064 |
| A1G | African Gold Ltd. | 2% | 0% | 29% | -44% | 0.087 | $14,730,075 |
| ZNC | Zenith Minerals Ltd | 2% | 0% | -29% | -34% | 0.225 | $79,133,860 |
| AM7 | Arcadia Minerals | 2% | 2% | -15% | -2% | 0.235 | $10,974,005 |
| IDA | Indiana Resources | 2% | -4% | -13% | -9% | 0.053 | $26,563,855 |
| RED | Red 5 Limited | 2% | -30% | -46% | -65% | 0.1325 | $433,584,795 |
| RSG | Resolute Mining | 2% | 6% | 23% | -7% | 0.275 | $585,476,806 |
| WRM | White Rock Min Ltd | 2% | 2% | -32% | -67% | 0.066 | $17,870,412 |
| PDI | Predictive Disc Ltd | 1% | 1% | -18% | -25% | 0.1725 | $294,612,786 |
| AAR | Astral Resources NL | 1% | -4% | -15% | -38% | 0.07 | $46,578,699 |
| BGL | Bellevue Gold Ltd | 1% | -2% | 44% | 13% | 1.1375 | $1,281,556,616 |
| NPM | Newpeak Metals | 0% | 0% | 0% | 0% | 0.001 | $9,145,132 |
| FFX | Firefinch Ltd | 0% | 0% | 0% | -22% | 0.2 | $236,569,315 |
| DCX | Discovex Res Ltd | 0% | 0% | -40% | -65% | 0.003 | $9,907,704 |
| NMR | Native Mineral Res | 0% | -16% | -44% | -71% | 0.067 | $8,049,295 |
| AQX | Alice Queen Ltd | 0% | -50% | -67% | -86% | 0.001 | $2,530,288 |
| SLZ | Sultan Resources Ltd | 0% | -6% | -42% | -64% | 0.058 | $4,830,495 |
| MKG | Mako Gold | 0% | -5% | -38% | -57% | 0.04 | $18,866,054 |
| PNX | PNX Metals Limited | 0% | 0% | -29% | -36% | 0.003 | $16,141,874 |
| TMX | Terrain Minerals | 0% | -8% | -25% | -14% | 0.006 | $6,499,196 |
| BNR | Bulletin Res Ltd | 0% | -23% | -33% | -29% | 0.1 | $29,359,110 |
| AGG | AngloGold Ashanti | 0% | -11% | 22% | -27% | 5.01 | $446,930,903 |
| GTR | Gti Energy Ltd | 0% | -9% | -55% | -50% | 0.01 | $15,054,836 |
| SMS | Starmineralslimited | 0% | -4% | -25% | -67% | 0.07 | $2,109,926 |
| LEX | Lefroy Exploration | 0% | -10% | -21% | -30% | 0.225 | $36,103,050 |
| GMR | Golden Rim Resources | 0% | -6% | -33% | -68% | 0.03 | $17,747,651 |
| SIH | Sihayo Gold Limited | 0% | 0% | -20% | -67% | 0.002 | $12,204,256 |
| WCN | White Cliff Min Ltd | 0% | -8% | -59% | -58% | 0.011 | $8,232,571 |
| MHC | Manhattan Corp Ltd | 0% | -14% | -33% | -57% | 0.006 | $10,527,969 |
| TRY | Troy Resources Ltd | 0% | 0% | 0% | 0% | 0.0295 | $62,920,961 |
| CGN | Crater Gold Min Ltd | 0% | 0% | 0% | 0% | 0.017 | $21,063,474 |
| SVG | Savannah Goldfields | 0% | -6% | -31% | -28% | 0.165 | $31,159,992 |
| G50 | Gold50Limited | 0% | 24% | 68% | -8% | 0.235 | $13,381,605 |
| ADV | Ardiden Ltd | 0% | 0% | -13% | -46% | 0.007 | $18,818,347 |
| NAE | New Age Exploration | 0% | -25% | 0% | -54% | 0.006 | $8,615,393 |
| LCL | Los Cerros Limited | 0% | -23% | -5% | -70% | 0.031 | $23,057,906 |
| ADG | Adelong Gold Limited | 0% | -11% | -60% | -73% | 0.008 | $4,270,578 |
| RMX | Red Mount Min Ltd | 0% | -17% | -29% | -41% | 0.005 | $9,087,404 |
| MZZ | Matador Mining Ltd | 0% | -20% | -30% | -73% | 0.08 | $25,217,507 |
| BC8 | Black Cat Syndicate | 0% | 0% | 7% | -33% | 0.38 | $102,468,502 |
| AL8 | Alderan Resource Ltd | 0% | -13% | -36% | -63% | 0.007 | $4,047,863 |
| TBA | Tombola Gold Ltd | 0% | 0% | -30% | -26% | 0.026 | $33,129,243 |
| FML | Focus Minerals Ltd | 0% | -5% | 20% | -28% | 0.18 | $51,580,556 |
| ARV | Artemis Resources | 0% | -38% | -53% | -79% | 0.015 | $23,421,276 |
| HRN | Horizon Gold Ltd | 0% | -12% | -12% | -29% | 0.3 | $37,554,492 |
| QML | Qmines Limited | 0% | -17% | 7% | -40% | 0.15 | $13,531,355 |
| RDN | Raiden Resources Ltd | 0% | 0% | -44% | -74% | 0.005 | $8,272,912 |
| X64 | Ten Sixty Four Ltd | 0% | -3% | -11% | -32% | 0.57 | $130,184,182 |
| AGC | AGC Ltd | 0% | -12% | -25% | -42% | 0.052 | $5,200,000 |
| RVR | Red River Resources | 0% | 0% | -26% | -72% | 0.073 | $37,847,908 |
| TSO | Tesoro Gold Ltd | 0% | 3% | -5% | -62% | 0.032 | $33,712,402 |
| OKR | Okapi Resources | 0% | -6% | -46% | -40% | 0.165 | $26,837,278 |
| CBY | Canterbury Resources | 0% | 0% | 8% | -38% | 0.04 | $6,048,988 |
| TMZ | Thomson Res Ltd | 0% | -71% | -77% | -92% | 0.005 | $4,349,755 |
| WMC | Wiluna Mining Corp | 0% | 0% | 0% | -75% | 0.205 | $74,238,031 |
| THR | Thor Energy PLC | 0% | 0% | -58% | -62% | 0.005 | $8,129,621 |
| RDS | Redstone Resources | 0% | 0% | 25% | 11% | 0.01 | $7,368,324 |
| KAU | Kaiser Reef | 0% | 3% | 3% | -10% | 0.175 | $24,088,606 |
| CDT | Castle Minerals | 0% | -4% | -21% | -58% | 0.022 | $21,988,846 |
| CXU | Cauldron Energy Ltd | 0% | 17% | -40% | -62% | 0.007 | $6,520,976 |
| ALY | Alchemy Resource Ltd | 0% | -6% | -25% | 25% | 0.015 | $17,671,144 |
| AVW | Avira Resources Ltd | 0% | 20% | -33% | -40% | 0.003 | $6,401,370 |
| SAU | Southern Gold | 0% | -8% | -35% | -61% | 0.022 | $6,606,276 |
| XAM | Xanadu Mines Ltd | 0% | 7% | 0% | 19% | 0.032 | $46,678,658 |
| ARN | Aldoro Resources | 0% | -4% | -14% | -36% | 0.22 | $24,840,710 |
| S2R | S2 Resources | 0% | -13% | -13% | -26% | 0.13 | $55,362,355 |
| NES | Nelson Resources. | 0% | -25% | -36% | -66% | 0.006 | $2,942,972 |
| PKO | Peako Limited | 0% | -14% | -37% | -29% | 0.012 | $4,550,583 |
| GNM | Great Northern | 0% | 0% | 0% | -33% | 0.004 | $6,836,204 |
| DEX | Duke Exploration | 0% | 0% | -15% | -75% | 0.053 | $5,587,240 |
| MOM | Moab Minerals Ltd | 0% | -20% | -71% | -71% | 0.008 | $5,455,708 |
| AYM | Australia United Min | 0% | -25% | -40% | -50% | 0.003 | $5,527,732 |
| BRB | Breaker Res NL | 0% | -2% | 22% | 19% | 0.28 | $89,881,227 |
| ANL | Amani Gold Ltd | 0% | 0% | -33% | 0% | 0.001 | $24,693,441 |
| FAL | Falconmetalsltd | 0% | 51% | 74% | -16% | 0.34 | $62,835,000 |
| CWX | Carawine Resources | -1% | -18% | -10% | -59% | 0.09 | $17,713,572 |
| CHZ | Chesser Resources | -1% | -1% | 11% | -15% | 0.089 | $52,974,121 |
| BNZ | Benzmining | -1% | -22% | -26% | -31% | 0.4 | $28,649,641 |
| SMI | Santana Minerals Ltd | -1% | -3% | -2% | 44% | 0.8 | $118,278,190 |
| TBR | Tribune Res Ltd | -1% | -11% | -12% | -34% | 3.3 | $169,996,569 |
| HAV | Havilah Resources | -1% | -6% | -4% | 83% | 0.33 | $107,657,331 |
| HMX | Hammer Metals Ltd | -2% | -21% | 24% | -37% | 0.063 | $51,748,663 |
| TTM | Titan Minerals | -2% | -9% | 5% | -40% | 0.063 | $88,910,211 |
| NAG | Nagambie Resources | -2% | 2% | -29% | 10% | 0.057 | $29,463,159 |
| SKY | SKY Metals Ltd | -2% | -2% | -28% | -40% | 0.049 | $18,462,390 |
| OZM | Ozaurum Resources | -2% | -40% | -53% | -58% | 0.049 | $6,223,000 |
| WAF | West African Res Ltd | -2% | -6% | -24% | -27% | 0.94 | $962,105,388 |
| ADN | Andromeda Metals Ltd | -2% | 0% | -19% | -78% | 0.046 | $143,060,388 |
| CAI | Calidus Resources | -2% | -12% | -64% | -74% | 0.22 | $96,701,185 |
| NCM | Newcrest Mining | -2% | -7% | 32% | -17% | 23.365 | $20,796,604,288 |
| EMR | Emerald Res NL | -2% | -8% | 16% | 27% | 1.41 | $878,825,455 |
| MAT | Matsa Resources | -2% | 11% | -5% | -38% | 0.04 | $16,480,185 |
| FG1 | Flynngold | -3% | -20% | -14% | -49% | 0.078 | $8,435,630 |
| STK | Strickland Metals | -3% | 6% | -22% | -37% | 0.038 | $59,087,293 |
| LM8 | Lunnonmetalslimited | -3% | -5% | 0% | -3% | 0.935 | $102,734,179 |
| KCC | Kincora Copper | -3% | -5% | 29% | -47% | 0.072 | $8,586,739 |
| NXM | Nexus Minerals Ltd | -3% | -15% | -19% | -55% | 0.17 | $55,327,063 |
| CY5 | Cygnus Metals Ltd | -3% | -29% | 17% | 100% | 0.34 | $62,517,232 |
| ANX | Anax Metals Ltd | -3% | 0% | 2% | -26% | 0.066 | $27,429,453 |
| ORN | Orion Minerals Ltd | -3% | 3% | -13% | -34% | 0.0165 | $78,463,269 |
| SPD | Southernpalladium | -3% | -32% | -56% | 0% | 0.49 | $21,108,380 |
| HCH | Hot Chili Ltd | -3% | 0% | -16% | -34% | 0.91 | $111,084,042 |
| NST | Northern Star | -3% | -14% | 37% | -3% | 10.605 | $11,924,934,420 |
| BMR | Ballymore Resources | -3% | -12% | -26% | -15% | 0.145 | $13,966,031 |
| CAZ | Cazaly Resources | -3% | -15% | -32% | -32% | 0.028 | $10,411,010 |
| STN | Saturn Metals | -3% | -19% | -49% | -63% | 0.14 | $21,216,793 |
| RMS | Ramelius Resources | -4% | 1% | 29% | -42% | 0.95 | $838,318,724 |
| RND | Rand Mining Ltd | -4% | -7% | -13% | -17% | 1.3 | $79,057,586 |
| CPM | Coopermetalslimited | -4% | -10% | -42% | -41% | 0.26 | $10,684,700 |
| KIN | KIN Min NL | -4% | -6% | -32% | -47% | 0.05 | $58,907,527 |
| CHN | Chalice Mining Ltd | -4% | -4% | 54% | -21% | 6.26 | $2,439,377,817 |
| MDI | Middle Island Res | -4% | -13% | -27% | -60% | 0.048 | $5,876,075 |
| M24 | Mamba Exploration | -4% | -40% | 4% | -20% | 0.12 | $7,318,001 |
| SBM | St Barbara Limited | -4% | -20% | -44% | -67% | 0.5325 | $436,849,780 |
| RXL | Rox Resources | -4% | 27% | -11% | -43% | 0.235 | $51,601,480 |
| RXL | Rox Resources | -4% | 27% | -11% | -43% | 0.235 | $51,601,480 |
| WWI | West Wits Mining Ltd | -4% | -28% | -36% | -73% | 0.0115 | $23,673,986 |
| KAL | Kalgoorliegoldmining | -4% | -4% | -50% | -57% | 0.067 | $4,878,380 |
| TGM | Theta Gold Mines Ltd | -4% | -4% | 8% | -57% | 0.065 | $43,330,635 |
| VKA | Viking Mines Ltd | -5% | -13% | 31% | -5% | 0.0105 | $10,765,214 |
| CYL | Catalyst Metals | -5% | -15% | -14% | -39% | 1.145 | $192,331,813 |
| IGO | IGO Limited | -5% | -9% | -7% | 2% | 13.275 | $10,457,868,498 |
| AAJ | Aruma Resources Ltd | -5% | -19% | -10% | -29% | 0.06 | $9,417,690 |
| RGL | Riversgold | -5% | -20% | -44% | -15% | 0.02 | $17,963,887 |
| BEZ | Besragoldinc | -5% | -13% | 1% | -46% | 0.04 | $14,154,476 |
| GIB | Gibb River Diamonds | -5% | -12% | -3% | -5% | 0.058 | $12,267,548 |
| CST | Castile Resources | -5% | -5% | -27% | -46% | 0.095 | $22,980,731 |
| EM2 | Eagle Mountain | -5% | -17% | -25% | -67% | 0.19 | $59,468,538 |
| AZS | Azure Minerals | -5% | -10% | 33% | -32% | 0.28 | $92,010,688 |
| CMM | Capricorn Metals | -5% | -11% | 9% | -1% | 3.82 | $1,409,093,156 |
| KSN | Kingston Resources | -5% | -6% | 1% | -50% | 0.09 | $35,330,561 |
| MVL | Marvel Gold Limited | -5% | -18% | -40% | -63% | 0.018 | $12,691,699 |
| KAI | Kairos Minerals Ltd | -5% | -22% | -40% | -25% | 0.018 | $35,353,683 |
| TAM | Tanami Gold NL | -5% | -15% | -17% | -42% | 0.035 | $41,128,397 |
| SSR | SSR Mining Inc. | -5% | -14% | -5% | -31% | 19.64 | $367,167,475 |
| IPT | Impact Minerals | -6% | -15% | 21% | -45% | 0.0085 | $21,091,650 |
| MGV | Musgrave Minerals | -6% | -13% | -29% | -48% | 0.17 | $100,505,351 |
| KCN | Kingsgate Consolid. | -6% | -5% | -15% | -9% | 1.46 | $331,980,680 |
| KCN | Kingsgate Consolid. | -6% | -5% | -15% | -9% | 1.46 | $331,980,680 |
| BMO | Bastion Minerals | -6% | -29% | -65% | -82% | 0.032 | $4,814,809 |
| GAL | Galileo Mining Ltd | -6% | -16% | -34% | 225% | 0.715 | $142,289,947 |
| EVN | Evolution Mining Ltd | -6% | -14% | 21% | -39% | 2.765 | $5,027,944,714 |
| VAN | Vango Mining Ltd | -6% | -2% | 24% | 21% | 0.047 | $59,217,069 |
| WA8 | Warriedar Resources | -6% | -30% | 19% | -14% | 0.155 | $66,814,116 |
| A8G | Australasian Metals | -6% | -18% | -45% | -68% | 0.155 | $6,381,427 |
| PRU | Perseus Mining Ltd | -6% | -1% | 31% | 5% | 2.01 | $2,775,950,119 |
| WGX | Westgold Resources. | -6% | -17% | 3% | -63% | 0.91 | $430,996,684 |
| MOH | Moho Resources | -6% | -29% | -50% | -67% | 0.015 | $3,530,257 |
| M2R | Miramar | -6% | -27% | -52% | -67% | 0.058 | $4,099,541 |
| DEG | De Grey Mining | -7% | -4% | 29% | -1% | 1.3975 | $2,201,245,350 |
| MEG | Megado Minerals Ltd | -7% | -2% | -58% | -48% | 0.042 | $6,008,333 |
| CLA | Celsius Resource Ltd | -7% | -13% | 4% | -26% | 0.014 | $27,858,061 |
| SPQ | Superior Resources | -7% | -14% | -2% | 31% | 0.055 | $93,567,123 |
| ENR | Encounter Resources | -7% | -18% | -7% | -7% | 0.135 | $47,995,980 |
| DCN | Dacian Gold Ltd | -7% | -11% | -1% | -66% | 0.093 | $113,162,487 |
| PGD | Peregrine Gold | -7% | -12% | -44% | -13% | 0.43 | $16,672,772 |
| PNR | Pantoro Limited | -7% | -41% | -73% | -85% | 0.052 | $106,373,470 |
| USL | Unico Silver Limited | -7% | -7% | -19% | -37% | 0.13 | $32,416,432 |
| MM8 | Medallion Metals. | -7% | -14% | -32% | -54% | 0.125 | $17,494,382 |
| AME | Alto Metals Limited | -7% | -14% | -19% | -33% | 0.062 | $37,994,560 |
| PRS | Prospech Limited | -8% | -11% | -20% | -52% | 0.024 | $2,119,166 |
| IVR | Investigator Res Ltd | -8% | -15% | -27% | -56% | 0.035 | $50,300,728 |
| MRZ | Mont Royal Resources | -8% | -29% | -35% | -45% | 0.175 | $11,984,467 |
| MEI | Meteoric Resources | -8% | -12% | 945% | 785% | 0.115 | $175,656,697 |
| SVL | Silver Mines Limited | -8% | -27% | -25% | -47% | 0.1425 | $203,582,848 |
| SI6 | SI6 Metals Limited | -8% | 10% | -31% | -39% | 0.0055 | $8,972,368 |
| SNG | Siren Gold | -8% | -29% | -49% | -57% | 0.11 | $14,768,469 |
| SFR | Sandfire Resources | -9% | -13% | 34% | 0% | 5.56 | $2,613,421,828 |
| KWR | Kingwest Resources | -9% | -22% | -50% | -81% | 0.032 | $9,015,258 |
| MEK | Meeka Metals Limited | -9% | -23% | -39% | -18% | 0.041 | $42,704,357 |
| GOR | Gold Road Res Ltd | -9% | -10% | 3% | -22% | 1.4075 | $1,503,648,829 |
| KZR | Kalamazoo Resources | -9% | -27% | -36% | -48% | 0.15 | $25,469,294 |
| SBR | Sabre Resources | -9% | -27% | -57% | -40% | 0.03 | $8,161,613 |
| RRL | Regis Resources | -9% | -19% | 0% | -25% | 1.6525 | $1,253,343,036 |
| HRZ | Horizon | -9% | -21% | -35% | -57% | 0.049 | $31,765,157 |
| AUT | Auteco Minerals | -9% | -13% | -13% | -49% | 0.039 | $89,030,616 |
| SFM | Santa Fe Minerals | -9% | -3% | -20% | -66% | 0.068 | $4,951,678 |
| PNM | Pacific Nickel Mines | -10% | -14% | -29% | -46% | 0.065 | $26,324,294 |
| GED | Golden Deeps | -10% | -10% | -40% | -10% | 0.009 | $11,552,267 |
| HAW | Hawthorn Resources | -10% | -6% | -8% | 6% | 0.09 | $30,151,405 |
| TLM | Talisman Mining | -10% | -18% | -16% | -18% | 0.135 | $25,344,832 |
| TUL | Tulla Resources | -10% | -38% | -59% | -66% | 0.215 | $44,698,175 |
| PNT | Panthermetalsltd | -11% | -34% | -31% | -47% | 0.125 | $3,997,500 |
| SLR | Silver Lake Resource | -11% | -18% | -26% | -54% | 0.955 | $897,203,281 |
| ALK | Alkane Resources Ltd | -11% | -6% | -19% | -43% | 0.65 | $389,215,185 |
| TAR | Taruga Minerals | -11% | -6% | -50% | -52% | 0.016 | $11,296,429 |
| BTR | Brightstar Resources | -11% | -16% | 0% | -43% | 0.016 | $13,266,061 |
| TIE | Tietto Minerals | -11% | -20% | 12% | -3% | 0.58 | $630,765,944 |
| PUR | Pursuit Minerals | -12% | 5% | 44% | 15% | 0.023 | $26,119,519 |
| VMC | Venus Metals Cor Ltd | -12% | 11% | -12% | -19% | 0.15 | $26,711,802 |
| MEU | Marmota Limited | -12% | -18% | -29% | -16% | 0.037 | $39,175,621 |
| GMD | Genesis Minerals | -12% | -19% | -13% | -38% | 1 | $421,333,645 |
| AMI | Aurelia Metals Ltd | -13% | -19% | -53% | -77% | 0.105 | $129,930,908 |
| GSR | Greenstone Resources | -13% | -22% | -69% | -42% | 0.021 | $25,361,258 |
| LYN | Lycaonresources | -13% | -25% | -30% | -40% | 0.21 | $6,912,938 |
| HXG | Hexagon Energy | -13% | -22% | -13% | -75% | 0.014 | $6,667,907 |
| MTC | Metalstech Ltd | -13% | -18% | 37% | 105% | 0.41 | $72,653,882 |
| MLS | Metals Australia | -13% | -25% | -21% | -43% | 0.041 | $24,888,484 |
| AQI | Alicanto Min Ltd | -13% | 0% | -8% | -56% | 0.046 | $20,525,826 |
| ZAG | Zuleika Gold Ltd | -13% | -32% | -35% | -61% | 0.013 | $6,799,658 |
| CDR | Codrus Minerals Ltd | -14% | -18% | 36% | -10% | 0.099 | $4,002,570 |
| GRL | Godolphin Resources | -14% | -31% | -32% | -57% | 0.06 | $7,338,906 |
| NVA | Nova Minerals Ltd | -14% | -28% | -49% | -17% | 0.45 | $100,172,644 |
| RML | Resolution Minerals | -14% | -20% | -33% | -65% | 0.006 | $6,478,477 |
| HMG | Hamelingoldlimited | -14% | -14% | -47% | -49% | 0.09 | $9,900,000 |
| AXE | Archer Materials | -15% | -28% | -47% | -55% | 0.435 | $110,790,407 |
| DRE | Dreadnought Resources Ltd | -15% | -31% | -43% | 77% | 0.069 | $230,560,975 |
| CEL | Challenger Exp Ltd | -15% | -23% | -49% | -67% | 0.115 | $125,497,805 |
| BM8 | Battery Age Minerals | -15% | -29% | -15% | 8% | 0.425 | $33,398,173 |
| KTA | Krakatoa Resources | -15% | -25% | -46% | -20% | 0.033 | $11,375,427 |
| MKR | Manuka Resources. | -16% | -25% | -54% | -79% | 0.065 | $32,682,100 |
| TRM | Truscott Mining Corp | -16% | -57% | 29% | 69% | 0.054 | $9,026,481 |
| NML | Navarre Minerals Ltd | -16% | -19% | -24% | -68% | 0.032 | $46,012,133 |
| SVY | Stavely Minerals Ltd | -17% | -36% | 23% | -58% | 0.19 | $66,860,487 |
| NSM | Northstaw | -18% | -23% | -10% | -58% | 0.135 | $16,217,145 |
| ICG | Inca Minerals Ltd | -19% | 5% | -50% | -76% | 0.022 | $10,622,774 |
| ARL | Ardea Resources Ltd | -19% | -31% | -48% | -38% | 0.485 | $85,751,386 |
| TG1 | Techgen Metals Ltd | -19% | -33% | -71% | -44% | 0.059 | $3,301,154 |
| OAU | Ora Gold Limited | -25% | -40% | -40% | -70% | 0.003 | $11,810,775 |
| LRL | Labyrinth Resources | -27% | -35% | -50% | -73% | 0.011 | $10,554,361 |
| KNB | Koonenberrygold | -27% | 10% | -26% | -42% | 0.055 | $4,166,604 |
| MCT | Metalicity Limited | -33% | -20% | -60% | -68% | 0.002 | $7,009,079 |
| MTH | Mithril Resources | -33% | -43% | -67% | -85% | 0.002 | $6,526,180 |
| EMU | EMU NL | -33% | -29% | -64% | -84% | 0.002 | $2,471,808 |
| CLZ | Classic Min Ltd | -33% | -71% | -94% | -99% | 0.002 | $2,532,188 |
| GCY | Gascoyne Res Ltd | -36% | -36% | -65% | -60% | 0.1075 | $63,352,743 |
| BAT | Battery Minerals Ltd | -40% | -25% | -40% | -67% | 0.003 | $10,273,348 |
| DTR | Dateline Resources | -47% | -37% | -78% | -78% | 0.019 | $10,738,506 |
Related Topics

Related Stories

UNLOCK INSIGHTS
Discover the untold stories of emerging ASX stocks.
Daily news and expert analysis, it's free to subscribe.
By proceeding, you confirm you understand that we handle personal information in accordance with our Privacy Policy.


