Gold Digger: CHART – Frail Aussie dollar has local gold miners sitting pretty

Pic: Daisy-Daisy, iStock / Getty Images Plus
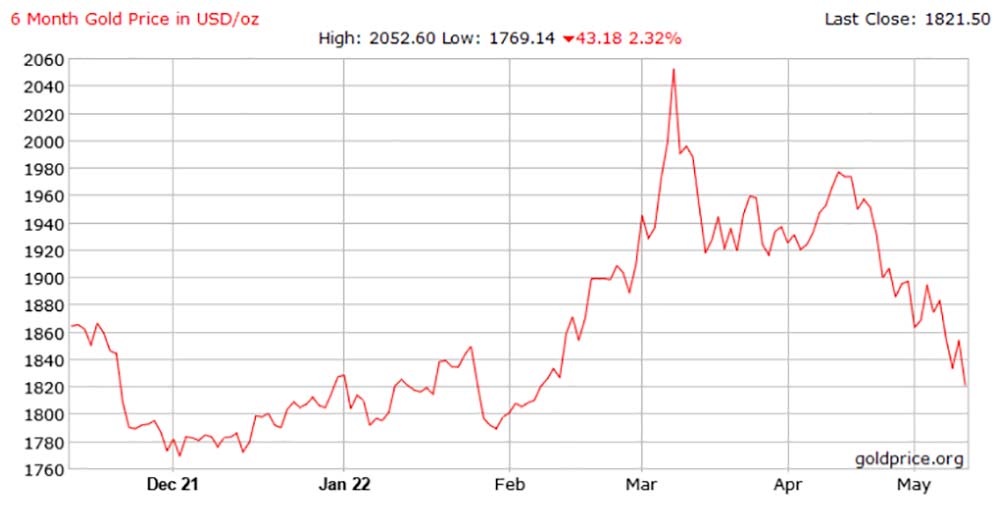
- US gold price down more than 10% or $200 from its peak
- But Aussie gold miners faring better due to weak AUD-USD exchange rate
- This week’s ASX standouts: Twenty Seven Co, OzAurum Resources
Our Gold Digger column wraps all the news driving ASX stocks with exposure to precious metals.
After nearly rising to a record high in early March, the US gold price has lost significant ground — down more than 10% or $200 from its peak.
“The sell-off accelerated in the last two weeks in the run-up to the Fed rate decision on 4th May and in its aftermath as gold’s traditional negative correlation with the US dollar re-emerged; bond yields, both nominal and real have also risen notably,” Metals Focus says.
Meanwhile, ASX-listed goldies are faring better than the average.
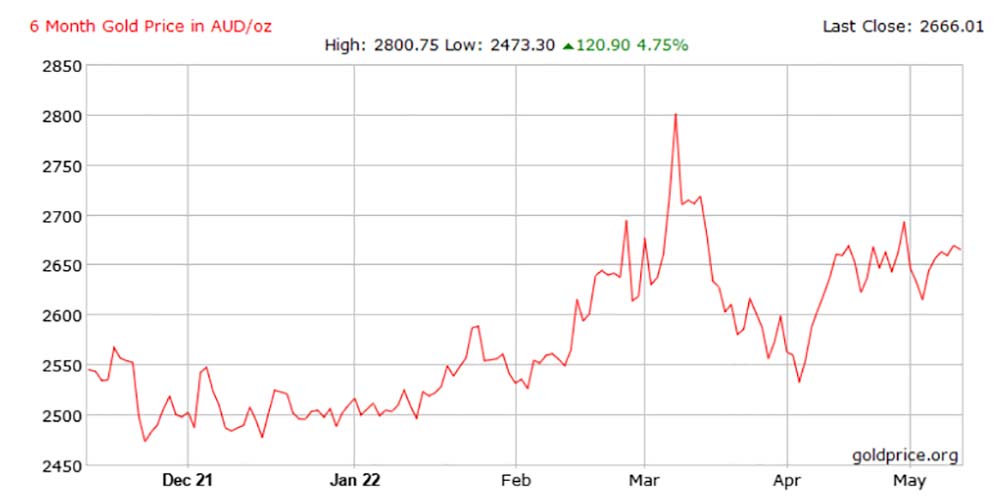
Why? If you’re an Australia-based producer you now have the added benefit of a super weak dollar, which is currently a lowly 68c versus the benchmark US dollar.
That means that while gold slipped in US dollar terms, it increased in real terms for local gold producers:
The strength in the US$ at 20-year highs is helping to distort the underlying health of commodity markets if you look only at US$ prices. Gold is a good example – the reference price is typically US$ – but in the context of the A$ gold price, it’s up over the past 2 months pic.twitter.com/skBTQnPPi6
— Gavin Wendt (@MineLifeReport) May 12, 2022
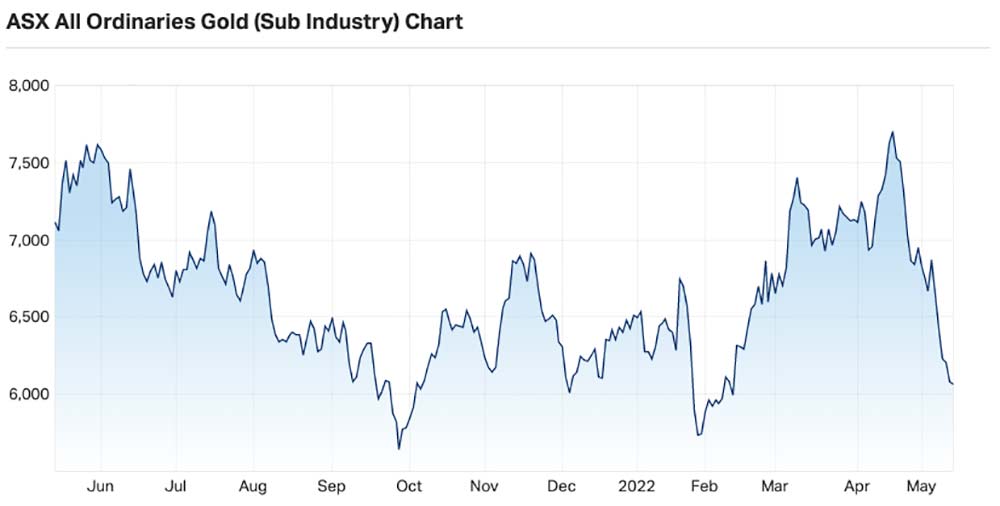
This silver lining hasn’t prevented the S&P/ASX All Ordinaries Gold index from plummeting to its lowest point since mid-February.
Gold holding steady, but outlook a crapshoot: Metals Focus
Despite the recent pull-back, gold prices seem to have found good support in the mid-US$1,800s, a level still comfortably higher than the beginning of the year.
“In essence, this reflects gold’s appeal as a hedge against inflation and geopolitical/economic uncertainties,” Metals Focus says.
“Sell-offs in the global stock and bond markets have also intensified in recent weeks, which have helped to limit the rotation out of gold among mainstream investors.
“As a reflection of this, flows into gold ETPs and physical investment (coins and bars), especially in western markets has been strong so far this year.
“Meanwhile, tactical shorts in the gold market have also remained subdued.”
But as official interest rates rise, Metals Focus forecasts the gold price to realise a weaker trend towards year-end.
That said, several factors justify holding gold for many mainstream investors.
“Among them is the growing risk that the slowdown in GDP growth may become more dramatic than expected, led by deepening supply-chain challenges, the Russia/Ukraine war and lockdowns in China,” it says.
“This may see current rate hike bets scaled back.
“Sentiment in stock and bond markets is also likely to remain fragile. Even following the recent sell-offs, equity valuations are still high by historical standards.
“All these factors should encourage institutional investors to retain their existing gold positions as a hedge against uncertainties. This in turn may prevent a heavy sell-off in the gold market.”
Winners & Losers
Here’s how ASX-listed gold & silver stocks are performing:
Scroll or swipe to reveal table. Click headings to sort. Best viewed on a laptop
> Stocks missing from this list? Email [email protected]
| CODE | COMPANY | 1 WEEK RETURN % | 1 MONTH RETURN % | 6 MONTH RETURN % | 1 YEAR RETURN % | PRICE | MARKET CAP |
|---|---|---|---|---|---|---|---|
| TAR | Taruga Minerals | 18% | -13% | -58% | -79% | 0.02 | $9,248,771.84 |
| TSC | Twenty Seven Co. | 17% | -13% | -30% | -30% | 0.0035 | $9,312,848.67 |
| OZM | Ozaurum Resources | 16% | 91% | 28% | 54% | 0.185 | $8,296,320.00 |
| AYM | Australia United Min | 14% | 33% | -20% | -11% | 0.008 | $14,740,619.88 |
| MCT | Metalicity Limited | 13% | 4% | -22% | -43% | 0.006 | $14,330,787.01 |
| BAT | Battery Minerals | 13% | 0% | -36% | -55% | 0.009 | $21,127,181.14 |
| AME | Alto Metals Limited | 7% | 2% | -20% | -27% | 0.088 | $44,355,151.01 |
| MDI | Middle Island Res | 7% | 20% | 63% | 25% | 0.15 | $17,138,551.08 |
| GSR | Greenstone Resources | 6% | -8% | 36% | 42% | 0.034 | $32,075,879.12 |
| EMU | EMU NL | 6% | -23% | -32% | -65% | 0.017 | $9,346,846.23 |
| NXM | Nexus Minerals | 4% | -10% | -39% | 234% | 0.3075 | $88,351,036.96 |
| OKU | Oklo Resources | 3% | 1% | -36% | -29% | 0.089 | $40,359,718.32 |
| KNB | Koonenberrygold | 3% | 4% | -32% | 0% | 0.099 | $7,027,354.27 |
| TNR | Torian Resources | 3% | 26% | 36% | -41% | 0.034 | $44,219,202.06 |
| CPM | Coopermetalslimited | 3% | -4% | 0% | 0% | 0.38 | $10,537,800.00 |
| VAN | Vango Mining | 2% | 26% | -22% | -29% | 0.049 | $61,736,943.97 |
| ADN | Andromeda Metals | 2% | -10% | -42% | -53% | 0.099 | $301,110,804.60 |
| WMC | Wiluna Mining Corp | 1% | -37% | -45% | -43% | 0.565 | $119,392,943.93 |
| RND | Rand Mining | 1% | -1% | 8% | 6% | 1.51 | $85,882,701.11 |
| NPM | Newpeak Metals | 0% | 0% | 0% | -50% | 0.001 | $8,849,750.03 |
| PNX | PNX Metals Limited | 0% | -9% | -26% | -31% | 0.005 | $22,220,289.04 |
| FAU | First Au | 0% | -13% | 8% | -28% | 0.013 | $10,645,842.34 |
| AAU | Antilles Gold | 0% | 0% | -19% | 2% | 0.064 | $22,264,512.54 |
| BMR | Ballymore Resources | 0% | 20% | 12% | 0% | 0.24 | $17,634,739.44 |
| REZ | Resourc & En Grp | 0% | 2% | -16% | 31% | 0.046 | $23,490,872.08 |
| LEX | Lefroy Exploration | 0% | -6% | -23% | -62% | 0.3 | $42,303,653.72 |
| MEI | Meteoric Resources | 0% | -19% | -28% | -75% | 0.013 | $18,315,568.45 |
| CTO | Citigold Corp | 0% | -13% | -36% | -36% | 0.007 | $19,835,613.64 |
| MHC | Manhattan Corp | 0% | -14% | 20% | -8% | 0.012 | $18,315,344.32 |
| TRY | Troy Resources | 0% | 0% | 0% | -44% | 0.037 | $31,631,563.33 |
| KGM | Kalnorth Gold | 0% | 0% | 0% | 0% | 0.013 | $11,625,120.78 |
| CGN | Crater Gold Min | 0% | 0% | 0% | -11% | 0.017 | $21,063,473.65 |
| LNY | Laneway Res | 0% | -17% | -5% | 4% | 0.005 | $31,510,082.05 |
| AGS | Alliance Resources | 0% | -3% | 9% | 16% | 0.175 | $41,538,497.28 |
| VKA | Viking Mines | 0% | -9% | -50% | -67% | 0.01 | $10,252,584.31 |
| BYH | Bryah Resources | 0% | -15% | -21% | -39% | 0.046 | $10,857,944.40 |
| RML | Resolution Minerals | 0% | -12% | -17% | -40% | 0.015 | $8,649,765.79 |
| PF1 | Pathfinder Resources | 0% | 0% | 75% | 92% | 0.5 | $26,560,505.00 |
| RDT | Red Dirt Metals | 0% | -13% | -43% | 160% | 0.455 | $122,112,684.41 |
| MBK | Metal Bank | 0% | 0% | -14% | -37% | 0.006 | $15,646,908.96 |
| OAU | Ora Gold Limited | 0% | -13% | 8% | -41% | 0.014 | $12,771,792.40 |
| TRM | Truscott Mining Corp | 0% | 7% | 69% | 96% | 0.049 | $7,445,135.66 |
| DLC | Delecta Limited | 0% | 0% | -42% | 83% | 0.011 | $13,253,995.76 |
| PNT | Panthermetals | 0% | -8% | 0% | 0% | 0.22 | $5,180,000.00 |
| BRV | Big River Gold | -1% | 23% | 27% | -8% | 0.3375 | $73,822,447.53 |
| GUL | Gullewa Limited | -1% | 4% | -13% | -14% | 0.074 | $13,706,863.20 |
| MM8 | Medallion Metals. | -2% | -15% | 17% | -4% | 0.245 | $25,979,715.72 |
| AWJ | Auric Mining | -2% | -2% | -27% | -44% | 0.084 | $4,709,825.99 |
| MAU | Magnetic Resources | -2% | -2% | -1% | 0% | 1.415 | $318,566,802.98 |
| VMC | Venus Metals Cor | -3% | -3% | 6% | 12% | 0.19 | $28,704,949.77 |
| SVY | Stavely Minerals | -3% | -17% | -26% | -43% | 0.365 | $96,555,737.24 |
| MTC | Metalstech | -3% | 12% | 3% | 241% | 0.33 | $53,332,668.80 |
| A1G | African Gold . | -3% | -14% | -30% | -32% | 0.15 | $16,717,445.92 |
| SLZ | Sultan Resources | -3% | -10% | -20% | -52% | 0.14 | $12,492,658.35 |
| HMG | Hamelingoldlimited | -3% | -7% | -18% | 0% | 0.14 | $15,400,000.00 |
| PNR | Pantoro Limited | -4% | -11% | 17% | 26% | 0.27 | $409,505,651.62 |
| TAM | Tanami Gold NL | -4% | -12% | -27% | -37% | 0.053 | $61,105,046.39 |
| GRL | Godolphin Resources | -4% | 0% | -11% | -31% | 0.125 | $10,515,068.25 |
| MEG | Megado | -4% | 14% | 36% | -17% | 0.125 | $5,381,099.75 |
| G88 | Golden Mile Res | -5% | -17% | 5% | -35% | 0.0525 | $9,982,898.09 |
| SFM | Santa Fe Minerals | -5% | -13% | 18% | 8% | 0.105 | $7,645,972.85 |
| CDR | Codrus Minerals | -5% | -13% | -56% | 0% | 0.082 | $3,280,000.00 |
| MKG | Mako Gold | -5% | -9% | -24% | -19% | 0.08 | $30,579,328.16 |
| CLA | Celsius Resource | -5% | -20% | -23% | -60% | 0.02 | $23,207,849.59 |
| KCN | Kingsgate Consolid. | -5% | -24% | -5% | 63% | 1.365 | $293,249,600.23 |
| BGD | Bartongoldholdings | -5% | -17% | -7% | 0% | 0.195 | $17,382,599.19 |
| PRX | Prodigy Gold NL | -5% | -14% | -42% | -62% | 0.019 | $12,235,179.73 |
| AGC | AGC | -5% | 7% | -18% | -36% | 0.09 | $6,095,455.56 |
| KAU | Kaiser Reef | -5% | -18% | -22% | -34% | 0.18 | $23,952,082.09 |
| NMR | Native Mineral Res | -6% | -21% | -23% | -44% | 0.17 | $7,501,834.80 |
| PGO | Pacgold | -6% | -11% | 37% | 0% | 0.63 | $31,386,009.06 |
| BCN | Beacon Minerals | -6% | -9% | -3% | -9% | 0.031 | $109,237,645.83 |
| GMD | Genesis Minerals | -6% | -24% | -3% | 120% | 1.38 | $330,397,193.38 |
| CYL | Catalyst Metals | -6% | -14% | -21% | -19% | 1.605 | $159,498,635.76 |
| EMR | Emerald Res NL | -6% | -11% | 3% | 11% | 1.07 | $623,758,345.08 |
| KCC | Kincora Copper | -6% | -18% | -42% | -75% | 0.09 | $6,664,441.33 |
| LYN | Lycaonresources | -6% | -9% | 0% | 0% | 0.375 | $11,067,187.50 |
| SAU | Southern Gold | -6% | -13% | -31% | -46% | 0.045 | $9,599,794.02 |
| S2R | S2 Resources | -6% | -12% | -25% | -14% | 0.15 | $53,456,228.25 |
| CY5 | Cygnus Gold Limited | -6% | -12% | -9% | 0% | 0.145 | $17,107,870.68 |
| FG1 | Flynngold | -6% | -15% | -19% | 0% | 0.145 | $9,609,157.50 |
| CXU | Cauldron Energy | -7% | -30% | -48% | -65% | 0.014 | $6,424,935.32 |
| ZAG | Zuleika Gold | -7% | -13% | 33% | -28% | 0.028 | $14,603,417.50 |
| ENR | Encounter Resources | -7% | -16% | -25% | 3% | 0.135 | $44,410,355.64 |
| SMS | Starmineralslimited | -7% | 0% | 5% | 0% | 0.195 | $5,775,000.00 |
| TRN | Torrens Mining | -7% | -4% | -13% | -7% | 0.13 | $9,218,941.94 |
| BC8 | Black Cat Syndicate | -7% | -35% | -26% | -37% | 0.445 | $74,307,350.88 |
| RVR | Red River Resources | -7% | -17% | -7% | -12% | 0.19 | $93,323,607.84 |
| EM2 | Eagle Mountain | -7% | -27% | -52% | -70% | 0.315 | $76,919,865.64 |
| QML | Qmines Limited | -7% | -17% | -34% | -14% | 0.25 | $16,963,028.15 |
| CAZ | Cazaly Resources | -8% | -10% | -18% | -31% | 0.037 | $13,720,406.34 |
| AWV | Anova Metals | -8% | -14% | -45% | -43% | 0.012 | $17,977,130.40 |
| PAK | Pacific American Hld | -8% | -25% | -40% | -42% | 0.012 | $5,734,528.82 |
| GMN | Gold Mountain | -8% | -14% | -68% | -84% | 0.006 | $7,158,895.02 |
| TBA | Tombola Gold | -8% | 30% | 76% | 32% | 0.06 | $50,194,980.24 |
| KZR | Kalamazoo Resources | -8% | -5% | -4% | -15% | 0.35 | $49,366,087.16 |
| GBZ | GBM Rsources | -8% | -23% | -20% | -16% | 0.092 | $46,613,310.93 |
| NVA | Nova Minerals | -8% | -27% | -56% | -56% | 0.61 | $114,428,450.98 |
| NAE | New Age Exploration | -8% | -15% | 0% | -42% | 0.011 | $15,794,888.01 |
| PGD | Peregrine Gold | -8% | -8% | 9% | 33% | 0.44 | $15,314,667.60 |
| OBM | Ora Banda Mining | -8% | -37% | -55% | -81% | 0.033 | $45,341,581.00 |
| KRM | Kingsrose Mining | -8% | -19% | -7% | 23% | 0.065 | $45,904,117.66 |
| AM7 | Arcadia Minerals | -9% | -16% | -14% | 0% | 0.215 | $7,523,387.50 |
| TCG | Turaco Gold Limited | -9% | -22% | -41% | 23% | 0.086 | $36,355,916.87 |
| BNR | Bulletin Res | -9% | -22% | 88% | 144% | 0.16 | $42,063,082.92 |
| GMR | Golden Rim Resources | -9% | -14% | -38% | -57% | 0.064 | $19,724,449.29 |
| CHZ | Chesser Resources | -9% | -13% | -36% | -29% | 0.096 | $56,756,941.67 |
| STK | Strickland Metals | -9% | 31% | 4% | 213% | 0.072 | $88,377,925.50 |
| PDI | Predictive Disc | -9% | 5% | -11% | 133% | 0.205 | $281,800,856.42 |
| GIB | Gibb River Diamonds | -9% | -2% | -32% | -2% | 0.061 | $12,902,076.15 |
| STN | Saturn Metals | -9% | -11% | -38% | -16% | 0.355 | $44,815,216.07 |
| GBR | Greatbould Resources | -9% | -27% | -39% | -13% | 0.091 | $37,968,495.57 |
| TMX | Terrain Minerals | -9% | 0% | 25% | -9% | 0.01 | $6,846,849.08 |
| HRN | Horizon Gold | -9% | -15% | -11% | -4% | 0.35 | $36,275,285.44 |
| AVW | Avira Resources | -9% | -17% | -29% | -29% | 0.005 | $10,593,950.00 |
| TLM | Talisman Mining | -9% | -12% | 7% | -38% | 0.15 | $27,222,227.07 |
| GNM | Great Northern | -9% | -17% | -29% | -44% | 0.005 | $8,545,254.88 |
| NCM | Newcrest Mining | -9% | -12% | -3% | -12% | 24.435 | $22,060,144,200.90 |
| RXL | Rox Resources | -9% | -9% | -15% | -35% | 0.34 | $55,750,512.51 |
| DRE | Dreadnought Resources | -10% | -14% | -14% | 58% | 0.038 | $105,031,291.39 |
| NES | Nelson Resources. | -10% | -5% | -47% | -76% | 0.019 | $5,297,348.95 |
| FEG | Far East Gold | -10% | 34% | 0% | 0% | 0.375 | $47,594,511.90 |
| CBY | Canterbury Resources | -10% | -14% | -49% | -40% | 0.056 | $6,899,117.68 |
| XAM | Xanadu Mines | -10% | 0% | 6% | -54% | 0.028 | $39,543,286.02 |
| DTM | Dart Mining NL | -10% | -19% | -35% | -54% | 0.065 | $7,469,455.80 |
| NWM | Norwest Minerals | -10% | -23% | -37% | -52% | 0.046 | $8,307,939.80 |
| MGV | Musgrave Minerals | -10% | -19% | -30% | -23% | 0.275 | $150,408,425.72 |
| GSM | Golden State Mining | -10% | -30% | -39% | -49% | 0.064 | $6,644,137.73 |
| ZNC | Zenith Minerals | -10% | -12% | 53% | 18% | 0.36 | $118,646,933.48 |
| AAR | Astral Resources NL | -10% | -23% | -13% | -15% | 0.081 | $49,482,876.84 |
| VRC | Volt Resources | -10% | -5% | -36% | -31% | 0.018 | $55,170,741.10 |
| SI6 | SI6 Metals Limited | -10% | 0% | -18% | -18% | 0.009 | $12,853,295.87 |
| KAI | Kairos Minerals | -10% | -7% | -27% | -4% | 0.027 | $51,014,430.77 |
| MXR | Maximus Resources | -10% | -4% | -2% | -11% | 0.072 | $22,253,403.76 |
| SBR | Sabre Resources | -10% | -36% | -10% | -10% | 0.0045 | $13,945,824.27 |
| CEL | Challenger Exp | -10% | -16% | -24% | -11% | 0.27 | $266,078,321.57 |
| SNG | Siren Gold | -10% | -4% | -1% | 54% | 0.355 | $30,398,372.28 |
| TBR | Tribune Res | -10% | -18% | -22% | -24% | 4.03 | $217,742,519.55 |
| ADT | Adriatic Metals | -10% | -14% | -22% | -8% | 2.18 | $457,965,629.00 |
| MOH | Moho Resources | -10% | -25% | -28% | -43% | 0.043 | $5,205,147.76 |
| MEU | Marmota Limited | -11% | 11% | 16% | 16% | 0.051 | $50,964,228.43 |
| ASO | Aston Minerals | -11% | -19% | 9% | -19% | 0.125 | $131,347,850.16 |
| WWI | West Wits Mining | -11% | -24% | -35% | -69% | 0.025 | $44,117,579.06 |
| NSM | Northstaw | -11% | -11% | -19% | -24% | 0.25 | $10,031,750.00 |
| THR | Thor Mining PLC | -11% | -22% | -22% | -26% | 0.0125 | $12,695,296.99 |
| SKY | SKY Metals | -11% | -20% | -9% | -48% | 0.08 | $29,765,894.13 |
| ADV | Ardiden | -11% | -8% | -14% | 9% | 0.012 | $32,020,024.27 |
| RMX | Red Mount Min | -11% | -16% | -38% | -11% | 0.008 | $12,317,728.94 |
| AXE | Archer Materials | -11% | -20% | -54% | -4% | 0.705 | $168,549,700.76 |
| MI6 | Minerals260Limited | -11% | -21% | -33% | 0% | 0.39 | $83,600,000.00 |
| X64 | Ten Sixty Four | -11% | -21% | -13% | -14% | 0.7 | $157,289,847.69 |
| TSO | Tesoro Gold | -11% | -22% | -26% | -66% | 0.062 | $40,774,582.34 |
| HCH | Hot Chili | -12% | -15% | -46% | -38% | 1.185 | $135,427,197.78 |
| BMO | Bastion Minerals | -12% | -12% | -43% | -17% | 0.15 | $12,907,974.20 |
| NAG | Nagambie Resources | -12% | -8% | -44% | -41% | 0.045 | $23,604,723.27 |
| HAV | Havilah Resources | -12% | -12% | -12% | -44% | 0.1675 | $52,667,148.69 |
| CAI | Calidus Resources | -12% | -13% | 36% | 114% | 0.845 | $352,009,882.00 |
| YRL | Yandal Resources | -12% | -8% | -50% | -67% | 0.22 | $25,540,141.66 |
| ANX | Anax Metals | -12% | -16% | -12% | -8% | 0.088 | $35,237,678.08 |
| HRZ | Horizon | -12% | -15% | -15% | -4% | 0.11 | $65,317,148.00 |
| RRL | Regis Resources | -12% | -17% | -15% | -30% | 1.83 | $1,366,145,099.38 |
| PRS | Prospech Limited | -12% | 4% | -34% | -61% | 0.051 | $3,324,231.26 |
| NST | Northern Star | -12% | -22% | -20% | -21% | 8.49 | $9,903,572,887.00 |
| ERM | Emmerson Resources | -12% | -34% | 16% | 26% | 0.092 | $48,851,707.50 |
| DCX | Discovex Res | -13% | -13% | 40% | 17% | 0.007 | $19,264,980.57 |
| IPT | Impact Minerals | -13% | -17% | -32% | -36% | 0.0105 | $21,904,615.86 |
| SIH | Sihayo Gold Limited | -13% | -30% | -56% | -73% | 0.0035 | $12,899,114.95 |
| MTH | Mithril Resources | -13% | -36% | -61% | -56% | 0.007 | $17,521,398.25 |
| MEK | Meeka Gold Limited | -13% | -14% | -22% | -31% | 0.042 | $35,895,025.34 |
| SLR | Silver Lake Resource | -13% | -31% | -21% | -22% | 1.475 | $1,362,697,513.22 |
| BEZ | Besragoldinc | -13% | -35% | -75% | 0% | 0.04 | $6,873,998.40 |
| AZS | Azure Minerals | -13% | -23% | -32% | -7% | 0.265 | $74,576,573.04 |
| SMI | Santana Minerals | -13% | 41% | 242% | 507% | 0.82 | $108,762,576.16 |
| BNZ | Benzmining | -13% | -6% | -9% | -23% | 0.62 | $32,157,436.46 |
| SFR | Sandfire Resources | -13% | -11% | -18% | -32% | 4.925 | $2,021,210,732.49 |
| MVL | Marvel Gold Limited | -13% | -15% | -43% | -21% | 0.039 | $28,172,774.80 |
| AQI | Alicanto Min | -14% | -17% | -43% | -41% | 0.083 | $30,697,089.36 |
| OKR | Okapi Resources | -14% | -37% | -48% | 21% | 0.255 | $26,942,009.79 |
| EVN | Evolution Mining | -14% | -24% | -19% | -32% | 3.405 | $6,323,876,506.35 |
| DEG | De Grey Mining | -14% | -19% | -17% | -29% | 1.0225 | $1,422,931,960.25 |
| ICL | Iceni Gold | -14% | 14% | -48% | -34% | 0.125 | $16,024,553.50 |
| BBX | BBX Minerals | -14% | -18% | -36% | -65% | 0.099 | $45,542,126.03 |
| DTR | Dateline Resources | -14% | -18% | 4% | -1% | 0.099 | $44,306,040.00 |
| ALK | Alkane Resources | -14% | -25% | -3% | 6% | 0.895 | $541,980,912.20 |
| CST | Castile Resources | -14% | 9% | -21% | -26% | 0.185 | $36,946,372.39 |
| RED | Red 5 Limited | -14% | -18% | 24% | 68% | 0.335 | $860,071,637.98 |
| RMS | Ramelius Resources | -14% | -13% | -30% | -30% | 1.24 | $1,075,557,535.16 |
| SSR | SSR Mining Inc. | -14% | -10% | 3% | 30% | 27.44 | $543,168,339.21 |
| GWR | GWR Group | -14% | -23% | 14% | -63% | 0.12 | $41,758,165.15 |
| WRM | White Rock Min | -14% | -40% | -54% | -73% | 0.12 | $20,840,297.28 |
| GCY | Gascoyne Res | -14% | -20% | -41% | -59% | 0.24 | $102,221,772.00 |
| SBM | St Barbara Limited | -14% | -22% | -29% | -42% | 1.1425 | $905,465,592.48 |
| MRR | Minrex Resources | -15% | -26% | 136% | 117% | 0.052 | $49,427,059.94 |
| AMI | Aurelia Metals | -15% | -27% | -17% | -18% | 0.345 | $420,599,195.38 |
| LCY | Legacy Iron Ore | -15% | -15% | 64% | 53% | 0.023 | $147,357,002.58 |
| DEX | Duke Exploration | -15% | -28% | -41% | -71% | 0.115 | $9,923,226.72 |
| WAF | West African Res | -15% | -12% | -17% | 16% | 1.1625 | $1,209,920,245.46 |
| WGX | Westgold Resources. | -15% | -30% | -37% | -37% | 1.315 | $620,279,977.46 |
| G50 | Gold50Limited | -15% | -17% | -22% | 0% | 0.2 | $11,203,600.20 |
| FML | Focus Minerals | -15% | -20% | -28% | -35% | 0.195 | $54,446,142.55 |
| RSG | Resolute Mining | -15% | -15% | -35% | -50% | 0.2925 | $314,620,483.20 |
| IVR | Investigator Res | -15% | -28% | -38% | -46% | 0.05 | $66,615,682.85 |
| LM8 | Lunnonmetalslimited | -15% | -17% | 129% | 0% | 0.86 | $93,394,707.95 |
| PUA | Peak Minerals | -15% | -39% | -27% | -44% | 0.011 | $12,496,449.01 |
| MKR | Manuka Resources. | -15% | -28% | -44% | -44% | 0.22 | $26,585,489.70 |
| KSN | Kingston Resources | -16% | -23% | -44% | -41% | 0.135 | $55,723,874.27 |
| TIE | Tietto Minerals | -16% | -17% | -7% | 39% | 0.4175 | $336,246,933.51 |
| PNM | Pacific Nickel Mines | -16% | -27% | -20% | 82% | 0.08 | $20,074,413.34 |
| WCN | White Cliff Min | -16% | -30% | 62% | 24% | 0.021 | $13,072,067.24 |
| ALY | Alchemy Resource | -16% | 24% | 62% | 34% | 0.021 | $18,108,407.08 |
| PRU | Perseus Mining | -16% | -11% | -3% | 40% | 1.695 | $2,091,746,017.67 |
| NML | Navarre Minerals | -16% | -10% | -14% | -35% | 0.078 | $107,809,100.01 |
| DGO | DGO Gold Limited | -16% | -23% | -11% | -26% | 2.65 | $236,577,490.14 |
| BGL | Bellevue Gold | -16% | -14% | -16% | -7% | 0.82 | $840,616,938.19 |
| GOR | Gold Road Res | -17% | -23% | -23% | -10% | 1.235 | $1,131,150,741.76 |
| GML | Gateway Mining | -17% | -17% | -41% | -58% | 0.01 | $24,861,170.04 |
| PUR | Pursuit Minerals | -17% | -35% | -43% | -63% | 0.02 | $18,910,983.88 |
| AGG | AngloGold Ashanti | -17% | -22% | -13% | -14% | 4.91 | $455,851,679.15 |
| BRB | Breaker Res NL | -17% | -20% | -48% | 16% | 0.215 | $71,685,004.38 |
| MRZ | Mont Royal Resources | -17% | -17% | -31% | -10% | 0.31 | $20,110,785.30 |
| OGC | OceanaGold Corp. | -17% | -12% | 1% | 15% | 3 | $216,554,575.16 |
| CDT | Castle Minerals | -17% | -31% | 36% | 217% | 0.038 | $33,982,761.46 |
| GED | Golden Deeps | -18% | -26% | 8% | 27% | 0.014 | $15,017,071.50 |
| M24 | Mamba Exploration | -18% | -22% | -48% | -51% | 0.105 | $4,217,500.30 |
| DCN | Dacian Gold | -18% | -33% | -24% | -45% | 0.185 | $206,164,641.97 |
| ICG | Inca Minerals | -18% | -34% | -34% | -31% | 0.086 | $41,414,153.72 |
| AUC | Ausgold Limited | -18% | -31% | 13% | 23% | 0.054 | $105,532,676.13 |
| MAT | Matsa Resources | -18% | -23% | -10% | -31% | 0.054 | $19,024,594.86 |
| CMM | Capricorn Metals | -18% | -22% | 14% | 78% | 3.41 | $1,270,805,080.86 |
| AAJ | Aruma Resources | -18% | -46% | -12% | 17% | 0.076 | $11,929,074.23 |
| MZZ | Matador Mining | -18% | -18% | -49% | -52% | 0.2 | $42,416,303.48 |
| GSN | Great Southern | -19% | -25% | -36% | -15% | 0.044 | $23,956,518.87 |
| MLS | Metals Australia | -19% | -43% | 114% | 114% | 0.0855 | $34,216,060.18 |
| TTM | Titan Minerals | -19% | -26% | -30% | -36% | 0.07 | $108,548,481.04 |
| TMZ | Thomson Res | -19% | -49% | -64% | -81% | 0.026 | $18,781,340.20 |
| SPQ | Superior Resources | -19% | -19% | 55% | 183% | 0.034 | $62,945,155.47 |
| E2M | E2 Metals | -19% | -28% | -31% | -50% | 0.17 | $33,852,494.91 |
| IDA | Indiana Resources | -19% | -13% | -14% | -35% | 0.055 | $24,178,595.16 |
| A8G | Australasian Metals | -19% | -24% | -39% | 84% | 0.3675 | $15,027,230.31 |
| TG1 | Techgen Metals | -19% | -14% | -49% | -51% | 0.125 | $5,225,059.92 |
| ARV | Artemis Resources | -20% | -47% | -60% | -65% | 0.037 | $55,533,239.36 |
| GTR | Gti Resources | -20% | -36% | -48% | -22% | 0.016 | $20,546,075.57 |
| AUT | Auteco Minerals | -21% | -30% | -29% | -36% | 0.058 | $109,567,014.90 |
| KWR | Kingwest Resources | -21% | -16% | -4% | 48% | 0.135 | $32,801,358.38 |
| BTR | Brightstar Resources | -21% | -26% | -57% | -30% | 0.023 | $14,877,799.99 |
| PKO | Peako Limited | -21% | 6% | -17% | -46% | 0.019 | $6,477,536.12 |
| KAL | Kalgoorliegoldmining | -21% | -31% | 0% | 0% | 0.11 | $7,967,806.00 |
| SVL | Silver Mines Limited | -22% | -25% | -25% | -31% | 0.18 | $245,448,107.17 |
| ARN | Aldoro Resources | -22% | -20% | -59% | -34% | 0.215 | $21,330,921.64 |
| M2R | Miramar | -22% | -29% | -36% | -38% | 0.125 | $7,986,568.13 |
| KTA | Krakatoa Resources | -22% | -29% | 39% | 34% | 0.082 | $26,887,373.53 |
| POL | Polymetals Resources | -22% | -13% | -32% | 0% | 0.105 | $4,205,939.43 |
| RDS | Redstone Resources | -22% | -46% | -50% | -46% | 0.007 | $5,157,826.77 |
| HXG | Hexagon Energy | -22% | -33% | -77% | -71% | 0.028 | $14,105,187.28 |
| LRL | Labyrinth Resources | -22% | -32% | -38% | -48% | 0.028 | $25,327,635.90 |
| ARL | Ardea Resources | -23% | -41% | 129% | 135% | 1.055 | $171,435,149.72 |
| XTC | Xantippe Res | -23% | -23% | 100% | 400% | 0.01 | $76,830,568.99 |
| FFX | Firefinch | -23% | -19% | 22% | 128% | 0.855 | $968,619,441.22 |
| LCL | Los Cerros Limited | -24% | -41% | -57% | -63% | 0.0645 | $40,856,215.37 |
| AQX | Alice Queen | -25% | -31% | -59% | -74% | 0.0045 | $8,497,573.38 |
| DDD | 3D Resources Limited | -25% | 0% | -25% | -25% | 0.003 | $12,545,616.28 |
| AL8 | Alderan Resource | -25% | -25% | -55% | -72% | 0.018 | $7,660,189.44 |
| RDN | Raiden Resources | -25% | -28% | -58% | -60% | 0.0105 | $14,136,539.58 |
| HAW | Hawthorn Resources | -25% | 9% | 118% | 161% | 0.12 | $40,021,873.56 |
| CHN | Chalice Mining | -26% | -24% | -43% | -25% | 5.29 | $1,860,323,003.76 |
| CWX | Carawine Resources | -29% | -29% | -25% | -49% | 0.15 | $22,053,495.52 |
| RGL | Riversgold | -33% | -43% | 106% | 1% | 0.041 | $22,857,843.76 |
| SRN | Surefire Rescs NL | -35% | 63% | 117% | 13% | 0.026 | $32,807,998.98 |
| HMX | Hammer Metals | -35% | -38% | 25% | -32% | 0.065 | $55,419,634.36 |
| ANL | Amani Gold | -50% | 0% | -50% | -33% | 0.001 | $23,293,441.13 |
WEEKLY SMALL CAP STANDOUTS
Shallow augur drilling confirms gold across three broad areas at the ‘Yarbu’ project, next door to Ramelius Resources’ (ASX:RMS) ‘Marda’ gold mine in the WA goldfields.
“This allows our technical team to accurately review and confidently plan drilling programs with the aim of identifying further gold mineralisation at depth,” TSC chairman Rohan Dalziell says.
“Follow-up aircore [deeper] drilling will be undertaken across priority target areas in due course.”
The explorer says a new diamond drill hole has hit gold-hosting rock at ‘Mulgabbie North’, “further validating the potential of Mulgabbie to be a significant gold discovery”.
Late last month, OZM hit 1.31g/t over 56m — including 18m @ 2.07g/t — in drilling at the Mulgabbie North, next door to Northern Star’s (ASX:NST) tier 1 Carosue Dam operations in WA.
The results, which include significant hits from three holes spaced 100m apart, come from a recently launched 7,500m reverse circulation (RC) drilling campaign.
It’s early days, but this virgin discovery at the so-called ‘Demag Zone’ remains ‘open’ all over the joint, OZM says.
RC drilling of the Demag Zone will commence in three weeks’ time.
Related Topics

Related Stories


UNLOCK INSIGHTS
Discover the untold stories of emerging ASX stocks.
Daily news and expert analysis, it's free to subscribe.
By proceeding, you confirm you understand that we handle personal information in accordance with our Privacy Policy.


