Gold Digger: ASX stocks perform strongly in a volatile week for gold

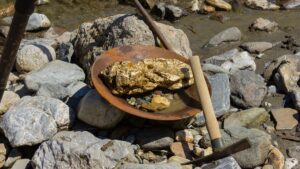
Pic: Getty
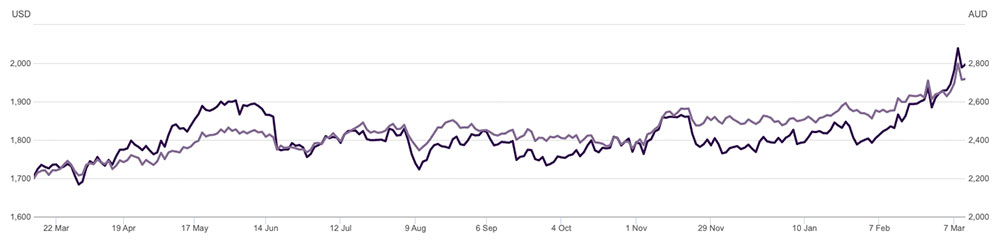
War gossip/news remains the main driver of gold prices.
The precious metal is having one of those volatile weeks where unless they timed their entry and exit perfectly, investors probably had a tough time whether long or short, says OANDA senior market analyst Jeffrey Halley.
For example, gold traded in a largish $US40/oz range overnight but finished only slightly higher. Silver demonstrated similar price action.
“With that in mind, I expect gold to range into the end of the week, supported by investor risk-hedging into the weekend,” Halley says.
“Support/resistance comes in at $US1970.00 and $US2010.00 an ounce which should cover it for the day.
“Obviously, a major headline hitting the wires will change that outlook.”
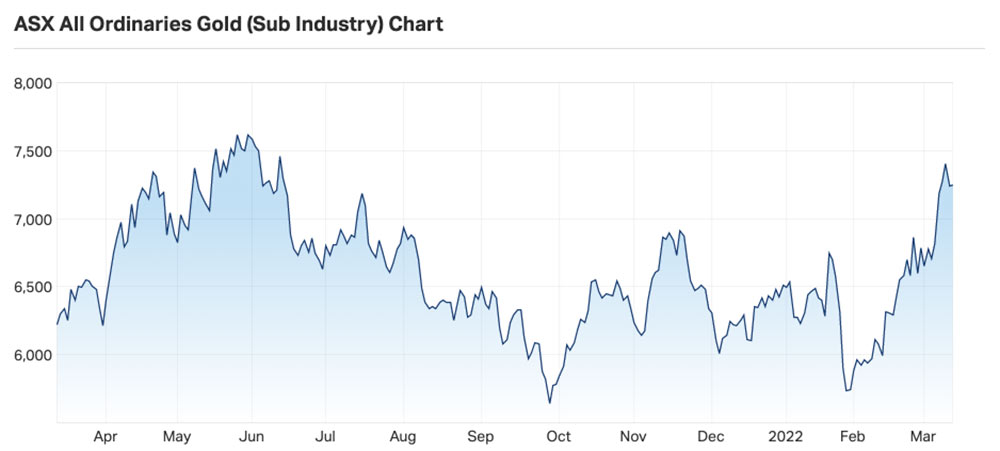
But it looks like sentiment is returning to the gold space
A strong week for ASX gold stocks, especially the large cap miners.
Overall, 124 stocks on our list went up this week, 100 went down, and 43 didn’t move.
The S&P/ASX All Ordinaries Gold (XGD) index — a benchmark for Australian gold companies – gained almost 8%.
It is currently up 19.2% over the past month, and 26% from recent lows on January 31.
Winners & Losers
Here’s how ASX-listed gold & silver stocks are performing:
Scroll or swipe to reveal table. Click headings to sort. Best viewed on a laptop
>> Stocks missing from this list? Email [email protected]
| CODE | COMPANY | 1 WEEK RETURN % | 1 MONTH RETURN % | 6 MONTH RETURN % | 1 YEAR RETURN % | PRICE [INTRADAY FRI] | MARKET CAP |
|---|---|---|---|---|---|---|---|
| MRR | Minrex Resources | -10% | -26% | 250% | 155% | 0.056 | $50,306,356.62 |
| NPM | Newpeak Metals | 0% | 0% | 0% | -50% | 0.001 | $8,849,750.03 |
| ASO | Aston Minerals | 3% | 0% | 7% | 176% | 0.16 | $157,442,575.79 |
| MTC | Metalstech | -2% | -27% | -12% | 115% | 0.2 | $33,332,918.00 |
| FFX | Firefinch | 5% | 6% | 25% | 258% | 0.77 | $895,383,512.00 |
| GED | Golden Deeps | 0% | -9% | -13% | 11% | 0.01 | $7,758,514.40 |
| G88 | Golden Mile Res | 12% | 19% | 16% | 23% | 0.064 | $10,554,118.01 |
| DCX | Discovex Res | -10% | -25% | 80% | 29% | 0.009 | $23,117,976.68 |
| NMR | Native Mineral Res | -7% | 6% | -6% | -10% | 0.2375 | $10,480,504.50 |
| AQX | Alice Queen | 7% | -6% | -29% | -74% | 0.0075 | $11,496,360.08 |
| SLZ | Sultan Resources | 3% | 10% | 0% | -11% | 0.17 | $13,741,924.19 |
| MKG | Mako Gold | 1% | 0% | 2% | -6% | 0.09 | $34,401,744.18 |
| KSN | Kingston Resources | 13% | 0% | -3% | -10% | 0.18 | $70,170,804.63 |
| AMI | Aurelia Metals | -3% | -1% | 29% | 24% | 0.4525 | $562,860,687.94 |
| PNX | PNX Metals Limited | -9% | -9% | -26% | -26% | 0.005 | $22,220,289.04 |
| GIB | Gibb River Diamonds | 3% | -9% | -7% | -14% | 0.063 | $12,690,566.70 |
| KCN | Kingsgate Consolid. | 23% | -13% | 99% | 59% | 1.45 | $344,153,304.42 |
| TMX | Terrain Minerals | 0% | -13% | -30% | -30% | 0.007 | $5,150,327.06 |
| BNR | Bulletin Res | -3% | 24% | 74% | 136% | 0.155 | $42,833,986.50 |
| NXM | Nexus Minerals | 6% | -4% | 27% | 292% | 0.38 | $112,973,457.09 |
| SKY | SKY Metals | 0% | -11% | -8% | -49% | 0.082 | $30,142,677.60 |
| LM8 | Lunnonmetalslimited | 17% | 7% | 84% | 0% | 1.05 | $77,618,063.00 |
| CST | Castile Resources | 3% | -8% | -18% | 0% | 0.18 | $33,950,720.57 |
| YRL | Yandal Resources | -16% | -32% | -52% | -50% | 0.245 | $29,022,888.25 |
| FAU | First Au | 11% | 0% | -17% | -33% | 0.01 | $7,839,109.49 |
| ARL | Ardea Resources | 19% | 15% | 95% | 87% | 0.83 | $134,782,528.74 |
| GWR | GWR Group | 3% | -3% | 0% | -28% | 0.17 | $51,394,664.80 |
| AGG | AngloGold Ashanti | 4% | 26% | 57% | 21% | 6.88 | $600,368,258.45 |
| IVR | Investigator Res | 9% | 18% | 6% | -15% | 0.072 | $97,258,896.96 |
| GTR | Gti Resources | 5% | 0% | -22% | 38% | 0.023 | $24,833,187.02 |
| IPT | Impact Minerals | 8% | 0% | 8% | -39% | 0.014 | $32,380,718.70 |
| BNZ | Benzmining | -8% | -8% | -30% | -25% | 0.58 | $30,536,960.09 |
| MOH | Moho Resources | 0% | -15% | -23% | -39% | 0.046 | $5,855,791.23 |
| BBX | BBX Minerals | -7% | -24% | -35% | -54% | 0.13 | $62,102,899.13 |
| PUA | Peak Minerals | 0% | 0% | -19% | -39% | 0.013 | $12,496,449.01 |
| MRZ | Mont Royal Resources | -8% | -6% | -17% | 7% | 0.3 | $19,950,824.57 |
| SMS | Starmineralslimited | 8% | 2% | 0% | 0% | 0.21 | $5,512,500.00 |
| MVL | Marvel Gold Limited | 0% | -18% | -16% | 6% | 0.046 | $26,998,909.17 |
| PRX | Prodigy Gold NL | 8% | -7% | -36% | -30% | 0.028 | $15,730,945.36 |
| AAU | Antilles Gold | 7% | -10% | -4% | -10% | 0.08 | $23,712,386.96 |
| CWX | Carawine Resources | -1% | 25% | 5% | -36% | 0.21 | $29,634,384.61 |
| RND | Rand Mining | 3% | 1% | 7% | -5% | 1.55 | $88,726,499.16 |
| CAZ | Cazaly Resources | -2% | -9% | -13% | 0% | 0.041 | $15,203,693.51 |
| BMR | Ballymore Resources | 0% | -18% | -45% | 0% | 0.165 | $12,123,883.37 |
| DRE | Dreadnought Resources | -7% | -9% | 8% | 150% | 0.04 | $110,708,658.49 |
| ZNC | Zenith Minerals | -3% | -12% | 42% | 209% | 0.34 | $116,927,412.70 |
| REZ | Resourc & En Grp | -7% | -18% | 28% | 8% | 0.041 | $19,992,231.56 |
| LEX | Lefroy Exploration | -9% | 2% | -27% | -49% | 0.32 | $46,679,893.76 |
| ERM | Emmerson Resources | 0% | -11% | 79% | 107% | 0.12 | $59,918,218.68 |
| AM7 | Arcadia Minerals | 2% | -8% | 5% | 0% | 0.23 | $8,048,275.00 |
| ADT | Adriatic Metals | -8% | -9% | -28% | 2% | 2.14 | $452,762,746.59 |
| GMR | Golden Rim Resources | -10% | -18% | -14% | -33% | 0.09 | $21,890,856.34 |
| CYL | Catalyst Metals | 0% | -2% | -1% | -8% | 1.85 | $172,297,515.25 |
| CHN | Chalice Mining | 1% | -3% | 13% | 101% | 7.775 | $2,786,934,270.90 |
| KAL | Kalgoorliegoldmining | -6% | -6% | 0% | 0% | 0.155 | $11,227,363.00 |
| MLS | Metals Australia | -16% | 23% | 85% | 48% | 0.074 | $18,858,822.84 |
| ADN | Andromeda Metals | 3% | 3% | 22% | -38% | 0.195 | $611,080,559.60 |
| MEI | Meteoric Resources | -13% | -18% | -61% | -77% | 0.014 | $19,841,865.82 |
| SRN | Surefire Rescs NL | 25% | -6% | 0% | -44% | 0.015 | $15,793,650.73 |
| SIH | Sihayo Gold Limited | -7% | -19% | -28% | -41% | 0.0065 | $25,798,229.89 |
| AWV | Anova Metals | 0% | 0% | -18% | 0% | 0.018 | $25,795,695.60 |
| HMX | Hammer Metals | 9% | 36% | 24% | -7% | 0.098 | $78,239,483.81 |
| WCN | White Cliff Min | -4% | -23% | 108% | 59% | 0.027 | $18,217,539.17 |
| PAK | Pacific American Hld | 0% | -12% | -5% | -23% | 0.015 | $7,168,161.03 |
| WRM | White Rock Min | 5% | -2% | -33% | -65% | 0.21 | $31,538,028.20 |
| TNR | Torian Resources | -4% | -10% | -10% | -53% | 0.027 | $37,519,322.96 |
| MCT | Metalicity Limited | 8% | -18% | -22% | -56% | 0.007 | $17,765,071.99 |
| AME | Alto Metals Limited | 16% | 15% | 15% | 24% | 0.093 | $49,107,488.62 |
| CTO | Citigold Corp | 0% | 0% | -10% | -31% | 0.009 | $25,502,931.82 |
| TIE | Tietto Minerals | -2% | -4% | 74% | 85% | 0.575 | $418,173,073.47 |
| SMI | Santana Minerals | 10% | 32% | 445% | 286% | 0.54 | $72,950,508.40 |
| M2R | Miramar | 0% | -15% | -13% | -20% | 0.175 | $8,717,628.50 |
| MHC | Manhattan Corp | 0% | -13% | 0% | -18% | 0.014 | $19,841,623.01 |
| GRL | Godolphin Resources | -7% | 0% | -24% | -35% | 0.13 | $10,934,478.23 |
| TRY | Troy Resources | 0% | 0% | 0% | -44% | 0.037 | $31,631,563.33 |
| KGM | Kalnorth Gold | 0% | 0% | 0% | 0% | 0.013 | $11,625,120.78 |
| CGN | Crater Gold Min | 0% | 0% | 0% | -11% | 0.017 | $21,063,473.65 |
| LNY | Laneway Res | -8% | -15% | 10% | 10% | 0.0055 | $25,995,810.13 |
| TSC | Twenty Seven Co. | -25% | -25% | 0% | -54% | 0.003 | $9,312,848.67 |
| GUL | Gullewa Limited | -1% | 1% | -25% | -24% | 0.068 | $12,945,370.80 |
| CY5 | Cygnus Gold Limited | -6% | -6% | 31% | 6% | 0.17 | $20,057,503.55 |
| G50 | Gold50Limited | 13% | 16% | 4% | 0% | 0.26 | $14,564,680.26 |
| ADV | Ardiden | 8% | -24% | -13% | -24% | 0.013 | $34,588,350.63 |
| AAR | Anglo Australian | 10% | -8% | 29% | 20% | 0.11 | $65,579,716.29 |
| MGV | Musgrave Minerals | 3% | 6% | 14% | 6% | 0.33 | $177,267,073.17 |
| AGS | Alliance Resources | 0% | 24% | 23% | 0% | 0.18 | $37,443,084.12 |
| VMC | Venus Metals Cor | 6% | -12% | 9% | 0% | 0.19 | $27,949,556.36 |
| NAE | New Age Exploration | -7% | -24% | 30% | 8% | 0.013 | $17,230,786.92 |
| VKA | Viking Mines | 5% | -28% | -36% | -71% | 0.0115 | $11,790,471.96 |
| LCL | Los Cerros Limited | 0% | -12% | -21% | -12% | 0.11 | $70,253,299.05 |
| MTH | Mithril Resources | 4% | -4% | -22% | -34% | 0.0125 | $33,543,029.53 |
| DDD | 3D Resources Limited | 0% | 0% | -25% | -27% | 0.003 | $12,541,116.28 |
| RMX | Red Mount Min | 6% | -15% | -15% | -23% | 0.0085 | $13,138,910.86 |
| PRS | Prospech Limited | 4% | -8% | -41% | -64% | 0.048 | $3,128,688.24 |
| XTC | Xantippe Res | -7% | -41% | 333% | 225% | 0.0065 | $44,096,557.96 |
| TTM | Titan Minerals | -9% | -13% | -16% | -9% | 0.105 | $136,742,891.70 |
| NML | Navarre Minerals | 0% | 15% | 14% | -29% | 0.1 | $136,467,215.20 |
| RXL | Rox Resources | -4% | -8% | -5% | -26% | 0.4 | $67,576,378.80 |
| MZZ | Matador Mining | -3% | -5% | -26% | -5% | 0.285 | $62,935,656.45 |
| KZR | Kalamazoo Resources | 0% | -9% | -18% | -31% | 0.295 | $40,654,424.72 |
| BCN | Beacon Minerals | 3% | 9% | 9% | 0% | 0.036 | $129,292,379.71 |
| MAU | Magnetic Resources | 0% | 2% | -12% | -8% | 1.45 | $320,810,231.17 |
| BC8 | Black Cat Syndicate | 2% | -5% | 0% | -14% | 0.57 | $80,402,952.27 |
| EM2 | Eagle Mountain | -6% | -14% | -32% | 11% | 0.545 | $127,429,434.12 |
| EMR | Emerald Res NL | -3% | 5% | 26% | 42% | 1.11 | $591,537,547.70 |
| BYH | Bryah Resources | -8% | -22% | -2% | -20% | 0.047 | $10,179,322.88 |
| HCH | Hot Chili | -12% | -8% | -32% | -35% | 1.4 | $151,423,780.26 |
| WAF | West African Res | 16% | 9% | 29% | 48% | 1.295 | $1,296,597,590.95 |
| MEU | Marmota Limited | 5% | -7% | -7% | -2% | 0.043 | $43,123,577.90 |
| NVA | Nova Minerals | -4% | -34% | -59% | -62% | 0.595 | $97,309,233.90 |
| DCN | Dacian Gold | 16% | 39% | 25% | -37% | 0.25 | $271,269,265.75 |
| SVL | Silver Mines Limited | 5% | 23% | 20% | 23% | 0.2525 | $322,958,035.75 |
| PGD | Peregrine Gold | -2% | -9% | 44% | 0% | 0.52 | $19,093,751.50 |
| ICL | Iceni Gold | 14% | 0% | -42% | 0% | 0.125 | $16,665,535.64 |
| FG1 | Flynngold | 7% | -6% | 7% | 0% | 0.16 | $10,249,768.00 |
| WWI | West Wits Mining | -14% | -16% | -19% | -50% | 0.038 | $69,852,833.52 |
| RML | Resolution Minerals | -6% | 6% | -23% | -29% | 0.017 | $10,533,865.58 |
| AAJ | Aruma Resources | -1% | -28% | -14% | 43% | 0.083 | $12,870,843.25 |
| AL8 | Alderan Resource | 5% | -20% | -59% | -77% | 0.02 | $8,936,887.68 |
| GMN | Gold Mountain | 11% | -41% | -55% | -73% | 0.01 | $10,701,491.70 |
| MEG | Megado | 10% | -1% | -23% | -50% | 0.085 | $3,659,147.83 |
| HMG | Hamelingoldlimited | -3% | -3% | 0% | 0% | 0.17 | $19,250,000.00 |
| TBA | Tombola Gold | 17% | 17% | -17% | -27% | 0.035 | $30,044,988.14 |
| DGO | DGO Gold Limited | 7% | 4% | -8% | -1% | 2.7 | $212,866,635.60 |
| PF1 | Pathfinder Resources | -7% | -2% | 33% | 67% | 0.4 | $21,779,614.10 |
| TBR | Tribune Res | 1% | -3% | -8% | -6% | 4.62 | $253,945,492.68 |
| FML | Focus Minerals | -9% | -4% | 0% | -16% | 0.255 | $73,072,454.48 |
| GSR | Greenstone Resources | 0% | 0% | 28% | 76% | 0.037 | $33,908,786.49 |
| VRC | Volt Resources | 8% | -39% | -59% | 0% | 0.014 | $40,144,157.33 |
| ARV | Artemis Resources | -3% | -5% | -18% | 0% | 0.07 | $94,406,506.91 |
| HRN | Horizon Gold | -1% | -5% | 17% | -9% | 0.42 | $45,877,566.88 |
| CLA | Celsius Resource | -21% | -34% | -37% | -57% | 0.019 | $24,429,315.36 |
| QML | Qmines Limited | 6% | -9% | -25% | 0% | 0.265 | $17,628,244.94 |
| RDN | Raiden Resources | 13% | -10% | -33% | -14% | 0.018 | $24,755,891.47 |
| TCG | Turaco Gold Limited | 0% | -13% | -13% | 75% | 0.105 | $44,910,250.25 |
| KCC | Kincora Copper | -17% | 4% | -31% | 0% | 0.125 | $9,880,801.07 |
| GBZ | GBM Rsources | 9% | 6% | 16% | 21% | 0.1275 | $63,854,249.25 |
| DTM | Dart Mining NL | -6% | -2% | -36% | -58% | 0.08 | $9,959,274.40 |
| MKR | Manuka Resources. | -3% | -9% | -12% | -17% | 0.295 | $34,265,742.28 |
| AUC | Ausgold Limited | 14% | 4% | 17% | 0% | 0.049 | $77,494,777.97 |
| ANX | Anax Metals | -4% | -8% | -19% | 33% | 0.089 | $35,237,678.08 |
| EMU | EMU NL | 24% | 11% | -32% | -63% | 0.021 | $10,996,289.68 |
| SFM | Santa Fe Minerals | -19% | -21% | 100% | 79% | 0.17 | $12,379,194.13 |
| SSR | SSR Mining Inc. | 7% | 23% | 36% | 53% | 29.39 | $579,295,929.60 |
| PNR | Pantoro Limited | 11% | 5% | 66% | 58% | 0.34 | $479,229,557.32 |
| CMM | Capricorn Metals | 3% | 12% | 67% | 156% | 3.965 | $1,449,163,688.70 |
| MML | Medusa Mining | 11% | 24% | 7% | -5% | 0.865 | $190,343,511.34 |
| SI6 | SI6 Metals Limited | -5% | -14% | -21% | -50% | 0.0095 | $13,567,367.86 |
| HAW | Hawthorn Resources | -11% | -7% | 70% | 18% | 0.085 | $28,348,827.11 |
| BGD | Bartongoldholdings | 6% | -11% | 40% | 0% | 0.255 | $21,889,198.98 |
| SVY | Stavely Minerals | 17% | -4% | 2% | -38% | 0.45 | $112,213,424.36 |
| AOP | Apollo Consolidated | -100% | -100% | -100% | -100% | 0 | $177,888,559.90 |
| KWR | Kingwest Resources | 3% | -15% | 133% | 26% | 0.17 | $38,875,684.00 |
| AGC | AGC | -5% | -9% | -32% | -49% | 0.089 | $5,960,000.99 |
| RVR | Red River Resources | 2% | 29% | 40% | 7% | 0.245 | $127,023,799.56 |
| RGL | Riversgold | 35% | 67% | 13% | -27% | 0.035 | $13,737,434.66 |
| TSO | Tesoro Resources | 5% | 6% | -26% | -59% | 0.0775 | $53,474,862.08 |
| OKR | Okapi Resources | 16% | 3% | -50% | 97% | 0.325 | $38,053,981.23 |
| CPM | Coopermetalslimited | -13% | -20% | 0% | 0% | 0.45 | $12,429,200.00 |
| MM8 | Medallion Metals. | 10% | 8% | 6% | 0% | 0.265 | $27,040,112.28 |
| TRN | Torrens Mining | -3% | -20% | -22% | -13% | 0.14 | $10,105,378.67 |
| AUT | Auteco Minerals | -8% | -23% | -14% | -18% | 0.074 | $154,475,778.07 |
| CBY | Canterbury Resources | -14% | -12% | -45% | -43% | 0.06 | $7,391,911.80 |
| LYN | Lycaonresources | 3% | -13% | 0% | 0% | 0.35 | $9,843,750.00 |
| SFR | Sandfire Resources | -11% | -25% | -6% | 1% | 5.55 | $2,287,698,962.94 |
| NCM | Newcrest Mining | 6% | 18% | 12% | 12% | 26.79 | $24,055,208,316.58 |
| TMZ | Thomson Res | -3% | -22% | -48% | -59% | 0.057 | $33,784,662.03 |
| TAM | Tanami Gold NL | 2% | 0% | -14% | -26% | 0.06 | $70,505,822.76 |
| KLA | Kirkland Lake Gold | -100% | -100% | -100% | -100% | 0 | $52,690,000.00 |
| WMC | Wiluna Mining Corp | -3% | -10% | -10% | -12% | 0.95 | $200,749,197.75 |
| NWM | Norwest Minerals | 16% | 12% | -6% | -15% | 0.066 | $11,920,087.54 |
| ALK | Alkane Resources | 0% | 29% | 31% | 55% | 1.085 | $661,097,596.20 |
| BMO | Bastion Minerals | 6% | 15% | -21% | 0% | 0.19 | $14,426,559.40 |
| IDA | Indiana Resources | -3% | 2% | 5% | -25% | 0.06 | $25,491,627.62 |
| GSM | Golden State Mining | -3% | -14% | -42% | -50% | 0.078 | $6,480,862.83 |
| NSM | Northstaw | 3% | 3% | 2% | -34% | 0.3 | $12,038,100.00 |
| GSN | Great Southern | 11% | -3% | 6% | -13% | 0.054 | $28,747,822.64 |
| RED | Red 5 Limited | 17% | 28% | 88% | 132% | 0.385 | $883,635,244.50 |
| DEG | De Grey Mining | 19% | 21% | 35% | 59% | 1.405 | $2,019,315,533.38 |
| THR | Thor Mining PLC | 4% | -3% | -3% | 4% | 0.0145 | $13,070,380.30 |
| CDR | Codrus Minerals | -8% | -4% | -29% | 0% | 0.11 | $4,400,000.00 |
| MDI | Middle Island Res | 0% | -11% | 20% | -49% | 0.12 | $14,690,186.64 |
| BAT | Battery Minerals | 0% | -9% | -41% | -60% | 0.01 | $21,127,181.14 |
| POL | Polymetals Resources | -4% | -11% | -8% | 0% | 0.12 | $4,806,787.92 |
| OKU | Oklo Resources | -5% | -10% | -27% | -49% | 0.095 | $46,413,676.07 |
| RDS | Redstone Resources | -10% | -31% | -25% | -25% | 0.009 | $6,631,491.56 |
| NAG | Nagambie Resources | -5% | 4% | -34% | 0% | 0.052 | $25,996,481.99 |
| BGL | Bellevue Gold | -1% | 14% | 15% | 24% | 0.945 | $990,120,102.72 |
| GBR | Greatbould Resources | 11% | 3% | 0% | 297% | 0.155 | $51,799,192.31 |
| KAI | Kairos Minerals | 4% | -8% | -25% | 0% | 0.024 | $47,090,243.78 |
| KAU | Kaiser Reef | 4% | -1% | -9% | -44% | 0.1975 | $26,541,496.37 |
| HRZ | Horizon | -4% | -15% | 5% | 10% | 0.11 | $65,317,148.00 |
| CAI | Calidus Resources | 7% | 21% | 50% | 106% | 0.845 | $340,225,261.90 |
| CDT | Castle Minerals | -4% | -9% | 247% | 550% | 0.052 | $50,974,142.18 |
| RSG | Resolute Mining | 16% | 2% | -28% | -50% | 0.3125 | $347,738,428.80 |
| MXR | Maximus Resources | 0% | -7% | -25% | -46% | 0.065 | $20,663,874.92 |
| EVN | Evolution Mining | 7% | 19% | 17% | 12% | 4.43 | $8,120,224,035.69 |
| AXE | Archer Materials | -4% | -15% | -45% | 4% | 0.96 | $242,615,862.86 |
| CXU | Cauldron Energy | 11% | -5% | -49% | -36% | 0.021 | $10,317,166.23 |
| RDT | Red Dirt Metals | -6% | -18% | 106% | 181% | 0.505 | $146,555,064.32 |
| ALY | Alchemy Resource | -8% | -14% | -12% | 2% | 0.012 | $11,428,138.68 |
| HXG | Hexagon Energy | -7% | -7% | -34% | -50% | 0.053 | $24,999,477.05 |
| OBM | Ora Banda Mining | 0% | -11% | -49% | -79% | 0.049 | $60,223,761.35 |
| SLR | Silver Lake Resource | 12% | 32% | 61% | 30% | 2.095 | $1,925,449,728.57 |
| VAN | Vango Mining | 0% | 0% | -39% | -43% | 0.039 | $47,877,630.02 |
| AVW | Avira Resources | 0% | -9% | 0% | -17% | 0.005 | $11,653,345.00 |
| LCY | Legacy Iron Ore | 0% | 5% | 25% | 43% | 0.02 | $128,136,523.98 |
| PDI | Predictive Disc | 7% | -8% | 100% | 277% | 0.23 | $316,118,251.86 |
| BRV | Big River Gold | -10% | 8% | -7% | -38% | 0.26 | $62,760,324.53 |
| MAT | Matsa Resources | 3% | -3% | -6% | -27% | 0.062 | $22,973,095.68 |
| ZAG | Zuleika Gold | 0% | -21% | 18% | -20% | 0.033 | $13,648,581.31 |
| GML | Gateway Mining | 8% | 8% | -19% | -52% | 0.013 | $27,121,276.40 |
| BDC | Bardoc Gold | 13% | 13% | 37% | 24% | 0.535 | $156,990,934.62 |
| SBM | St Barbara Limited | 17% | 13% | 9% | -20% | 1.575 | $1,128,148,007.91 |
| SBR | Sabre Resources | 50% | 33% | 33% | 20% | 0.006 | $12,208,881.89 |
| STK | Strickland Metals | -3% | -9% | 44% | 165% | 0.059 | $76,790,370.00 |
| SAU | Southern Gold | 4% | -5% | -11% | -36% | 0.057 | $12,159,739.09 |
| CEL | Challenger Exp | 4% | 22% | 29% | 25% | 0.355 | $342,808,815.30 |
| LRL | Labyrinth Resources | 3% | 0% | 3% | 28% | 0.041 | $33,187,936.69 |
| NST | Northern Star | 9% | 25% | 19% | 13% | 10.835 | $12,566,154,837.21 |
| OZM | Ozaurum Resources | 0% | -8% | -24% | -42% | 0.11 | $6,293,760.00 |
| TG1 | Techgen Metals | -5% | -19% | -42% | 0% | 0.105 | $4,354,216.60 |
| XAM | Xanadu Mines | 4% | 4% | 8% | -48% | 0.027 | $32,891,855.26 |
| CHZ | Chesser Resources | 6% | 5% | -25% | -42% | 0.105 | $51,687,351.54 |
| AQI | Alicanto Min | 5% | 10% | -4% | 0% | 0.11 | $40,184,929.79 |
| KTA | Krakatoa Resources | 8% | -12% | -37% | -36% | 0.043 | $12,083,106.60 |
| ARN | Aldoro Resources | -9% | -19% | -28% | 77% | 0.345 | $30,959,813.21 |
| WGX | Westgold Resources. | 6% | 21% | 50% | 17% | 2.44 | $1,038,210,645.04 |
| MBK | Metal Bank | 0% | -14% | -43% | -43% | 0.006 | $15,646,908.96 |
| A8G | Australasian Metals | -3% | -16% | 73% | 0% | 0.475 | $19,281,837.12 |
| TAR | Taruga Minerals | 0% | -15% | -35% | -31% | 0.033 | $18,155,331.94 |
| DTR | Dateline Resources | 5% | 10% | -1% | 21% | 0.091 | $38,975,926.20 |
| GOR | Gold Road Res | 14% | 27% | 37% | 58% | 1.765 | $1,592,679,918.53 |
| S2R | S2 Resources | 0% | -3% | 79% | 9% | 0.175 | $62,365,599.63 |
| NES | Nelson Resources. | -8% | -12% | -50% | -77% | 0.022 | $6,474,427.61 |
| TLM | Talisman Mining | -8% | -8% | -3% | 74% | 0.165 | $30,977,017.01 |
| BEZ | Besragoldinc | 10% | -30% | 0% | 0% | 0.077 | $13,232,446.92 |
| PRU | Perseus Mining | 7% | 21% | 32% | 63% | 1.885 | $2,356,213,378.70 |
| SPQ | Superior Resources | 2% | -12% | 291% | 258% | 0.043 | $71,451,257.56 |
| PUR | Pursuit Minerals | -5% | -20% | -59% | -64% | 0.02 | $18,910,983.88 |
| RMS | Ramelius Resources | 9% | 14% | 13% | 2% | 1.6075 | $1,383,479,248.86 |
| PKO | Peako Limited | 12% | 0% | -30% | -14% | 0.019 | $4,935,265.62 |
| ICG | Inca Minerals | 5% | -5% | -17% | -9% | 0.1 | $47,158,741.50 |
| A1G | African Gold . | -3% | -19% | -31% | -10% | 0.195 | $25,076,168.88 |
| AZL | Arizona Lithium | 0% | -10% | 250% | 289% | 0.14 | $279,687,303.70 |
| OAU | Ora Gold Limited | -5% | 6% | 12% | -5% | 0.018 | $16,701,574.67 |
| GNM | Great Northern | 9% | 0% | -40% | -40% | 0.006 | $10,254,305.86 |
| KRM | Kingsrose Mining | 0% | 3% | 67% | 64% | 0.077 | $55,464,962.41 |
| BTR | Brightstar Resources | -3% | -17% | 7% | -32% | 0.03 | $15,858,965.20 |
| RRL | Regis Resources | 10% | 14% | 0% | -26% | 2.14 | $1,622,769,040.70 |
| M24 | Mamba Exploration | -3% | -22% | -14% | -36% | 0.16 | $6,326,250.45 |
| TRM | Truscott Mining Corp | 0% | 0% | -6% | 45% | 0.032 | $4,862,129.41 |
| DEX | Duke Exploration | 20% | 20% | -16% | -33% | 0.21 | $18,042,230.40 |
| DLC | Delecta Limited | 0% | 10% | 10% | 120% | 0.011 | $13,253,995.76 |
| KNB | Koonenberrygold | -7% | -30% | 0% | 0% | 0.098 | $7,454,480.20 |
| AWJ | Auric Mining | -7% | -23% | -39% | -48% | 0.085 | $4,765,895.35 |
| AZS | Azure Minerals | -3% | -11% | 7% | 21% | 0.38 | $118,079,573.98 |
| ENR | Encounter Resources | 3% | 7% | -29% | 14% | 0.155 | $45,938,439.77 |
| SNG | Siren Gold | 25% | 28% | 25% | -21% | 0.32 | $20,687,781.14 |
| STN | Saturn Metals | -5% | -8% | -3% | 3% | 0.38 | $49,555,679.16 |
| E2M | E2 Metals | 2% | -11% | -18% | -35% | 0.21 | $31,598,954.73 |
| PNM | Pacific Nickel Mines | 29% | 14% | 89% | 119% | 0.125 | $33,888,648.63 |
| AYM | Australia United Min | -14% | 0% | -45% | -33% | 0.006 | $11,055,464.91 |
| BRB | Breaker Res NL | 13% | 2% | 2% | 34% | 0.255 | $81,460,232.25 |
| ANL | Amani Gold | -25% | 50% | -25% | 0% | 0.0015 | $45,866,882.25 |
| GCY | Gascoyne Res | 21% | 37% | 13% | -34% | 0.35 | $125,932,811.48 |
| HAV | Havilah Resources | -3% | -3% | -8% | -16% | 0.18 | $57,314,250.05 |
| GCY | Gascoyne Res | 21% | 37% | 13% | -34% | 0.35 | $125,932,811.48 |
| OGC | OceanaGold Corp. | 5% | 33% | 17% | 49% | 2.87 | $201,086,391.22 |
| PNT | Panthermetals | -2% | -8% | 0% | 0% | 0.22 | $6,440,000.00 |
WEEKLY STANDOUTS
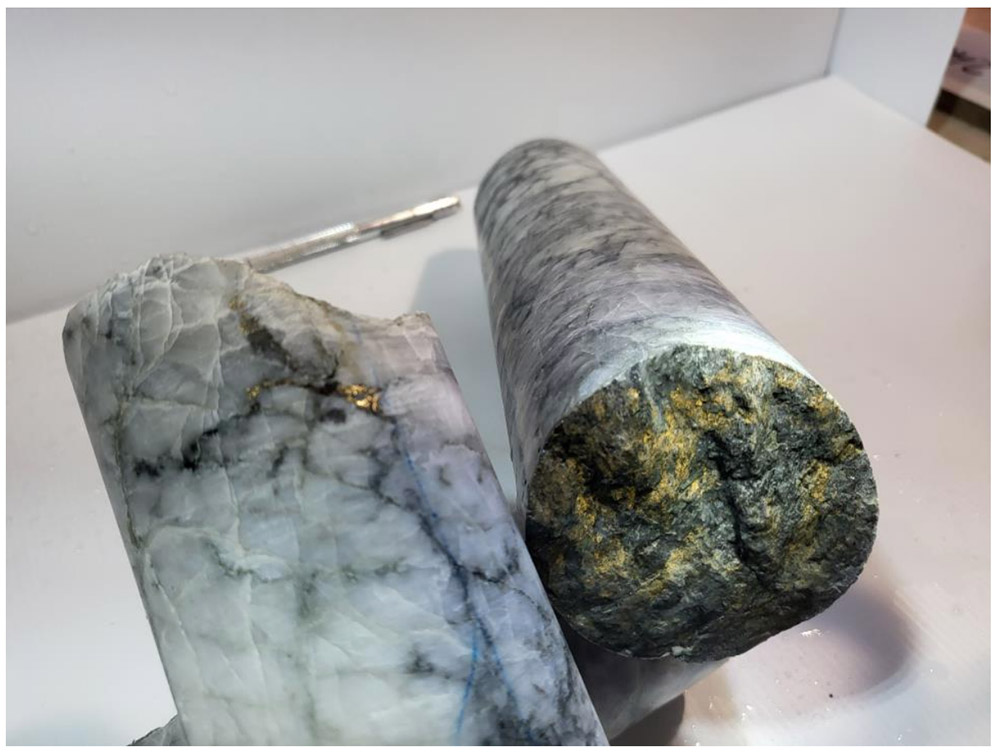
Siren Gold (ASX:SNG) has intersected significant visible gold in the deepest hole drilled to date at its ‘Alexander River’ project:
Former high-flying gold producer Kingsgate Consolidated (ASX:KCN) will receive $20m in funding to help restart the 3.2Moz gold, 30Moz silver ‘Chatree’ mine in Thailand, with the company aiming for first pour by the end of this year.
Monster mine finder De Grey (ASX:DEG) has been added to the S&P/ASX 200 Index in the latest rebalance, effective prior to the open on March 21. African producer Firefinch (ASX:FFX) will be added to the S&P/ASX 300 Index from March 22.
Stavely Minerals (ASX:SVY) hit up to 19.65% copper, 8.29g/t gold and 202g/t silver at the ‘Cayley Lode’ discovery, part of the ‘Stavely’ project in Victoria.
Another interval returned a speccy silver grade of more than 1.2kg (1,200g) per tonne.
SNG,KCN,DEG,FFX and SVY share price charts
Independent global fund manager L1 Capital increased its stake in Aussie miner St Barbara (ASX:SBM) from 10.35% to 12.18%.
SBM produced 65,523oz at $1587/oz in the December quarter, selling its gold bounty at an average margin of $836/oz with realised prices of $2423/oz. Prices have only gone up since then.
Red 5 (ASX:RED) remains on track for first gold production at its 2.4Moz, 16-year life-of-mine King of the Hills (KOTH) gold project in WA next quarter.
The $880m market cap stock is up 132% over the past 12 months.
And last – but certainly not least – comes this absolute howler from tiddler Tombola Gold (ASX:TBA):
You wish $TBA $TBA.AX, you wish pic.twitter.com/V19m35Prwl
— TwinTurboCelica (@TwinTurboCe1ica) March 9, 2022
…which was hastily corrected to 89.8 grams per tonne.
SBM,RED and TBA share price charts
Related Topics

Related Stories


UNLOCK INSIGHTS
Discover the untold stories of emerging ASX stocks.
Daily news and expert analysis, it's free to subscribe.
By proceeding, you confirm you understand that we handle personal information in accordance with our Privacy Policy.


