Gold Digger: Are ASX gold stocks good value again?
Pic: Bloomberg Creative / Bloomberg Creative Photos via Getty Images
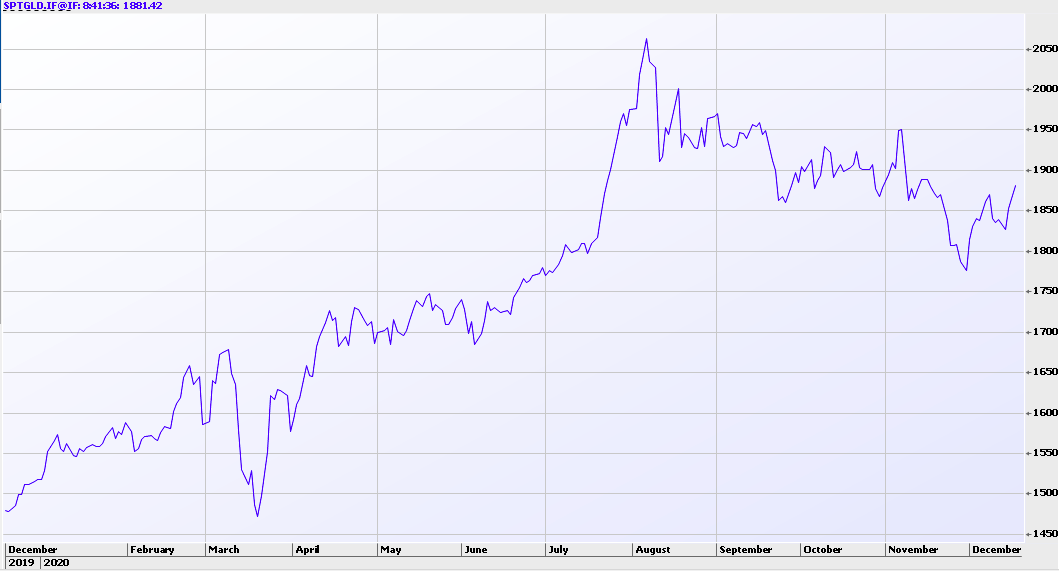
Besides the odd sharp spike or dip, spot gold has bounced between $US1800 and $US1900/oz since August.
At ~$US1885/oz currently, gold is still up 27.85 per cent in US dollar terms over the year – a fantastic return by any measure.
But after such a wild rise for gold over much of 2020, the last few months have felt almost recessionary, and it’s beginning to show in company valuations.
“Gold company share prices are continuing to erode as the gold price weakens and fails to respond to the same events that were driving the price higher earlier in the year,” writes Fast East Capital earlier this week.
“The occasional rallies have so far just given us false hope.
“As good as some of the new discoveries have been for some companies, there is no forward movement when the wind is blowing against them.”
PSA: Commsex won’t recognize your face if you’re crying. Make sure to regain your composure before logging in to panic sell. from r/ASX_Bets
But Guy le Page’s glass is half full. This is a buying opportunity, he says.
“The gold index is off 20 per cent in the last couple of months, which is not unexpected,” he says.
“As we highlighted earlier, gold was either going up or valuations were going to come down, and we saw those values come down.
“I think it’s getting into a good buying range again.”
Many analysts like Guy and Peak Asset Management’s Niv Dagan remain hot for precious metals.
“We feel that gold and silver will still be talking points – especially in the first quarter of the year as central banks remain stressed from quantitative easing,” Dagan says.
“We fell the USD will continue to fall, we feel that inflation will start to be a talking point and on the back of that we can see another run towards the US$2,200-US$2,500 level in the first quarter of next year based on those themes.”
Winners & Losers
Here’s how ASX-listed gold stocks performed December 14 – December 18 [intraday].
Scroll or swipe to reveal table. Click headings to sort. Best viewed on a laptop:
| CODE | COMPANY | 1 WEEK RETURN % | 1 MONTH RETURN % | 6 MONTH RETURN % | 1 YEAR RETURN % | PRICE [intraday Friday] | MARKET CAP |
|---|---|---|---|---|---|---|---|
| LCY | Legacy Iron Ore | 386 | 325 | 1600 | 1600 | 0.034 | $ 249,889,540.68 |
| HAW | Hawthorn Resources | 25 | 0 | -2 | 107 | 0.115 | $ 40,021,873.56 |
| RGL | Riversgold | 21 | 13 | 11 | 410 | 0.051 | $ 19,787,382.05 |
| AAJ | Aruma Resources | 17 | 17 | 75 | 75 | 0.007 | $ 11,125,897.33 |
| PRU | Perseus Mining | 15 | 8 | 16 | 34 | 1.31 | $ 1,587,743,646.65 |
| RSG | Resolute Mining | 14 | 5 | -18 | -26 | 0.84 | $ 921,750,409.51 |
| HRN | Horizon Gold | 14 | 23 | 105 | 154 | 0.5 | $ 43,021,386.03 |
| RML | Resolution Minerals | 13 | -4 | -37 | -10 | 0.043 | $ 11,737,843.24 |
| AMG | Ausmex Mining | 13 | 21 | 68 | -19 | 0.052 | $ 25,188,142.26 |
| WAF | West African Resources | 13 | 5 | 20 | 165 | 1.04 | $ 896,256,298.92 |
| GWR | GWR Group | 12 | 72 | 366 | 216 | 0.275 | $ 83,537,054.52 |
| KRM | Kingsrose Mining | 12 | 3 | 3 | 54 | 0.037 | $ 26,280,264.67 |
| DCN | Dacian Gold | 12 | 17 | -14 | -56 | 0.385 | $ 205,908,164.98 |
| WCN | White Cliff Minerals | 12 | -12 | 222 | 480 | 0.029 | $ 14,996,910.62 |
| MEG | Megado | 11 | -3 | 0 | 0 | 0.195 | $ 7,604,246.31 |
| AMI | Aurelia Metals | 11 | 5 | 3 | 16 | 0.455 | $ 506,760,405.53 |
| SVL | Silver Mines | 10 | 0 | 129 | 137 | 0.22 | $ 223,126,424.23 |
| GUL | Gullewa | 10 | -4 | 10 | 311 | 0.115 | $ 17,861,041.00 |
| CHZ | Chesser Resources | 9 | -4 | 213 | 251 | 0.235 | $ 102,276,226.78 |
| GOR | Gold Road Resources | 9 | -1 | -11 | 19 | 1.31 | $ 1,130,703,301.18 |
| MAT | Matsa Resources | 9 | 0 | -14 | 0 | 0.125 | $ 31,181,871.54 |
| TMX | Terrain Minerals | 8 | -7 | 117 | 225 | 0.013 | $ 9,564,893.12 |
| MEI | Meteoric Resources | 8 | 17 | 172 | 127 | 0.068 | $ 84,334,575.53 |
| AQX | Alice Queen | 7 | -9 | 4 | 16 | 0.029 | $ 29,466,816.36 |
| RED | Red 5 | 7 | -1 | -21 | -11 | 0.26 | $ 522,290,714.61 |
| TMZ | Thomson Resources | 7 | -13 | 320 | 325 | 0.105 | $ 31,498,829.40 |
| SLR | Silver Lake Resources | 7 | -2 | 0 | 69 | 1.89 | $ 1,666,177,345.35 |
| AL8 | Alderan Resource | 6 | 1 | -38 | 230 | 0.099 | $ 29,413,668.14 |
| FAU | First Au | 6 | -22 | 50 | 100 | 0.018 | $ 9,147,438.81 |
| HMX | Hammer Metals | 6 | -12 | 6 | 76 | 0.037 | $ 26,134,302.95 |
| MDI | Middle Island Resources | 6 | -19 | -19 | 143 | 0.28 | $ 31,520,764.34 |
| SBR | Sabre Resources | 6 | -14 | 217 | 217 | 0.0095 | $ 15,147,572.84 |
| SIH | Sihayo Gold | 6 | -14 | -6 | 31 | 0.019 | $ 65,883,249.78 |
| RMS | Ramelius Resources | 6 | -6 | -4 | 80 | 1.72 | $ 1,387,464,611.19 |
| WGX | Westgold Resources | 5 | 12 | 32 | 36 | 2.7 | $ 1,182,556,203.30 |
| OBM | Ora Banda Mining | 5 | -11 | 11 | 83 | 0.29 | $ 235,822,147.96 |
| RRL | Regis Resources | 5 | 0 | -25 | -7 | 3.87 | $ 1,920,101,546.25 |
| EMR | Emerald Resources | 5 | 12 | 42 | 74 | 0.68 | $ 353,047,086.80 |
| SAR | Saracen | 5 | -10 | 5 | 63 | 4.83 | $ 5,183,740,776.24 |
| CMM | Capricorn Metals | 5 | 2 | 7 | 45 | 1.72 | $ 570,998,179.62 |
| NST | Northern Star | 5 | -11 | -3 | 33 | 12.87 | $ 9,313,894,514.61 |
| SSR | SSR Mining | 5 | -1 | 0 | 0 | 26.09 | $ 441,008,366.40 |
| PNR | Pantoro | 5 | 21 | 15 | 59 | 0.23 | $ 323,931,592.44 |
| KCN | Kingsgate Consolidated | 4 | 12 | 119 | 106 | 0.845 | $ 193,423,178.70 |
| EVN | Evolution Mining | 4 | -11 | -5 | 44 | 5.08 | $ 8,389,555,387.35 |
| AWV | Anova Metals | 4 | -4 | 17 | 156 | 0.027 | $ 35,827,355.00 |
| MVL | Marvel Gold | 4 | -11 | 127 | -41 | 0.055 | $ 27,975,423.19 |
| AGG | AngloGold Ashanti | 3 | -6 | -15 | 1 | 6.1 | $ 533,462,434.70 |
| FFR | Firefly Resources | 3 | -23 | 382 | 282 | 0.165 | $ 47,966,325.12 |
| KWR | Kingwest Resources | 3 | -11 | 25 | -13 | 0.165 | $ 24,591,017.28 |
| AGS | Alliance Resources | 3 | -7 | 22 | 80 | 0.175 | $ 29,419,513.20 |
| GSN | Great Southern | 3 | -18 | -26 | 1 | 0.07 | $ 31,847,929.40 |
| GIB | Gibb River Diamonds | 3 | 9 | 350 | 567 | 0.18 | $ 35,956,605.65 |
| BDC | Bardoc Gold | 3 | -1 | -7 | 1 | 0.075 | $ 122,912,173.70 |
| NML | Navarre Minerals | 3 | -22 | 48 | 90 | 0.2 | $ 103,577,008.69 |
| SKY | SKY Metals | 3 | -9 | -23 | 133 | 0.205 | $ 50,563,214.74 |
| OKR | Okapi Resources | 2 | 5 | 31 | 56 | 0.21 | $ 7,569,001.86 |
| CEL | Challenger Exploration | 2 | 5 | -6 | 175 | 0.22 | $ 116,009,707.59 |
| CLA | Celsius Resources | 2 | 22 | 275 | 309 | 0.045 | $ 35,890,031.73 |
| NSM | North Stawell | 2 | 2 | 0 | 0 | 0.465 | $ 18,800,000.00 |
| G88 | Golden Mile Resources | 2 | -7 | 28 | 14 | 0.05 | $ 6,150,916.40 |
| RXL | Rox Resources | 2 | -6 | 13 | 168 | 0.051 | $ 104,541,251.61 |
| RVR | Red River Resources | 2 | -7 | 247 | 93 | 0.26 | $ 129,443,591.75 |
| BRV | Big River Gold | 2 | 2 | 83 | 253 | 0.053 | $ 82,932,185.99 |
| BBX | BBX Minerals | 2 | -15 | 155 | 75 | 0.28 | $ 119,514,274.04 |
| PDI | Predictive Discovery | 2 | -16 | -27 | 622 | 0.057 | $ 55,258,500.72 |
| DGO | DGO Gold | 2 | -4 | 8 | 236 | 2.94 | $ 205,950,669.12 |
| BYH | Bryah Resources | 2 | -10 | 35 | 65 | 0.066 | $ 10,133,673.53 |
| DEG | De Grey Mining | 1 | -7 | 84 | 2286 | 1.05 | $ 1,355,119,964.66 |
| MML | Medusa Mining | 1 | -4 | 18 | 14 | 0.78 | $ 163,118,526.29 |
| MAU | Magnetic Resources | 1 | 5 | 3 | 135 | 1.2 | $ 259,405,652.40 |
| BNR | Bulletin Resources | 1 | 12 | -6 | 219 | 0.083 | $ 14,881,325.14 |
| NCM | Newcrest Mining | 1 | -5 | -10 | -3 | 27.41 | $ 22,112,350,940.72 |
| AUT | Auteco Minerals | 1 | -10 | 74 | 1138 | 0.099 | $ 152,016,356.79 |
| SBM | St Barbara | 1 | -5 | -18 | 1 | 2.49 | $ 1,749,288,122.72 |
| SVY | Stavely Minerals | 1 | -2 | 28 | -3 | 0.86 | $ 227,036,463.24 |
| DDD | 3D Resources | 0 | -25 | 80 | 200 | 0.0045 | $ 14,461,488.37 |
| AQI | Alicanto Minerals | 0 | -17 | 100 | 179 | 0.12 | $ 37,595,508.02 |
| ALK | Alkane Resources | 0 | -2 | 11 | 82 | 0.99 | $ 583,481,024.00 |
| ANL | Amani Gold | 0 | -33 | 0 | -50 | 0.001 | $ 9,386,996.75 |
| AUC | Ausgold Limited | 0 | -25 | 137 | 275 | 0.045 | $ 55,915,030.26 |
| AYM | Australia United Mining | 0 | 0 | 350 | 125 | 0.009 | $ 16,583,197.37 |
| BRB | Breaker Resources | 0 | 5 | -25 | -30 | 0.195 | $ 63,538,981.16 |
| CBY | Canterbury Resources | 0 | 0 | 0 | -48 | 0.105 | $ 9,681,649.45 |
| CDV | Cardinal Resources | 0 | 5 | 123 | 263 | 1.07 | $ 595,410,904.68 |
| CDT | Castle Minerals | 0 | -31 | 0 | 0 | 0.009 | $ 6,592,507.36 |
| CTO | Citigold Corp | 0 | -13 | 160 | 225 | 0.013 | $ 32,108,078.51 |
| CY5 | Cygnus Gold | 0 | -5 | 131 | 350 | 0.18 | $ 19,452,617.64 |
| DTR | Dateline Resources | 0 | 0 | 0 | 0 | 0.002 | $ 16,420,156.15 |
| DCX | Discovex Resources | 0 | 17 | 27 | 17 | 0.007 | $ 8,373,148.53 |
| DRE | Dreadnought Resources | 0 | -15 | 340 | 214 | 0.022 | $ 49,760,643.70 |
| GMR | Golden Rim Resources | 0 | -23 | 43 | 0 | 0.01 | $ 17,913,418.71 |
| HWK | Hawkstone Mining | 0 | -9 | 43 | 67 | 0.01 | $ 15,115,735.42 |
| KAU | Kaiser Reef | 0 | 0 | 55 | 0 | 0.41 | $ 10,957,250.41 |
| KGM | Kalnorth Gold | 0 | 0 | 86 | 225 | 0.013 | $ 11,625,120.78 |
| LNY | Laneway Resources | 0 | -13 | 56 | 0 | 0.007 | $ 26,425,461.53 |
| MSR | Manas Resources | 0 | -14 | 20 | 200 | 0.006 | $ 16,561,641.59 |
| MHC | Manhattan Corp | 0 | -15 | 115 | 460 | 0.028 | $ 37,135,803.40 |
| MCT | Metalicity | 0 | -10 | 50 | 493 | 0.018 | $ 29,615,765.47 |
| MLS | Metals Australia | 0 | -25 | -25 | 50 | 0.0015 | $ 6,286,355.36 |
| MTC | Metalstech | 0 | 14 | 50 | 500 | 0.21 | $ 30,046,365.79 |
| MTH | Mithril Resources | 0 | -27 | 27 | 138 | 0.019 | $ 37,567,352.63 |
| MRZ | Mont Royal Resources | 0 | -9 | 76 | 9 | 0.3 | $ 9,907,329.00 |
| NPM | Newpeak Metals | 0 | 0 | 50 | 0 | 0.003 | $ 14,004,487.53 |
| PKO | Peako Limited | 0 | -11 | 106 | 12 | 0.025 | $ 4,609,300.25 |
| RMX | Red Mountain Mining | 0 | -14 | 200 | 140 | 0.012 | $ 13,575,869.87 |
| SFM | Santa Fe Minerals | 0 | -22 | 57 | 34 | 0.094 | $ 6,844,966.17 |
| SAU | Southern Gold | 0 | 0 | -19 | -35 | 0.11 | $ 21,332,875.60 |
| TAR | Taruga Minerals | 0 | 2 | 144 | 238 | 0.044 | $ 19,202,463.25 |
| TRM | Truscott Mining | 0 | -18 | 29 | 125 | 0.018 | $ 2,302,947.79 |
| TSC | Twenty Seven Co. | 0 | -14 | 20 | 50 | 0.006 | $ 10,598,271.07 |
| VRC | Volt Resources | 0 | 22 | -42 | 10 | 0.011 | $ 23,791,109.11 |
| WSR | Westar Resources | 0 | -6 | -6 | -6 | 0 | $ 11,840,000.00 |
| BC8 | Black Cat Syndicate | -1 | -10 | 6 | 125 | 0.675 | $ 70,064,418.55 |
| E2M | E2 Metals | -1 | -24 | 371 | 267 | 0.66 | $ 98,774,547.96 |
| AME | Alto Metals | -1 | -15 | 27 | 185 | 0.094 | $ 38,194,449.02 |
| ERM | Emmerson Resources | -1 | -7 | -27 | -38 | 0.077 | $ 36,696,894.42 |
| FML | Focus Minerals | -1 | -13 | 40 | 47 | 0.33 | $ 60,307,026.45 |
| GRL | Godolphin Resources | -2 | 2 | 46 | 0 | 0.255 | $ 19,940,913.50 |
| REZ | Resource & Energy | -2 | -26 | 206 | 88 | 0.049 | $ 19,857,316.29 |
| ARL | Ardea Resources | -2 | -10 | 56 | -28 | 0.43 | $ 54,898,350.26 |
| OKU | Oklo Resources | -2 | -7 | -20 | 54 | 0.215 | $ 103,326,111.46 |
| GMN | Gold Mountain | -2 | -7 | -18 | -45 | 0.04 | $ 29,871,432.07 |
| LEX | Lefroy Exploration | -3 | -17 | -5 | -5 | 0.19 | $ 23,263,759.94 |
| BCN | Beacon Minerals | -3 | 0 | 0 | 0 | 0.037 | $ 106,071,861.81 |
| CXU | Cauldron Energy | -3 | -18 | 54 | 106 | 0.037 | $ 16,127,982.43 |
| ENR | Encounter Resources | -3 | -5 | 17 | 30 | 0.175 | $ 51,807,484.58 |
| TBR | Tribune Resources | -3 | -12 | -10 | -5 | 5.82 | $ 304,314,846.60 |
| WMX | Wiluna Mining Corp | -3 | -14 | 16 | 29 | 1.48 | $ 172,046,643.36 |
| RND | Rand Mining | -3 | -15 | -10 | -23 | 1.8 | $ 108,267,255.00 |
| MZZ | Matador Mining | -3 | -15 | 23 | 33 | 0.32 | $ 57,023,284.27 |
| NVA | Nova Minerals | -3 | -11 | 181 | 332 | 0.16 | $ 258,841,730.29 |
| CYL | Catalyst Metals | -3 | -12 | -11 | -13 | 2.48 | $ 206,831,251.04 |
| NWM | Norwest Minerals | -3 | -13 | -39 | -45 | 0.091 | $ 9,904,456.29 |
| GML | Gateway Mining | -3 | 67 | 131 | 100 | 0.03 | $ 53,374,749.01 |
| RDN | Raiden Resources | -3 | -9 | 500 | 329 | 0.03 | $ 24,729,552.25 |
| TRY | Troy Resources | -3 | -11 | 3 | -19 | 0.089 | $ 66,621,611.58 |
| WWI | West Wits Mining | -3 | -33 | 460 | 600 | 0.056 | $ 66,888,504.10 |
| ARN | Aldoro Resources | -4 | -4 | 88 | -7 | 0.135 | $ 8,961,408.41 |
| AAR | Anglo Australian | -4 | -13 | 4 | 59 | 0.135 | $ 78,043,610.88 |
| NXM | Nexus Minerals | -4 | -18 | 181 | 193 | 0.135 | $ 30,518,958.88 |
| ZNC | Zenith Minerals | -4 | 0 | 17 | 165 | 0.135 | $ 38,266,803.90 |
| CWX | Carawine Resources | -4 | -21 | 41 | 14 | 0.24 | $ 26,133,576.48 |
| LCL | Los Cerros | -4 | -26 | 174 | 10 | 0.096 | $ 45,915,893.16 |
| PRX | Prodigy Gold | -4 | -13 | 2 | -33 | 0.046 | $ 26,128,242.27 |
| TTM | Titan Minerals | -4 | 0 | 83 | -36 | 0.115 | $ 128,245,345.57 |
| SLZ | Sultan Resources | -4 | -6 | 73 | 241 | 0.225 | $ 15,992,909.47 |
| KTA | Krakatoa Resources | -4 | -8 | 83 | 65 | 0.066 | $ 18,410,700.00 |
| STN | Saturn Metals | -4 | -12 | 29 | 115 | 0.645 | $ 69,417,286.40 |
| OAU | Ora Gold | -5 | -19 | 50 | -5 | 0.021 | $ 17,657,749.66 |
| PAK | Pacific American | -5 | -13 | 110 | -21 | 0.021 | $ 7,550,037.60 |
| AZS | Azure Minerals | -5 | -13 | 893 | 496 | 0.715 | $ 210,419,221.16 |
| PUR | Pursuit Minerals | -5 | 43 | 329 | 258 | 0.02 | $ 13,975,898.84 |
| NUS | Nusantara Resources | -5 | 0 | -12 | -8 | 0.295 | $ 67,635,537.07 |
| FFX | Firefinch | -5 | -5 | 44 | 110 | 0.14 | $ 109,467,015.14 |
| TLM | Talisman Mining | -5 | -21 | -34 | 4 | 0.095 | $ 18,289,581.73 |
| KAI | Kairos Minerals | -5 | -16 | 47 | 296 | 0.037 | $ 60,322,511.41 |
| ADN | Andromeda Metals | -5 | 0 | 429 | 511 | 0.275 | $ 538,181,956.75 |
| AAU | Antilles Gold | -5 | -15 | 28 | 83 | 0.055 | $ 11,123,073.99 |
| CAI | Calidus Resources | -5 | -15 | 17 | 123 | 0.5 | $ 166,162,379.63 |
| KZR | Kalamazoo Resources | -5 | -15 | 10 | 100 | 0.53 | $ 69,398,960.02 |
| AXE | Archer Materials | -5 | -5 | -12 | 289 | 0.525 | $ 118,196,686.65 |
| SMI | Santana Minerals | -6 | -15 | 21 | -39 | 0.17 | $ 22,236,364.02 |
| M2R | Miramar | -6 | -10 | 0 | 0 | 0.31 | $ 13,090,531.20 |
| VKA | Viking Mines | -6 | 70 | 411 | 198 | 0.031 | $ 10,823,266.02 |
| AOP | Apollo Consolidated | -6 | -9 | 9 | 30 | 0.3 | $ 80,728,677.00 |
| GBR | Great Boulder Resources | -6 | -10 | 80 | 23 | 0.045 | $ 8,462,689.65 |
| PRS | Prospech | -6 | 0 | 0 | 0 | 0.22 | $ 13,654,323.69 |
| PUA | Peak Minerals | -6 | 16 | 53 | 103 | 0.029 | $ 16,431,011.88 |
| TNR | Torian Resources | -7 | -18 | -9 | 181 | 0.027 | $ 21,598,911.80 |
| NAG | Nagambie Resources | -7 | -15 | -26 | -11 | 0.04 | $ 19,997,293.84 |
| TIE | Tietto Minerals | -7 | -5 | 3 | 51 | 0.4 | $ 178,662,630.12 |
| GBZ | GBM Resources | -7 | -26 | 103 | 279 | 0.13 | $ 50,331,314.25 |
| GSM | Golden State Mining | -8 | -20 | -38 | 153 | 0.185 | $ 9,911,335.00 |
| RDS | Redstone Resources | -8 | -8 | 71 | 33 | 0.012 | $ 6,271,560.19 |
| TAM | Tanami Gold | -8 | -6 | 22 | 100 | 0.072 | $ 84,606,987.31 |
| CGN | Crater Gold Mining | -8 | -30 | 75 | 25 | 0.0175 | $ 20,867,429.74 |
| ONX | Orminex | -8 | -4 | -43 | -69 | 0.023 | $ 12,399,349.86 |
| GTR | GTI Resources | -8 | 10 | -19 | 175 | 0.022 | $ 14,179,395.96 |
| KSN | Kingston Resources | -8 | 10 | 90 | 72 | 0.275 | $ 60,072,799.02 |
| MKG | Mako Gold | -8 | 5 | 49 | 57 | 0.11 | $ 28,296,576.22 |
| NAE | New Age Exploration | -8 | -21 | 100 | 175 | 0.011 | $ 13,057,334.51 |
| MEU | Marmota | -9 | -7 | -28 | 95 | 0.043 | $ 42,615,482.36 |
| HRZ | Horizon | -9 | -9 | 5 | 19 | 0.105 | $ 56,797,520.00 |
| VMC | Venus Metals | -9 | -9 | -7 | 11 | 0.21 | $ 31,726,523.43 |
| ERW | Errawarra Resources | -9 | -14 | -14 | -14 | 0 | $ 8,000,000.00 |
| A1G | African Gold | -9 | 37 | 108 | 22 | 0.205 | $ 8,275,201.79 |
| TSO | Tesoro Resources | -9 | -24 | 275 | 527 | 0.255 | $ 121,686,559.50 |
| BGL | Bellevue Gold | -9 | -9 | 29 | 137 | 1.22 | $ 1,115,068,689.63 |
| BAT | Battery Minerals | -10 | -21 | 217 | 192 | 0.019 | $ 40,149,107.98 |
| CAZ | Cazaly Resources | -10 | -2 | 59 | 119 | 0.046 | $ 16,952,583.55 |
| MOH | Moho Resources | -10 | -22 | 27 | 80 | 0.09 | $ 7,119,920.92 |
| DTM | Dart Mining | -10 | -5 | 64 | 81 | 0.175 | $ 16,990,730.92 |
| PNM | Pacific Nickel Mines | -10 | -10 | 73 | -48 | 0.052 | $ 7,205,878.58 |
| HXG | Hexagon Energy | -10 | 7 | -6 | -12 | 0.06 | $ 17,546,003.82 |
| CHN | Chalice Mining | -11 | 13 | 327 | 1640 | 3.74 | $ 1,270,218,792.72 |
| NES | Nelson Resources | -11 | -3 | 67 | 36 | 0.07 | $ 7,462,139.23 |
| ALY | Alchemy Resources | -12 | -17 | -15 | 18 | 0.015 | $ 10,083,651.80 |
| ADV | Ardiden | -12 | -40 | 275 | 400 | 0.015 | $ 29,722,866.38 |
| AVW | Avira Resources | -13 | -22 | 133 | 250 | 0.007 | $ 9,625,280.00 |
| SNG | Siren Gold | -13 | 31 | 0 | 0 | 0.71 | $ 42,548,173.20 |
| EMU | EMU NL | -13 | -30 | 122 | -18 | 0.04 | $ 12,726,195.70 |
| GNM | Great Northern | -13 | -24 | 8 | 30 | 0.013 | $ 11,802,954.85 |
| MGV | Musgrave Minerals | -14 | -17 | -17 | 318 | 0.37 | $ 181,485,068.30 |
| GED | Golden Deeps | -14 | -20 | 71 | -52 | 0.012 | $ 9,295,360.14 |
| DAU | Dampier Gold | -15 | -21 | 73 | 271 | 0.052 | $ 17,786,197.78 |
| ARV | Artemis Resources | -15 | -15 | 195 | 379 | 0.115 | $ 125,044,074.87 |
| MKR | Manuka Resources | -15 | -21 | 0 | 0 | 0.37 | $ 27,898,017.07 |
| CST | Castile Resources | -16 | -19 | 84 | 0 | 0.23 | $ 46,931,878.44 |
| SPQ | Superior Resources | -18 | -13 | 180 | 199 | 0.014 | $ 16,672,657.15 |
| YRL | Yandal Resources | -18 | -25 | 23 | 63 | 0.37 | $ 33,905,047.47 |
| VAN | Vango Mining | -19 | -18 | -40 | -61 | 0.063 | $ 63,919,201.32 |
| XTC | Xantippe Resources | -20 | 0 | -20 | 0 | 0.002 | $ 10,186,411.01 |
| STK | Strickland Metals | -20 | -61 | 160 | 95 | 0.039 | $ 16,846,060.84 |
| BAR | Barra Resources | -21 | -43 | 35 | 0 | 0.023 | $ 15,584,986.32 |
| THR | Thor Mining | -22 | -33 | 115 | 75 | 0.014 | $ 6,220,078.70 |
| S2R | S2 Resources | -28 | -54 | 33 | 30 | 0.13 | $ 39,361,397.38 |
| ANX | Anax Metals | -28 | -8 | 118 | 360 | 0.046 | $ 12,765,295.60 |
| SRN | Surefire Resources | -34 | -9 | 625 | 867 | 0.029 | $ 26,677,979.05 |
| SI6 | SI6 Metals | -42 | 127 | 733 | 525 | 0.025 | $ 30,887,942.10 |
Small Cap Standouts
LEGACY IRON ORE (+414%) and HAWTHORN RESOURCES (+25%)
Legacy Iron Ore (ASX:LCY) and Mt Bevan joint venture project partner Hawthorn Resources (ASX:HAW) have been on a tear this week (except for Friday, when some investors booked gains).
Mt Bevan is an iron ore project which has been languishing in the basement of their respective portfolios for years.
Both juniors are now ostensibly gold-focused, but with iron ore prices hitting record highs punters may be speculating that the explorers will dust off the WA project, which – besides a large, low grade magnetite resource – includes a decent chunk of Jupiter Mines’ (ASX:JMS) neighbouring high grade Mt Bevan deposit.
Legacy (ASX:LCY) and Hawthorn (ASX:HAW) share price chart:
RIVERSGOLD (+21%)
The Tolga Kumova backed junior is drilling the Cutler prospect where there appears to be two, high grade gold shoots “not closed off by previous drilling”.
Holes will be punched in to chase extensions to previous drill intercepts like 10m at 11g/t gold.
Riversgold (ASX:RGL) exec director Xavier Braud say this campaign was a bit ‘spur of the moment’.
“We have been very reactive when we heard of availability of a rig at short notice,” he says.
“We had all we needed — targets, drill permits, a team ready to go and a rig became available.
“This is the first drilling program in over 18 months for RGL and we are very excited to finally have the company back on track exploring it’s amazing Kurnalpi project.”
Riversgold (ASX:RGL) share price chart:
PERSEUS MINING (+15%)
Despite COVID, Perseus Mining (ASX:PRU) has successfully poured first gold at its $US265m Yaouré gold mine in Côte d’Ivoire five weeks ahead of schedule.
What an effort.
Perseus expects to achieve commercial production in the March 2021 quarter, when the first gold shipment from Yaouré is also expected to occur.
Perseus – which now owns and operate three gold mines in two West African countries – is on track to produce more than 500,000 ounces of gold per year.
Perseus (ASX:PRU) share price chart:
Related Topics

Related Stories


UNLOCK INSIGHTS
Discover the untold stories of emerging ASX stocks.
Daily news and expert analysis, it's free to subscribe.
By proceeding, you confirm you understand that we handle personal information in accordance with our Privacy Policy.


