Gold Digger: An investment in the ASX’s Gold Index one year ago would’ve netted a 40pc return, against just 6pc in the ASX 200
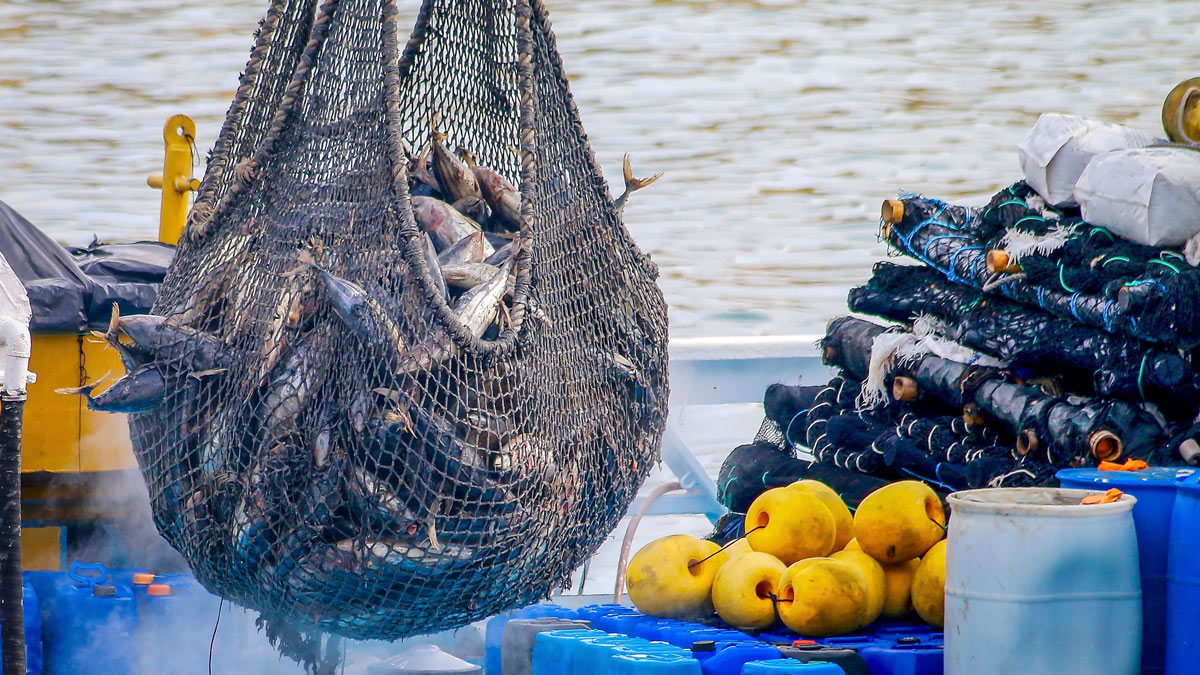
Pic: photography by p. lubas, Moment/ Via getty Images
- The All Ordinaries Gold Sub-Index (comprising 24 gold stocks) is up 15.44% YTD, a massive 40.1% over the past 12 months, and 27% over the past 5 years
- Gold miners begin rolling out FY23 results
- Standout small caps of the week: Titan Minerals, Iceni Gold
Our Gold Digger column wraps all the news driving ASX stocks with exposure to precious metals.
Gold continues to slide, extending the downtrend that started in May after the market peaked at US$2030/oz.
Despite that 5% correction to ~US$1916/oz currently, gold is still up 8% over the last 12 months, and 51% over the last 5 years.
That is reflected in the All Ordinaries Gold Sub-Index (comprising 23 ASX gold stocks, and one from the TSX) which is up 15.44% YTD, a massive 40.1% over the past 12 months, and 27% over the past 5 years.
That compares very favourably against the All Ords, which is up 1.7% (YTD), 6.1% (12 month), and 14.2% (5 years). The ASX 200 is up 1.5%, 6% and 12.5% over the same periods.
Here’s a chart showing All Ordinaries Gold Sub-Index outperformance over time:
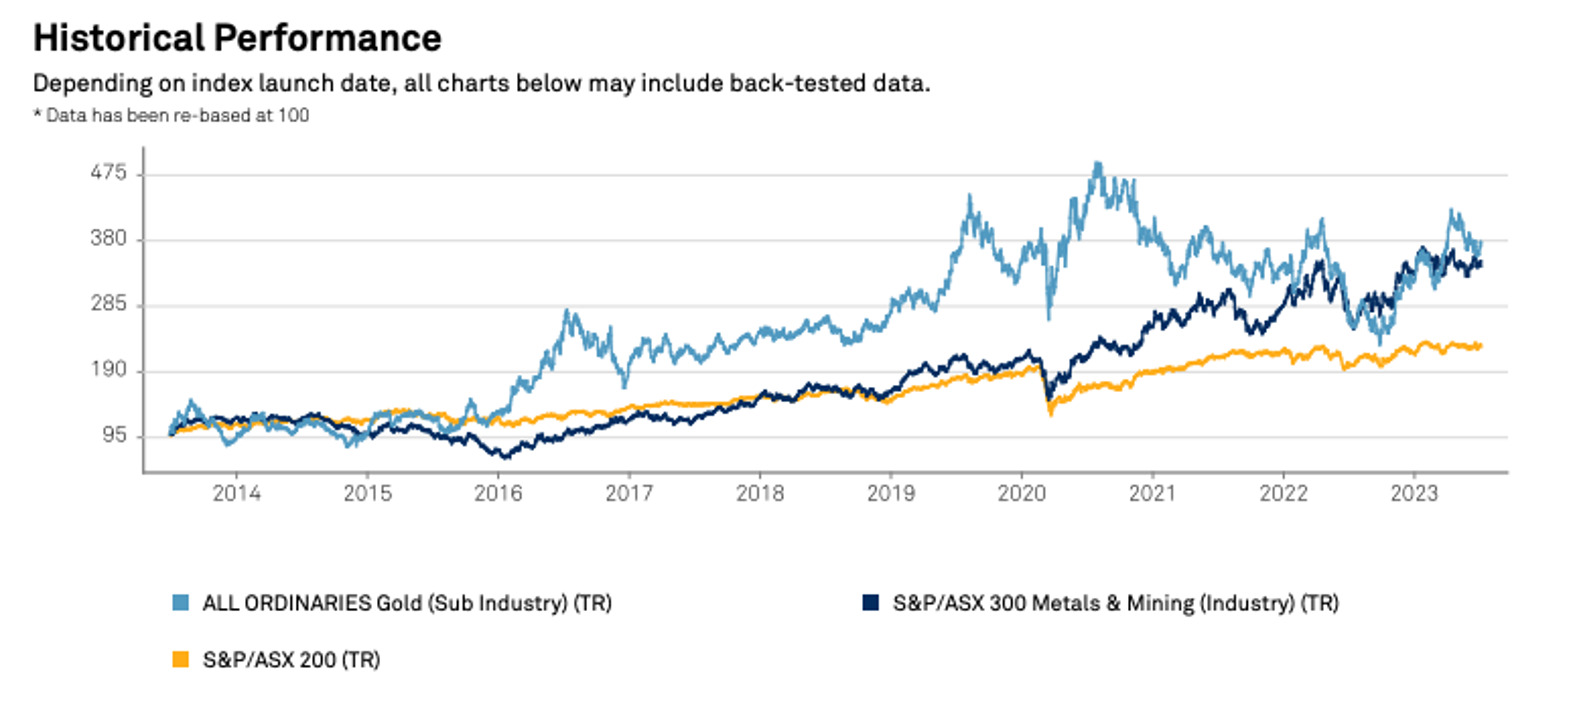
With gold expected to be well supported for the rest of 2023 it’s probably not too late to jump on board.
READ: The three ASX gold miners Goldman Sachs sees at the top of the class
How did the gold miners perform this week?
The was a bunch of big news stories from the big boys, which began rolling out production figures for FY23.
Regis Resources (ASX:RRL) led with a record gold production result for FY23.
It pulled 458,000oz out of the Duketon operations in WA and its 30% share of the Tropicana JV, which comes in around the lower end of its 450,000-500,000oz guidance range.
Cash is up $39m as well.
Towards the upper end of guidance was Westgold Resources (ASX:WGX), which delivered 257,116oz at costs anticipated to be in the middle of its $1900-2100/oz AISC range.
Westgold finished FY23 with $192m in the bank after a $24m cash build in the June quarter, up from $190m a year earlier.
A record sales result of 83,540oz powered Silver Lake (ASX:SLR) to a 3% year on year lift in sold ounces to 260,370oz for FY23.
All in sustaining costs are also expected to drop, falling to the lowest level of the year to help SLR hit its $1950-2050/oz guidance range for the year.
That translated to a cash build from $268m to $331m, with the Mt Monger and Deflector operations the standouts.
Consistent performer Alkane Resources (ASX:ALK) meanwhile delivered 70,253oz from its Tomingley mine in NSW for FY23, towards the upper end of its upgraded 65,000-73,000oz guidance range.
It expects costs in the middle of its $1550-1650/oz range.
The company, which is also the owner of the large Boda porphyry discovery in the Lachlan Fold Belt, finished the quarter with $107.2m of cash, bullion and listed investments.
READ: ASX gold miners putting meat on the bone with guidance hits
RRL, WGX, SLR, ALK share price charts
The up and comers
Tietto Minerals (ASX:TIE) shares rose as the freshly minted miner announced it had produced 15,592oz of gold at its new Abujar mine in Cote d’Ivoire, hitting commercial production in the June quarter.
The mine is forecast to ramp up to 105,000-120,000oz at all in sustaining costs of between US$875-975/oz for the second half of 2023.
In WA, Calidus Resources (ASX:CAI) announced it had hit the lower end of six-month guidance for the Warrawoona mine in the Pilbara.
Calidus turned out 31,364oz for the second half of FY23 at an expected $2000-2250/oz AISC.
Red 5 (ASX:RED) has ironed out some of the kinks at King of the Hills, generating 61,705oz for the three months to June 30 and 102,572oz for the half year, towards the top end of its half-year guidance of 90,000-105,000oz.
RED expects all in sustaining costs to be within its $1750-1950/oz guidance range when it reports its financials on July 27.
And fellow fledgling miner Bellevue Gold (ASX:BGL) reported it had a pathway to early cashflows.
Having recently acquired the Gwalia gold mine from St Barbara (ASX:SBM), Finlayson’s Genesis Minerals (ASX:GMD) will use the underfed mill to process around 100,000t of dirt grading 3g/t from Bellevue’s Vanguard open pit.
It will come ahead of the commissioning of Bellevue’s own plant onsite in the December quarter.
TIE, CAI, RED, BGL share price charts
Winners & Losers
Here’s how the ASX-listed precious metals stocks are performing this week:
Scroll or swipe to reveal table. Click headings to sort. Best viewed on a laptop.
Stocks missing from this list? Email [email protected]
| CODE | COMPANY | 1 WEEK RETURN % | 1 MONTH RETURN % | YTD RETURN % | 12 MONTH RETURN % | PRICE | MARKET CAP |
|---|---|---|---|---|---|---|---|
| TMB | Tambourahmetals | 150% | 145% | 133% | 81% | 0.245 | $5,972,927 |
| ARL | Ardea Resources Ltd | 95% | 69% | -12% | -19% | 0.625 | $122,904,762 |
| GED | Golden Deeps | 83% | 83% | 22% | -15% | 0.011 | $8,086,587 |
| KAI | Kairos Minerals Ltd | 80% | 91% | 41% | 55% | 0.0295 | $61,154,618 |
| KTA | Krakatoa Resources | 71% | 78% | -7% | -15% | 0.041 | $14,898,440 |
| GMN | Gold Mountain Ltd | 63% | 225% | 86% | 160% | 0.013 | $17,729,394 |
| TTM | Titan Minerals | 52% | 37% | 0% | 10% | 0.067 | $101,611,669 |
| SBR | Sabre Resources | 52% | 86% | 8% | 3% | 0.041 | $12,533,906 |
| ICL | Iceni Gold | 41% | 43% | 25% | 1% | 0.1 | $19,605,714 |
| SBM | St Barbara Limited | 40% | 17% | -16% | -20% | 0.2825 | $237,174,077 |
| ASR | Asra Minerals Ltd | 38% | 22% | -45% | -62% | 0.011 | $15,844,258 |
| MVL | Marvel Gold Limited | 36% | 25% | -42% | -46% | 0.015 | $12,956,861 |
| ARV | Artemis Resources | 36% | 58% | -24% | -32% | 0.019 | $21,978,857 |
| PUA | Peak Minerals Ltd | 33% | 33% | -33% | -64% | 0.004 | $4,165,506 |
| CWX | Carawine Resources | 33% | 40% | 40% | 63% | 0.14 | $27,554,446 |
| MCT | Metalicity Limited | 33% | 33% | -33% | -33% | 0.002 | $7,472,172 |
| VMC | Venus Metals Cor Ltd | 31% | 28% | 85% | 47% | 0.145 | $22,535,721 |
| VKA | Viking Mines Ltd | 30% | 44% | 30% | 86% | 0.013 | $13,328,360 |
| S2R | S2 Resources | 29% | 29% | -9% | 19% | 0.155 | $65,614,644 |
| NMR | Native Mineral Res | 29% | 16% | -67% | -77% | 0.036 | $5,290,735 |
| AM7 | Arcadia Minerals | 29% | -21% | -34% | -16% | 0.135 | $12,226,513 |
| BAT | Battery Minerals Ltd | 29% | 50% | 13% | -25% | 0.135 | $15,438,084 |
| NVA | Nova Minerals Ltd | 26% | 8% | -51% | -52% | 0.335 | $74,865,936 |
| PNX | PNX Metals Limited | 25% | -17% | -41% | -41% | 0.0025 | $13,451,562 |
| BMR | Ballymore Resources | 25% | 7% | 0% | -12% | 0.15 | $14,447,618 |
| GMR | Golden Rim Resources | 25% | 13% | 13% | -48% | 0.035 | $20,114,005 |
| CTO | Citigold Corp Ltd | 25% | 11% | -17% | 0% | 0.005 | $14,368,295 |
| CY5 | Cygnus Metals Ltd | 25% | 46% | -21% | 100% | 0.3 | $66,981,161 |
| XTC | Xantippe Res Ltd | 25% | -17% | -50% | -69% | 0.0025 | $22,960,199 |
| OAU | Ora Gold Limited | 25% | 67% | 0% | 0% | 0.005 | $23,621,551 |
| SNG | Siren Gold | 25% | -10% | -51% | -67% | 0.09 | $11,113,089 |
| NXM | Nexus Minerals Ltd | 25% | 0% | -65% | -65% | 0.071 | $23,107,185 |
| ARN | Aldoro Resources | 24% | 8% | -19% | -16% | 0.13 | $16,130,849 |
| LCL | LCL Resources Ltd | 23% | -3% | -35% | 34% | 0.037 | $30,183,569 |
| RGL | Riversgold | 23% | 7% | -47% | -45% | 0.016 | $15,220,183 |
| EMC | Everest Metals Corp | 23% | 105% | 172% | 146% | 0.215 | $27,180,953 |
| GML | Gateway Mining | 23% | -2% | -28% | -52% | 0.043 | $11,985,009 |
| LYN | Lycaonresources | 23% | 23% | -2% | 4% | 0.27 | $8,888,063 |
| MEI | Meteoric Resources | 23% | -4% | 362% | 2127% | 0.245 | $446,536,925 |
| ICG | Inca Minerals Ltd | 22% | -8% | -4% | -75% | 0.022 | $10,670,220 |
| GSR | Greenstone Resources | 21% | -6% | -47% | -61% | 0.017 | $21,943,123 |
| KIN | KIN Min NL | 21% | 0% | -46% | -55% | 0.035 | $38,878,968 |
| FAU | First Au Ltd | 20% | -14% | -25% | -73% | 0.003 | $4,355,980 |
| EM2 | Eagle Mountain | 20% | 9% | -29% | -43% | 0.12 | $38,120,858 |
| MKR | Manuka Resources. | 20% | 8% | -29% | -66% | 0.06 | $35,697,424 |
| SI6 | SI6 Metals Limited | 20% | 0% | 0% | -14% | 0.006 | $8,972,368 |
| NES | Nelson Resources. | 20% | 20% | -14% | -41% | 0.006 | $3,681,566 |
| GWR | GWR Group Ltd | 19% | 0% | 27% | -38% | 0.075 | $24,091,249 |
| DCN | Dacian Gold Ltd | 18% | 3% | -10% | -10% | 0.09 | $109,512,084 |
| NWM | Norwest Minerals | 18% | 93% | 7% | 132% | 0.058 | $15,825,167 |
| MZZ | Matador Mining Ltd | 18% | -2% | -43% | -55% | 0.065 | $19,236,901 |
| CDT | Castle Minerals | 18% | -13% | -38% | -46% | 0.013 | $14,618,409 |
| FML | Focus Minerals Ltd | 18% | 8% | -22% | 33% | 0.2 | $57,311,729 |
| G50 | Gold50Limited | 17% | 46% | -18% | 37% | 0.205 | $13,096,890 |
| HAV | Havilah Resources | 17% | -6% | -27% | -2% | 0.24 | $75,993,410 |
| TCG | Turaco Gold Limited | 17% | -4% | -5% | 2% | 0.055 | $27,649,417 |
| KAL | Kalgoorliegoldmining | 17% | 6% | -58% | -72% | 0.035 | $4,012,256 |
| AUT | Auteco Minerals | 17% | -7% | -45% | -36% | 0.028 | $67,072,253 |
| CBY | Canterbury Resources | 17% | -10% | -32% | -40% | 0.028 | $3,468,565 |
| GSN | Great Southern | 17% | 5% | -28% | -36% | 0.021 | $15,018,647 |
| CXU | Cauldron Energy Ltd | 17% | 0% | 0% | -10% | 0.007 | $6,520,981 |
| G88 | Golden Mile Res Ltd | 16% | 159% | 180% | 110% | 0.057 | $18,775,202 |
| MRR | Minrex Resources Ltd | 16% | 38% | -44% | -47% | 0.018 | $20,612,483 |
| ENR | Encounter Resources | 16% | 33% | 125% | 212% | 0.405 | $162,165,570 |
| MRZ | Mont Royal Resources | 15% | 74% | -14% | -52% | 0.15 | $10,272,400 |
| ZAG | Zuleika Gold Ltd | 15% | 0% | -29% | -32% | 0.015 | $7,845,759 |
| BEZ | Besragoldinc | 15% | -4% | 333% | 386% | 0.225 | $77,849,615 |
| SXG | Southern Cross Gold | 15% | 6% | -38% | 35% | 0.5 | $45,382,312 |
| CAI | Calidus Resources | 15% | 5% | -28% | -69% | 0.195 | $121,522,032 |
| GTR | Gti Energy Ltd | 14% | 14% | -26% | -42% | 0.008 | $15,582,033 |
| GIB | Gibb River Diamonds | 14% | 20% | -30% | -7% | 0.042 | $8,883,397 |
| MHC | Manhattan Corp Ltd | 13% | 13% | 64% | 13% | 0.009 | $29,362,787 |
| RMX | Red Mount Min Ltd | 13% | 13% | -10% | -10% | 0.0045 | $9,087,404 |
| GAL | Galileo Mining Ltd | 12% | 12% | -27% | -50% | 0.645 | $127,468,078 |
| ERM | Emmerson Resources | 12% | 2% | -13% | -29% | 0.065 | $33,772,007 |
| MGV | Musgrave Minerals | 12% | 8% | 55% | 30% | 0.325 | $192,142,583 |
| RML | Resolution Minerals | 11% | 25% | -38% | -38% | 0.005 | $6,286,459 |
| CYL | Catalyst Metals | 11% | -1% | -30% | -36% | 0.83 | $181,821,912 |
| HCH | Hot Chili Ltd | 10% | 11% | 34% | 65% | 1.17 | $142,139,795 |
| MAU | Magnetic Resources | 10% | 10% | -36% | -54% | 0.55 | $133,879,030 |
| HXG | Hexagon Energy | 10% | 0% | -35% | -50% | 0.011 | $5,642,075 |
| SLR | Silver Lake Resource | 10% | 3% | -9% | -16% | 1.0725 | $1,018,070,045 |
| TAR | Taruga Minerals | 10% | -21% | -54% | -50% | 0.011 | $9,178,348 |
| USL | Unico Silver Limited | 10% | -15% | -35% | -8% | 0.11 | $32,565,675 |
| MBK | Metal Bank Ltd | 10% | 0% | -32% | -43% | 0.023 | $6,359,167 |
| MOH | Moho Resources | 9% | -8% | -43% | -54% | 0.012 | $3,374,511 |
| WWI | West Wits Mining Ltd | 9% | -8% | -25% | -45% | 0.012 | $29,159,224 |
| BGL | Bellevue Gold Ltd | 9% | 5% | 22% | 116% | 1.38 | $1,593,553,136 |
| EMR | Emerald Res NL | 9% | 9% | 82% | 109% | 2.16 | $1,327,880,189 |
| A8G | Australasian Metals | 9% | -14% | -34% | -44% | 0.125 | $6,515,062 |
| M24 | Mamba Exploration | 9% | -17% | -48% | -25% | 0.075 | $4,573,750 |
| PNT | Panthermetalsltd | 9% | 10% | -60% | -60% | 0.076 | $4,647,400 |
| CAZ | Cazaly Resources | 8% | 5% | 15% | 3% | 0.039 | $14,501,050 |
| AZY | Antipa Minerals Ltd | 8% | 0% | -38% | -59% | 0.013 | $46,761,669 |
| ADT | Adriatic Metals | 8% | 12% | 8% | 85% | 3.41 | $785,872,633 |
| HMX | Hammer Metals Ltd | 8% | 0% | -3% | 27% | 0.066 | $56,303,404 |
| NAG | Nagambie Resources | 8% | 3% | -39% | -25% | 0.04 | $22,687,326 |
| HRZ | Horizon | 8% | 0% | -33% | -41% | 0.041 | $28,576,331 |
| IPT | Impact Minerals | 8% | 8% | 100% | 75% | 0.014 | $39,825,854 |
| DTR | Dateline Resources | 8% | 47% | -24% | -71% | 0.028 | $23,135,528 |
| PUR | Pursuit Minerals | 8% | -7% | -13% | -7% | 0.014 | $36,494,100 |
| OZM | Ozaurum Resources | 8% | 10% | -35% | -72% | 0.043 | $5,715,000 |
| TSO | Tesoro Gold Ltd | 7% | -12% | -19% | -36% | 0.029 | $29,501,152 |
| LEX | Lefroy Exploration | 7% | 7% | -15% | -15% | 0.22 | $35,300,760 |
| AAJ | Aruma Resources Ltd | 7% | -29% | -17% | -30% | 0.044 | $8,632,881 |
| SMS | Starmineralslimited | 7% | -2% | -38% | -51% | 0.045 | $1,356,381 |
| FEG | Far East Gold | 7% | 2% | -38% | -10% | 0.3 | $48,210,186 |
| BNR | Bulletin Res Ltd | 7% | 3% | -31% | -44% | 0.064 | $19,083,422 |
| IVR | Investigator Res Ltd | 7% | -6% | 17% | 17% | 0.049 | $71,858,501 |
| MXR | Maximus Resources | 6% | -8% | -18% | -31% | 0.033 | $10,528,840 |
| MEK | Meeka Metals Limited | 6% | 3% | -47% | -28% | 0.036 | $35,231,095 |
| RRL | Regis Resources | 6% | -7% | -6% | 30% | 1.9425 | $1,445,985,592 |
| AAU | Antilles Gold Ltd | 6% | -12% | 27% | -40% | 0.038 | $20,661,658 |
| ADG | Adelong Gold Limited | 6% | 12% | 36% | -53% | 0.0095 | $5,963,223 |
| PGD | Peregrine Gold | 5% | 4% | -25% | -19% | 0.29 | $15,989,244 |
| WGX | Westgold Resources. | 5% | 5% | 73% | 29% | 1.515 | $755,428,254 |
| SVG | Savannah Goldfields | 5% | -28% | -45% | -48% | 0.105 | $22,522,570 |
| VRC | Volt Resources Ltd | 5% | 17% | -30% | -45% | 0.0105 | $39,394,239 |
| ALK | Alkane Resources Ltd | 5% | -1% | 37% | 8% | 0.735 | $457,196,263 |
| LCY | Legacy Iron Ore | 5% | 31% | 11% | 17% | 0.021 | $140,950,176 |
| FAL | Falconmetalsltd | 5% | -11% | -25% | 8% | 0.21 | $39,825,000 |
| DRE | Dreadnought Resources Ltd | 5% | 9% | -47% | 21% | 0.0555 | $189,680,509 |
| MI6 | Minerals260Limited | 5% | 61% | 99% | 150% | 0.675 | $163,800,000 |
| ANX | Anax Metals Ltd | 5% | 0% | 28% | -11% | 0.068 | $28,248,243 |
| TGM | Theta Gold Mines Ltd | 5% | -1% | 1% | 25% | 0.069 | $42,997,483 |
| BBX | BBX Minerals Ltd | 4% | -29% | -53% | -55% | 0.049 | $25,100,285 |
| TIE | Tietto Minerals | 4% | -4% | -29% | 33% | 0.5 | $543,763,745 |
| GBR | Greatbould Resources | 4% | 3% | -13% | 9% | 0.079 | $41,349,074 |
| TBR | Tribune Res Ltd | 4% | -5% | -20% | -22% | 3.22 | $171,045,931 |
| A1G | African Gold Ltd. | 4% | -5% | -35% | -38% | 0.054 | $9,142,805 |
| RND | Rand Mining Ltd | 4% | 3% | -10% | -7% | 1.22 | $69,388,672 |
| AGC | AGC Ltd | 4% | -10% | -8% | -24% | 0.055 | $5,500,000 |
| MKG | Mako Gold | 4% | -6% | -28% | -55% | 0.029 | $17,866,178 |
| ZNC | Zenith Minerals Ltd | 3% | -28% | -66% | -61% | 0.09 | $33,828,565 |
| TG1 | Techgen Metals Ltd | 3% | -21% | -22% | -47% | 0.064 | $5,093,107 |
| KNB | Koonenberrygold | 3% | -11% | -45% | -58% | 0.034 | $2,575,719 |
| MLS | Metals Australia | 3% | 0% | -21% | -27% | 0.035 | $21,217,230 |
| AAR | Astral Resources NL | 3% | -5% | -3% | -11% | 0.07 | $50,308,436 |
| MEU | Marmota Limited | 3% | 6% | -27% | -39% | 0.035 | $37,058,020 |
| STN | Saturn Metals | 3% | -10% | 0% | -44% | 0.18 | $28,985,509 |
| DLI | Delta Lithium | 3% | 40% | 91% | 126% | 0.905 | $468,820,643 |
| MAT | Matsa Resources | 3% | -10% | 0% | -14% | 0.037 | $16,068,287 |
| AUC | Ausgold Limited | 2% | -13% | -4% | 2% | 0.045 | $103,326,354 |
| DEG | De Grey Mining | 2% | -1% | 4% | 64% | 1.34 | $2,170,022,012 |
| HRN | Horizon Gold Ltd | 1% | -1% | 15% | 8% | 0.355 | $43,813,574 |
| RED | Red 5 Limited | 1% | 22% | -11% | -24% | 0.1825 | $640,004,425 |
| NST | Northern Star | 1% | -9% | 12% | 77% | 12.235 | $14,619,101,279 |
| AMI | Aurelia Metals Ltd | 1% | -11% | -22% | -64% | 0.0935 | $161,739,392 |
| GOR | Gold Road Res Ltd | 0% | -18% | -11% | 36% | 1.505 | $1,676,945,263 |
| IGO | IGO Limited | 0% | 5% | 12% | 59% | 15.04 | $11,752,796,458 |
| NPM | Newpeak Metals | 0% | 0% | 0% | 0% | 0.001 | $9,248,616 |
| FFX | Firefinch Ltd | 0% | 0% | 0% | 0% | 0.2 | $236,569,315 |
| DCX | Discovex Res Ltd | 0% | -33% | -33% | -56% | 0.002 | $6,605,136 |
| AQXDB | Alice Queen Ltd | 0% | 0% | -50% | -67% | 0.02 | $2,530,288 |
| PRX | Prodigy Gold NL | 0% | 0% | -42% | -44% | 0.007 | $12,257,755 |
| ADN | Andromeda Metals Ltd | 0% | 9% | -14% | -48% | 0.038 | $118,180,320 |
| SRN | Surefire Rescs NL | 0% | -12% | 25% | -42% | 0.015 | $24,770,452 |
| SIH | Sihayo Gold Limited | 0% | 0% | 0% | -20% | 0.002 | $24,408,512 |
| WCN | White Cliff Min Ltd | 0% | 0% | -50% | -36% | 0.007 | $8,100,530 |
| AVM | Advance Metals Ltd | 0% | -13% | -30% | -13% | 0.007 | $3,531,352 |
| WRM | White Rock Min Ltd | 0% | 0% | -5% | -40% | 0.063 | $17,508,200 |
| TRY | Troy Resources Ltd | 0% | 0% | 0% | 0% | 0.0295 | $62,920,961 |
| CGN | Crater Gold Min Ltd | 0% | 0% | 0% | 0% | 0.144993 | $17,965,132 |
| GUL | Gullewa Limited | 0% | -5% | -5% | -3% | 0.057 | $11,159,067 |
| ADV | Ardiden Ltd | 0% | 0% | 0% | 0% | 0.007 | $18,818,347 |
| NAE | New Age Exploration | 0% | -17% | -29% | -17% | 0.005 | $7,179,495 |
| MTH | Mithril Resources | 0% | 0% | -43% | -60% | 0.002 | $6,737,609 |
| PRS | Prospech Limited | 0% | -25% | 12% | 8% | 0.03 | $7,032,319 |
| NML | Navarre Minerals Ltd | 0% | -5% | -54% | -60% | 0.019 | $28,555,654 |
| KZR | Kalamazoo Resources | 0% | -4% | -43% | -37% | 0.12 | $17,836,453 |
| BCN | Beacon Minerals | 0% | -6% | 4% | 4% | 0.029 | $108,946,277 |
| AL8 | Alderan Resource Ltd | 0% | 17% | 0% | -42% | 0.007 | $4,316,863 |
| HMG | Hamelingoldlimited | 0% | -9% | -31% | -9% | 0.1 | $15,750,000 |
| TBA | Tombola Gold Ltd | 0% | 0% | 0% | -26% | 0.026 | $33,129,243 |
| QML | Qmines Limited | 0% | -4% | -30% | -32% | 0.115 | $19,596,875 |
| RDN | Raiden Resources Ltd | 0% | 157% | 89% | 5% | 0.009 | $18,497,420 |
| DTM | Dart Mining NL | 0% | -9% | -29% | -26% | 0.039 | $7,408,351 |
| X64 | Ten Sixty Four Ltd | 0% | 0% | -11% | -11% | 0.57 | $130,184,182 |
| HAW | Hawthorn Resources | 0% | 54% | 26% | 79% | 0.145 | $48,577,264 |
| RVR | Red River Resources | 0% | 0% | 0% | -51% | 0.073 | $37,847,908 |
| TMZ | Thomson Res Ltd | 0% | 0% | -74% | -74% | 0.005 | $4,349,755 |
| TAM | Tanami Gold NL | 0% | 21% | 3% | -20% | 0.04 | $45,828,785 |
| WMC | Wiluna Mining Corp | 0% | 0% | 0% | -13% | 0.205 | $74,238,031 |
| IDA | Indiana Resources | 0% | 0% | -25% | -25% | 0.041 | $22,855,137 |
| THR | Thor Energy PLC | 0% | -20% | -33% | -60% | 0.004 | $5,840,051 |
| RDS | Redstone Resources | 0% | -13% | -13% | 0% | 0.007 | $5,924,649 |
| EVN | Evolution Mining Ltd | 0% | -8% | 8% | 34% | 3.23 | $6,110,604,342 |
| ALY | Alchemy Resource Ltd | 0% | -12% | -35% | -12% | 0.015 | $16,493,068 |
| OBM | Ora Banda Mining Ltd | 0% | -17% | 43% | 150% | 0.12 | $220,342,680 |
| AVW | Avira Resources Ltd | 0% | 0% | -33% | -43% | 0.002 | $4,267,580 |
| CEL | Challenger Gold Ltd | 0% | -32% | -40% | -38% | 0.105 | $136,978,258 |
| CHZ | Chesser Resources | 0% | -8% | 29% | 29% | 0.11 | $64,746,148 |
| PKO | Peako Limited | 0% | 14% | -45% | -38% | 0.008 | $3,765,852 |
| GNM | Great Northern | 0% | -17% | -58% | -58% | 0.025 | $3,865,727 |
| KRM | Kingsrose Mining Ltd | 0% | 18% | 0% | 23% | 0.065 | $47,409,171 |
| AWJ | Auric Mining | 0% | -11% | -38% | -34% | 0.04 | $5,234,384 |
| AYM | Australia United Min | 0% | 0% | 0% | -40% | 0.003 | $5,527,732 |
| ANL | Amani Gold Ltd | 0% | 0% | 0% | 0% | 0.001 | $25,143,441 |
| GCY | Gascoyne Res Ltd | 0% | 9% | 5% | -11% | 0.175 | $157,862,359 |
| TUL | Tulla Resources | 0% | 6% | 6% | -35% | 0.35 | $118,262,971 |
| CLZ | Classic Min Ltd | 0% | 0% | -89% | -99% | 0.001 | $7,358,000 |
| TMS | Tennant Minerals Ltd | 0% | -13% | -13% | -4% | 0.027 | $21,264,135 |
| PXX | Polarx Limited | 0% | -14% | -40% | -25% | 0.012 | $16,246,922 |
| NCM | Newcrest Mining | 0% | -1% | 27% | 34% | 26.225 | $24,036,922,076 |
| SSR | SSR Mining Inc. | 0% | -7% | -11% | -13% | 20.6 | $372,667,104 |
| CMM | Capricorn Metals | 0% | -7% | -12% | 26% | 4.05 | $1,594,062,662 |
| AZS | Azure Minerals | -1% | 200% | 627% | 761% | 1.635 | $639,987,158 |
| SMI | Santana Minerals Ltd | -1% | -12% | -19% | -8% | 0.53 | $101,597,439 |
| BNZ | Benzmining | -1% | 26% | 11% | 8% | 0.455 | $50,015,863 |
| PGO | Pacgold | -1% | -11% | -7% | -41% | 0.335 | $18,687,017 |
| YRL | Yandal Resources | -2% | -24% | -47% | -64% | 0.052 | $8,205,760 |
| PRU | Perseus Mining Ltd | -2% | -14% | -23% | 2% | 1.625 | $2,325,577,645 |
| XAM | Xanadu Mines Ltd | -2% | 69% | 179% | 238% | 0.081 | $137,577,232 |
| KSN | Kingston Resources | -3% | -26% | -4% | -11% | 0.078 | $36,550,397 |
| RSG | Resolute Mining | -3% | -20% | 95% | 74% | 0.39 | $894,182,759 |
| RMS | Ramelius Resources | -3% | -15% | 33% | 36% | 1.2375 | $1,268,861,668 |
| ASO | Aston Minerals Ltd | -3% | -9% | -6% | -21% | 0.075 | $89,178,475 |
| SVL | Silver Mines Limited | -3% | -13% | -13% | 21% | 0.175 | $252,779,786 |
| SPD | Southernpalladium | -3% | -22% | -57% | -60% | 0.35 | $15,077,414 |
| AQI | Alicanto Min Ltd | -3% | -3% | -21% | -53% | 0.034 | $18,371,451 |
| WAF | West African Res Ltd | -3% | -3% | -29% | -32% | 0.84 | $885,394,751 |
| TLM | Talisman Mining | -3% | -6% | 18% | 18% | 0.165 | $31,072,858 |
| PDI | Predictive Disc Ltd | -3% | 3% | -11% | -16% | 0.16 | $330,759,054 |
| LM8 | Lunnonmetalslimited | -3% | -3% | 2% | 34% | 0.91 | $164,458,680 |
| MM8 | Medallion Metals. | -3% | -8% | -53% | -64% | 0.0725 | $17,758,704 |
| PNR | Pantoro Limited | -3% | 2% | -28% | -63% | 0.0695 | $333,986,166 |
| BM8 | Battery Age Minerals | -4% | 71% | 6% | 6% | 0.53 | $36,737,991 |
| KCN | Kingsgate Consolid. | -4% | 14% | -16% | 9% | 1.45 | $386,627,538 |
| WA8 | Warriedarresourltd | -4% | -29% | -54% | -3% | 0.078 | $33,622,587 |
| SFR | Sandfire Resources | -4% | -6% | 5% | 42% | 5.705 | $2,672,817,779 |
| MOM | Moab Minerals Ltd | -4% | 4% | 39% | -55% | 0.0125 | $8,865,525 |
| CLA | Celsius Resource Ltd | -4% | 0% | 50% | 60% | 0.024 | $53,065,240 |
| OKR | Okapi Resources | -4% | 4% | -20% | -33% | 0.12 | $23,135,752 |
| PNM | Pacific Nickel Mines | -4% | -17% | -17% | -1% | 0.069 | $28,659,120 |
| SLZ | Sultan Resources Ltd | -4% | 13% | -47% | -55% | 0.045 | $6,816,742 |
| CHN | Chalice Mining Ltd | -4% | -19% | -7% | 57% | 5.885 | $2,340,949,436 |
| REZ | Resourc & En Grp Ltd | -4% | -19% | 38% | -4% | 0.022 | $11,495,533 |
| MTC | Metalstech Ltd | -4% | -27% | -59% | -37% | 0.215 | $42,436,033 |
| SFM | Santa Fe Minerals | -5% | -21% | -48% | -56% | 0.042 | $3,204,027 |
| SKY | SKY Metals Ltd | -5% | -2% | -17% | -30% | 0.04 | $17,727,715 |
| CDR | Codrus Minerals Ltd | -5% | -53% | -40% | 20% | 0.078 | $5,883,540 |
| KAU | Kaiser Reef | -5% | -3% | 15% | 23% | 0.19 | $28,062,560 |
| STK | Strickland Metals | -5% | -10% | -5% | -30% | 0.038 | $58,821,064 |
| BGD | Bartongoldholdings | -6% | -7% | 28% | 42% | 0.255 | $48,540,353 |
| ORN | Orion Minerals Ltd | -6% | -6% | 6% | -6% | 0.017 | $95,999,826 |
| TRM | Truscott Mining Corp | -6% | -11% | 2% | -13% | 0.042 | $7,397,151 |
| CST | Castile Resources | -6% | -12% | -13% | -48% | 0.083 | $20,319,804 |
| NSM | Northstaw | -6% | -29% | -41% | -43% | 0.092 | $12,012,700 |
| BYH | Bryah Resources Ltd | -6% | -12% | -42% | -46% | 0.015 | $5,182,579 |
| CPM | Coopermetalslimited | -6% | -32% | -36% | -63% | 0.15 | $6,189,847 |
| BMO | Bastion Minerals | -6% | 0% | -12% | -80% | 0.03 | $5,373,051 |
| TRE | Toubaniresourcesinc | -6% | -21% | -6% | 0% | 0.15 | $8,633,928 |
| M2R | Miramar | -7% | -27% | -50% | -57% | 0.038 | $3,327,804 |
| TMX | Terrain Minerals | -7% | -28% | 8% | -19% | 0.0065 | $6,499,196 |
| FG1 | Flynngold | -7% | -32% | -48% | -61% | 0.052 | $7,202,474 |
| GRL | Godolphin Resources | -7% | -2% | -40% | -50% | 0.05 | $5,918,472 |
| BC8 | Black Cat Syndicate | -8% | -5% | 0% | 20% | 0.355 | $96,075,523 |
| GMD | Genesis Minerals | -8% | -4% | -6% | -3% | 1.17 | $1,224,274,588 |
| TNC | True North Copper | -8% | 325% | 325% | 192% | 0.225 | $62,361,948 |
| BTR | Brightstar Resources | -8% | 0% | -35% | -42% | 0.011 | $17,314,167 |
| MDI | Middle Island Res | -10% | -39% | -50% | -85% | 0.019 | $2,325,946 |
| SAU | Southern Gold | -10% | -5% | -24% | -32% | 0.019 | $9,725,706 |
| AGG | AngloGold Ashanti | -10% | -9% | 11% | 50% | 6.51 | $580,742,550 |
| LRL | Labyrinth Resources | -10% | -40% | -47% | -55% | 0.009 | $8,635,386 |
| KCC | Kincora Copper | -10% | -9% | -16% | 13% | 0.061 | $7,338,438 |
| AME | Alto Metals Limited | -11% | -22% | -24% | -15% | 0.051 | $31,253,589 |
| SPQ | Superior Resources | -11% | -14% | -55% | -31% | 0.025 | $47,698,398 |
| MEG | Megado Minerals Ltd | -11% | -11% | 20% | -33% | 0.054 | $15,267,333 |
| SVY | Stavely Minerals Ltd | -12% | -26% | -62% | -44% | 0.092 | $34,377,508 |
| RXL | Rox Resources | -16% | -28% | 60% | 14% | 0.28 | $66,184,507 |
| GSM | Golden State Mining | -17% | -26% | -9% | 0% | 0.039 | $5,626,304 |
| POL | Polymetals Resources | -18% | -13% | 20% | 221% | 0.295 | $28,668,894 |
| EMU | EMU NL | -20% | -20% | -59% | -76% | 0.002 | $2,900,043 |
| GBZ | GBM Rsources Ltd | -24% | -20% | -63% | -74% | 0.016 | $10,471,336 |
| CODE | COMPANY | 1 WEEK RETURN % | 1 MONTH RETURN % | YTD RETURN % | 12 MONTH RETURN % | PRICE | MARKET CAP |
| TMB | Tambourahmetals | 150% | 145% | 133% | 81% | 0.245 | $5,972,927 |
Small Cap Standouts
TITAN MINERALS (ASX:TTM)
TTM unveiled a monster 3.1Moz gold, 22Moz silver maiden resource at the Dynasty project in Ecuador.
That includes a significant high-grade component — 17.3Mt @ 3.77g/t gold, 24.0g/t silver for a contained 2.09Moz gold and 13.33Moz silver.
Over half the resources, positioned along a 9km long corridor, are less than 100m from surface. With less than half the system tested more drilling to add ounces will commence in the coming months, the company says.
“Titan aspires to emulate the success of Lundin Gold Inc. (TSX:LUG) and their world-class Fruta del Norte Gold Project in southeast Ecuador, an epithermal gold-silver intermediate sulphidation system with many similarities to Dynasty and containing Mineral Resources of 9.81 Moz gold and 15.0 Moz silver,” TTM CEO Melanie Leighton says.
“Touted as one of the highest grade, lowest cost mines in the world, Fruta del Norte commenced operation in 2019, and in 2022 total revenue was $841 million.”
TTM acquired Dynasty early 2020 following a bruising 18-month ‘David and Goliath’ battle with Zhaojin Mining; a $30bn, +650,000ozpa Chinese gold producer which also wanted the asset.
ICENI GOLD (ASX:ICL)
Noted nugget finder ICL has identified a new +500m long gold target at the flagship 14 Mile Well project in WA, with rock chip sampling returning a highlight 57.6/t Au.
The target sits along the contact of the ‘Monument Granite’ which has similar prospectivity to nearby granite associated gold deposits like Puzzle, Puzzle North (Genesis Minerals) and Granny Smith (Gold Fields Australia), all within the Laverton-Leonora district.
ICL controls 25km of prospective Monument Granite contact, it says.
Related Topics

Related Stories


UNLOCK INSIGHTS
Discover the untold stories of emerging ASX stocks.
Daily news and expert analysis, it's free to subscribe.
By proceeding, you confirm you understand that we handle personal information in accordance with our Privacy Policy.


