Gold Digger: An inflationary bomb is about to go off. It’s time to prepare for the next gold bull market
Pic: Tyler Stableford / Stone via Getty Images
US Fed chair Jerome Powell finally admitted that inflationary pressures weren’t going to be as short-lived as perhaps expected.
Earlier this week Powell surprised markets by suggesting it would be appropriate to drop the phrase “inflation is transitory” from the Fed’s lexicon.
For gold bugs, the prospect of higher inflation is often viewed as a good thing. Gold is an ‘inflation hedge’; an investment that ostensibly protects the buyer from decreased purchasing power of a currency due to rising prices.
Which is happening right now, everywhere.
Goehring & Rozencwajg Associates managing partner Leigh Goehring told Kitco that we are “getting closer to the explosion of gold prices to the upside”.
“There are too many similarities between now and the late 1960s and early 1970s, and they cannot be ignored,” he says.
“Back then, inflation was going up about 5%-6% per year — the same as now. And then, in 1973, there was the black swan event — the oil embargo.”
Oil went from $US4 a barrel up to $US15 a barrel literally overnight.
This time there’s a difference, Goehring says.
“This time around the Fed will have to give up on raising rates because it will be too painful for everyone,” he says.
“Once the precious metal bottoms from the Fed’s tightening action, it will begin its massive bull market.”
‘Rapidly approaching an inflection point’
In November, Goehring & Rozencwajg wrote that multiple trends supported the view that we are rapidly approaching inflation’s inflection point.
“In 2019, M2 [money supply] was only growing at 4% per year; today it is growing at 27% per year — the fastest rate in history,” they say.
All this free cash means shortages are starting to develop, Goehring & Rozencwajg say, in everything from timber, semiconductors, restaurant workers and ketchup packets.
Meanwhile, economically sensitive commodities such as copper have entered new bull markets while surging grain prices warn of significant food inflation ahead.
“Despite these trends, investors continue to pile into technology stocks, SPACs, cryptocurrencies and long-term bonds; each of which will perform terribly in an inflationary environment,” Goehring & Rozencwajg say.
“In stark contrast, inflation hedges like gold remain priced at record low levels relative to financial assets and are ignored by almost all investors.
“The countdown to inflation is ticking and we are getting closer and closer to an explosion in inflationary pressures,” Goehring & Rozencwajg says.
“All economic signs point in that direction, yet few investors are prepared to protect themselves, yet alone profit from an investment landscape that is about to suddenly and radically change.”
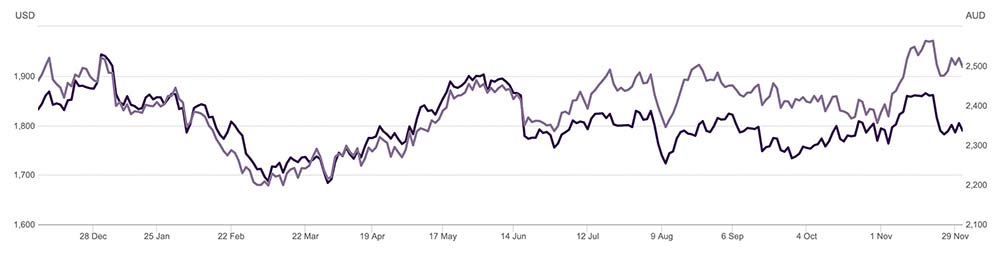
USD (dark) and AUD (light) gold prices over the past 12 months. Sources: FastMarkets, ICE Benchmark Administration, Thomson Reuters, World Gold Council
Winners & Losers
Here’s how ASX-listed gold & silver stocks are performing:
Scroll or swipe to reveal table. Click headings to sort. Best viewed on a laptop
>>> Stocks missing from this list? Email [email protected]
| CODE | COMPANY | 1 WEEK RETURN % | 1 MONTH RETURN % | 6 MONTH RETURN % | 1 YEAR RETURN % | SHARE PRICE [INTRADAY FRI] | MARKET CAP |
|---|---|---|---|---|---|---|---|
| MRR | Minrex Resources | 138 | 163 | 100 | 108 | 0.05 | $ 23,959,869.26 |
| NPM | Newpeak Metals | 50 | 0 | -25 | -50 | 0.0015 | $ 11,137,027.65 |
| ASO | Aston Minerals | 36 | 25 | -30 | 275 | 0.15 | $ 143,129,614.35 |
| MTC | Metalstech | 29 | -1 | 94 | 103 | 0.33 | $ 58,332,606.50 |
| FFX | Firefinch | 26 | 34 | 113 | 459 | 0.81 | $ 811,237,149.72 |
| GED | Golden Deeps | 25 | 25 | 25 | 7 | 0.015 | $ 10,861,920.16 |
| G88 | Golden Mile Res | 22 | 6 | -8 | 8 | 0.056 | $ 9,406,008.04 |
| DCX | Discovex Res | 11 | 0 | -23 | -17 | 0.005 | $ 10,274,656.30 |
| NMR | Native Mineral Res | 10 | 17 | 5 | -24 | 0.275 | $ 8,981,675.28 |
| AQX | Alice Queen | 10 | -15 | -27 | -59 | 0.011 | $ 15,072,453.11 |
| SLZ | Sultan Resources | 10 | -3 | -41 | -28 | 0.17 | $ 11,125,502.24 |
| MKG | Mako Gold | 10 | 26 | 22 | 0 | 0.115 | $ 43,957,784.23 |
| KSN | Kingston Resources | 9 | -10 | -16 | -33 | 0.19 | $ 65,990,343.05 |
| AMI | Aurelia Metals | 8 | 14 | -2 | -2 | 0.42 | $ 513,378,429.66 |
| PNX | PNX Metals Limited | 8 | 0 | -30 | 17 | 0.007 | $ 23,739,257.82 |
| GIB | Gibb River Diamonds | 7 | 1 | 17 | -40 | 0.09 | $ 19,035,850.05 |
| KCN | Kingsgate Consolid. | 6 | 9 | 67 | 92 | 1.5 | $ 336,407,088.56 |
| TMX | Terrain Minerals | 6 | 6 | -15 | -23 | 0.0085 | $ 6,253,968.58 |
| BNR | Bulletin Res | 6 | 15 | 29 | 24 | 0.086 | $ 21,570,721.31 |
| NXM | Nexus Minerals | 6 | 31 | 540 | 275 | 0.525 | $ 145,417,789.60 |
| SKY | SKY Metals | 6 | 15 | -42 | -54 | 0.093 | $ 35,040,862.71 |
| LM8 | Lunnonmetalslimited | 6 | -5 | 0.375 | $ 26,044,053.04 | ||
| CST | Castile Resources | 5 | -26 | -20 | -29 | 0.2 | $ 39,942,024.20 |
| YRL | Yandal Resources | 5 | -8 | -31 | -17 | 0.41 | $ 40,204,372.65 |
| FAU | First Au | 5 | -9 | -42 | -48 | 0.0105 | $ 7,682,859.40 |
| ARL | Ardea Resources | 5 | 14 | 17 | 23 | 0.545 | $ 69,415,109.50 |
| GWR | GWR Group | 5 | 0 | -54 | -41 | 0.11 | $ 31,792,576.52 |
| AGG | AngloGold Ashanti | 4 | 22 | -7 | -6 | 5.8 | $ 524,541,658.20 |
| IVR | Investigator Res | 4 | 13 | -27 | 33 | 0.077 | $ 103,267,835.35 |
| GTR | Gti Resources | 4 | -10 | 27 | 62 | 0.027 | $ 29,348,311.93 |
| IPT | Impact Minerals | 4 | -4 | -16 | -39 | 0.0135 | $ 27,321,231.41 |
| BNZ | Benzmining | 3 | 7 | -24 | 0.695 | $ 34,824,770.64 | |
| MOH | Moho Resources | 3 | 5 | -22 | -46 | 0.062 | $ 7,798,074.92 |
| BBX | BBX Minerals | 3 | 3 | -37 | -42 | 0.165 | $ 75,573,543.38 |
| PUA | Peak Minerals | 3 | -8 | -21 | -41 | 0.0165 | $ 14,276,841.92 |
| MRZ | Mont Royal Resources | 3 | -18 | 4 | 15 | 0.35 | $ 20,417,582.85 |
| SMS | Starmineralslimited | 3 | -9 | 0.18 | $ 4,725,000.00 | ||
| MVL | Marvel Gold Limited | 3 | 4 | 41 | 29 | 0.072 | $ 42,259,162.18 |
| PRX | Prodigy Gold NL | 3 | 6 | -35 | -36 | 0.037 | $ 21,557,221.42 |
| AAU | Antilles Gold | 3 | 1 | 23 | 29 | 0.076 | $ 22,800,372.08 |
| CWX | Carawine Resources | 3 | -3 | -22 | -26 | 0.195 | $ 26,541,863.99 |
| RND | Rand Mining | 2 | 6 | 9 | -29 | 1.49 | $ 84,745,181.89 |
| CAZ | Cazaly Resources | 2 | 0 | -29 | -6 | 0.044 | $ 16,260,783.75 |
| BMR | Ballymore Resources | 2 | -8 | 0 | 0 | 0.22 | $ 15,725,177.82 |
| DRE | Drednought Resources | 2 | 21 | 92 | 109 | 0.046 | $ 130,418,443.35 |
| ZNC | Zenith Minerals | 2 | 0 | -6 | 74 | 0.235 | $ 79,332,017.98 |
| REZ | Resourc & En Grp | 2 | -2 | 71 | -11 | 0.048 | $ 23,990,677.87 |
| LEX | Lefroy Exploration | 1 | -13 | -72 | 84 | 0.35 | $ 49,452,308.64 |
| ERM | Emmerson Resources | 1 | -10 | -6 | 0 | 0.077 | $ 37,866,125.16 |
| AM7 | Arcadia Minerals | 1 | 4 | 0.2075 | $ 6,840,000.00 | ||
| ADT | Adriatic Metals | 1 | -5 | 8 | 24 | 2.69 | $ 623,694,432.04 |
| GMR | Golden Rim Resources | 1 | 1 | -45 | -39 | 0.091 | $ 22,874,715.05 |
| CYL | Catalyst Metals | 1 | 8 | 8 | -21 | 2.19 | $ 215,618,033.37 |
| CHN | Chalice Mining | 0 | 48 | 4 | 146 | 9.45 | $ 3,351,093,182.80 |
| KAL | Kalgoorliegoldmining | 0 | 0.16 | $ 10,865,190.00 | |||
| MLS | Metals Australia | 0 | 25 | 25 | 25 | 0.0025 | $ 10,477,114.72 |
| ADN | Andromeda Metals | 0 | -3 | -20 | -40 | 0.16 | $ 397,396,327.36 |
| MEI | Meteoric Resources | 0 | -11 | -69 | -71 | 0.017 | $ 24,858,956.16 |
| SRN | Surefire Rescs NL | 0 | -8 | -45 | -73 | 0.012 | $ 13,251,724.91 |
| SIH | Sihayo Gold Limited | 0 | 13 | -25 | -55 | 0.009 | $ 29,483,691.30 |
| AWV | Anova Metals | 0 | 0 | -13 | -26 | 0.02 | $ 28,661,884.00 |
| HMX | Hammer Metals | 0 | -12 | -56 | 28 | 0.046 | $ 33,353,279.54 |
| WCN | White Cliff Min | 0 | 23 | -11 | -45 | 0.016 | $ 8,275,142.38 |
| PAK | Pacific American Hld | 0 | 0 | -9 | -17 | 0.017 | $ 8,123,915.83 |
| WRM | White Rock Min | 0 | 2 | -48 | -47 | 0.31 | $ 44,164,389.32 |
| TNR | Torian Resources | 0 | -15 | -32 | -26 | 0.023 | $ 25,070,968.14 |
| MCT | Metalicity Limited | 0 | 0 | -25 | -47 | 0.009 | $ 19,293,943.79 |
| AME | Alto Metals Limited | 0 | 5 | 14 | 5 | 0.105 | $ 53,649,042.51 |
| CTO | Citigold Corp | 0 | -9 | -9 | -23 | 0.01 | $ 28,336,590.91 |
| TIE | Tietto Minerals | 0 | 4 | 15 | 6 | 0.42 | $ 250,663,531.35 |
| SMI | Santana Minerals | 0 | 25 | 175 | 94 | 0.33 | $ 42,443,932.16 |
| M2R | Miramar | 0 | 14 | -2 | -38 | 0.205 | $ 10,212,079.10 |
| MHC | Manhattan Corp | 0 | -17 | -29 | -66 | 0.01 | $ 15,262,786.93 |
| GRL | Godolphin Resources | 0 | 0 | -9 | -43 | 0.145 | $ 12,196,134.30 |
| TRY | Troy Resources | 0 | 0 | -20 | -56 | 0.037 | $ 30,073,993.35 |
| KGM | Kalnorth Gold | 0 | 0 | 0 | 0 | 0.013 | $ 11,625,120.78 |
| CGN | Crater Gold Min | 0 | 0 | -11 | -19 | 0.017 | $ 20,867,429.74 |
| LNY | Laneway Res | 0 | 20 | 20 | -25 | 0.006 | $ 19,520,329.67 |
| TSC | Twenty Seven Co. | 0 | -10 | -10 | -25 | 0.0045 | $ 10,643,255.62 |
| GUL | Gullewa Limited | 0 | -6 | -8 | -24 | 0.08 | $ 15,229,848.00 |
| CY5 | Cygnus Gold Limited | 0 | 16 | 20 | 3 | 0.18 | $ 20,953,432.98 |
| G50 | Gold50Limited | 0 | 12 | 0.28 | $ 14,089,040.28 | ||
| ADV | Ardiden | 0 | 9 | 9 | -40 | 0.012 | $ 25,840,024.27 |
| AAR | Anglo Australian | 0 | 10 | 2 | -39 | 0.092 | $ 54,848,489.99 |
| MGV | Musgrave Minerals | 0 | -14 | -20 | -14 | 0.345 | $ 182,638,802.66 |
| AGS | Alliance Resources | 0 | -11 | 13 | -16 | 0.17 | $ 35,362,912.78 |
| VMC | Venus Metals Cor | 0 | 0 | -14 | -18 | 0.18 | $ 27,194,162.94 |
| NAE | New Age Exploration | 0 | 0 | -35 | -15 | 0.011 | $ 15,794,888.01 |
| VKA | Viking Mines | 0 | -22 | -45 | -33 | 0.018 | $ 18,454,651.76 |
| LCL | Los Cerros Limited | 0 | -10 | -26 | 8 | 0.13 | $ 82,721,126.15 |
| MTH | Mithril Resources | 0 | 13 | 3 | -23 | 0.017 | $ 43,863,961.70 |
| DDD | 3D Resources Limited | 0 | 0 | -33 | 21 | 0.004 | $ 15,521,488.37 |
| RMX | Red Mount Min | 0 | 0 | 5 | -17 | 0.01 | $ 14,644,583.02 |
| PRS | Prospech Limited | 0 | -18 | -58 | 0 | 0.074 | $ 4,823,394.37 |
| XTC | Xantippe Res | 0 | 13 | 125 | 125 | 0.0045 | $ 20,382,822.01 |
| TTM | Titan Minerals | -1 | -12 | -17 | -17 | 0.095 | $ 132,174,782.31 |
| NML | Navarre Minerals | -1 | -17 | -30 | -65 | 0.074 | $ 84,355,579.68 |
| RXL | Rox Resources | -1 | -1 | -15 | -50 | 0.37 | $ 59,102,855.25 |
| MZZ | Matador Mining | -1 | -4 | -29 | 1 | 0.355 | $ 70,189,924.03 |
| KZR | Kalamazoo Resources | -1 | -1 | -23 | -35 | 0.345 | $ 48,566,087.56 |
| BCN | Beacon Minerals | -2 | 0 | -14 | -5 | 0.031 | $ 111,329,059.75 |
| MAU | Magnetic Resources | -2 | -5 | 0 | 28 | 1.495 | $ 340,350,644.40 |
| BC8 | Black Cat Syndicate | -2 | 0 | -23 | -19 | 0.56 | $ 78,852,374.16 |
| EM2 | Eagle Mountain | -2 | -18 | -46 | 57 | 0.54 | $ 118,245,330.76 |
| EMR | Emerald Res NL | -2 | 11 | -2 | 72 | 1.065 | $ 548,898,025.46 |
| BYH | Bryah Resources | -2 | 0 | -33 | -24 | 0.053 | $ 11,762,773.10 |
| HCH | Hot Chili | -2 | -14 | 6 | -7 | 2.01 | $ 176,849,889.00 |
| WAF | West African Res | -2 | 0 | 17 | 30 | 1.2725 | $ 1,301,486,652.38 |
| MEU | Marmota Limited | -2 | -4 | -4 | -9 | 0.043 | $ 42,143,496.59 |
| NVADB | Nova Minerals | -2 | -12 | -6 | -29 | 1.27 | $ 227,334,770.12 |
| DCN | Dacian Gold | -2 | -9 | -29 | -41 | 0.205 | $ 198,323,150.82 |
| SVL | Silver Mines Limited | -2 | -7 | -36 | 0 | 0.205 | $ 258,366,428.60 |
| PGD | Peregrine Gold | -3 | 4 | 5 | 0.385 | $ 12,935,536.08 | |
| ICL | Iceni Gold | -3 | -31 | -8 | 0.19 | $ 22,758,198.67 | |
| FG1 | Flynngold | -3 | 23 | 0.185 | $ 10,784,128.50 | ||
| WWI | West Wits Mining | -3 | -6 | -60 | -51 | 0.036 | $ 48,743,458.38 |
| RML | Resolution Minerals | -3 | -5 | -25 | -57 | 0.018 | $ 11,814,598.78 |
| AAJ | Aruma Resources | -3 | -11 | 14 | -26 | 0.072 | $ 9,069,228.22 |
| AL8 | Alderan Resource | -3 | -16 | -38 | -62 | 0.035 | $ 14,469,246.72 |
| GMN | Gold Mountain | -3 | -8 | -54 | -58 | 0.0175 | $ 18,727,610.48 |
| MEG | Megado | -3 | 5 | -33 | -48 | 0.097 | $ 4,089,635.81 |
| HMG | Hamelingoldlimited | -3 | 0.16 | $ 16,500,000.00 | |||
| HMG | Hamelingoldlimited | -3 | 0.16 | $ 16,500,000.00 | |||
| TBA | Tombola Gold | -3 | -6 | -30 | -24 | 0.032 | $ 23,223,179.20 |
| DGO | DGO Gold Limited | -3 | 0 | -18 | -4 | 2.88 | $ 239,997,954.24 |
| PF1 | Pathfinder Resources | -3 | 5 | 0 | 54 | 0.3 | $ 15,670,697.95 |
| TBR | Tribune Res | -3 | -1 | -6 | -22 | 4.79 | $ 251,322,088.83 |
| FML | Focus Minerals | -3 | 4 | -5 | -16 | 0.285 | $ 52,083,341.03 |
| GSR | Greenstone Resources | -3 | 4 | 33 | -10 | 0.028 | $ 21,791,124.60 |
| VRC | Volt Resources | -3 | 4 | -13 | 155 | 0.028 | $ 74,137,760.34 |
| ARV | Artemis Resources | -4 | -15 | 35 | -30 | 0.081 | $ 100,399,812.08 |
| HRN | Horizon Gold | -4 | -13 | -25 | -7 | 0.385 | $ 43,743,726.56 |
| CLA | Celsius Resource | -4 | -11 | -40 | -47 | 0.025 | $ 24,086,245.86 |
| QML | Qmines Limited | -4 | -1 | -9 | 0.375 | $ 20,644,755.52 | |
| RDN | Raiden Resources | -4 | 0 | -8 | -14 | 0.024 | $ 33,007,855.30 |
| TCG | Turaco Gold Limited | -4 | -20 | 0 | 100 | 0.12 | $ 49,027,694.82 |
| KCC | Kincora Copper | -4 | -18 | -61 | 0.115 | $ 8,808,434.28 | |
| GBZ | GBM Rsources | -4 | -21 | -15 | -15 | 0.115 | $ 58,283,070.31 |
| DTM | Dart Mining NL | -4 | -13 | -43 | -43 | 0.091 | $ 10,208,256.26 |
| MKR | Manuka Resources. | -4 | -4 | -16 | -22 | 0.34 | $ 34,506,961.42 |
| AUC | Ausgold Limited | -4 | 2 | -12 | -12 | 0.045 | $ 71,340,729.35 |
| ANX | Anax Metals | -4 | -22 | -7 | 34 | 0.09 | $ 28,014,711.20 |
| EMU | EMU NL | -4 | -19 | -46 | -45 | 0.022 | $ 12,095,918.65 |
| SFM | Santa Fe Minerals | -4 | 21 | 10 | 12 | 0.11 | $ 7,645,972.85 |
| SSR | SSR Mining Inc. | -4 | 16 | 1 | -8 | 24.5 | $ 522,074,658.00 |
| PNR | Pantoro Limited | -4 | 44 | 41 | 59 | 0.325 | $ 443,992,089.87 |
| CMM | Capricorn Metals | -4 | 6 | 40 | 65 | 2.8 | $ 1,047,964,375.39 |
| MML | Medusa Mining | -4 | -3 | -14 | -2 | 0.75 | $ 154,927,444.25 |
| SI6 | SI6 Metals Limited | -5 | -5 | -13 | -25 | 0.0105 | $ 14,281,439.85 |
| HAW | Hawthorn Resources | -5 | 102 | 91 | 5 | 0.105 | $ 33,351,561.30 |
| BGD | Bartongoldholdings | -5 | 17 | 0.205 | $ 17,597,199.18 | ||
| SVY | Stavely Minerals | -5 | 11 | -7 | -44 | 0.51 | $ 130,480,726.00 |
| AOP | Apollo Consolidated | -5 | -8 | 100 | 107 | 0.6 | $ 169,139,942.20 |
| KWR | Kingwest Resources | -5 | 67 | 120 | 25 | 0.2 | $ 49,530,157.63 |
| AGC | AGC | -5 | -10 | -41 | 0.095 | $ 6,705,001.12 | |
| AGC | AGC | -5 | -10 | -41 | 0.095 | $ 6,705,001.12 | |
| RVR | Red River Resources | -5 | -5 | -17 | -32 | 0.19 | $ 93,323,607.84 |
| RGL | Riversgold | -5 | -17 | -54 | -54 | 0.019 | $ 7,676,801.72 |
| TSO | Tesoro Resources | -5 | -7 | -55 | -78 | 0.075 | $ 41,400,516.00 |
| OKR | Okapi Resources | -5 | -15 | 102 | 174 | 0.465 | $ 45,924,807.66 |
| CPM | Coopermetalslimited | -5 | 0.185 | $ 4,998,700.00 | |||
| MM8 | Medallion Metals. | -5 | -8 | -38 | 0.185 | $ 20,600,759.21 | |
| TRN | Torrens Mining | -5 | -11 | -5 | 0.1375 | $ 9,404,766.63 | |
| AUT | Auteco Minerals | -5 | 0 | -22 | -27 | 0.073 | $ 121,548,883.39 |
| CBY | Canterbury Resources | -5 | -19 | -6 | -11 | 0.089 | $ 10,697,669.17 |
| LYN | Lycaonresources | -6 | 0.42 | $ 11,070,000.00 | |||
| SFR | Sandfire Resources | -6 | 8 | -11 | 18 | 5.95 | $ 2,418,893,168.70 |
| NCM | Newcrest Mining | -6 | -6 | -20 | -19 | 22.68 | $ 18,821,217,514.71 |
| TMZ | Thomson Res | -6 | -17 | -54 | -22 | 0.065 | $ 36,103,298.92 |
| TAM | Tanami Gold NL | -6 | -10 | -11 | -13 | 0.065 | $ 76,381,307.99 |
| KLA | Kirkland Lake Gold | -6 | -2 | -3 | -5 | 53.57 | $ 53,760,000.00 |
| WMC | Wiluna Mining Corp | -6 | 3 | 1 | -29 | 1.04 | $ 199,873,968.08 |
| NWM | Norwest Minerals | -6 | 3 | -8 | -11 | 0.079 | $ 14,267,974.73 |
| ALK | Alkane Resources | -6 | -10 | -19 | -26 | 0.785 | $ 452,643,399.20 |
| BMO | Bastion Minerals | -6 | -18 | 18 | 0.23 | $ 16,543,729.80 | |
| IDA | Indiana Resources | -6 | 11 | -23 | 2 | 0.061 | $ 26,531,764.56 |
| GSM | Golden State Mining | -6 | -13 | -48 | -60 | 0.091 | $ 7,561,006.64 |
| NSM | Northstaw | -6 | 5 | -2 | -36 | 0.3 | $ 12,038,100.00 |
| GSN | Great Southern | -6 | -14 | 12 | -19 | 0.059 | $ 31,859,126.46 |
| RED | Red 5 Limited | -7 | 4 | 50 | -3 | 0.255 | $ 612,653,769.52 |
| DEG | De Grey Mining | -6 | 5 | -26 | 8 | 1.17 | $ 1,624,419,171.38 |
| THR | Thor Mining PLC | -7 | -18 | -13 | -26 | 0.014 | $ 8,949,323.39 |
| CDR | Codrus Minerals | -7 | 4 | 0.14 | $ 5,800,000.00 | ||
| MDI | Middle Island Res | -7 | -1 | -11 | -64 | 0.098 | $ 11,996,985.76 |
| BAT | Battery Minerals | -7 | 8 | -33 | -36 | 0.014 | $ 29,444,835.46 |
| POL | Polymetals Resources | -7 | 0 | 0.14 | $ 5,714,358.36 | ||
| OKU | Oklo Resources | -7 | 4 | 12 | -39 | 0.14 | $ 70,564,173.68 |
| RDS | Redstone Resources | -7 | -7 | -18 | 17 | 0.014 | $ 9,346,987.82 |
| NAG | Nagambie Resources | -7 | -13 | -1 | 46 | 0.07 | $ 34,995,264.22 |
| BGL | Bellevue Gold | -7 | -11 | -12 | -43 | 0.765 | $ 788,869,285.97 |
| GBR | Greatbould Resources | -7 | 0 | 29 | 157 | 0.135 | $ 46,440,655.17 |
| KAI | Kairos Minerals | -7 | -7 | -27 | -23 | 0.027 | $ 45,424,995.78 |
| KAU | Kaiser Reef | -7 | -2 | -33 | -51 | 0.2 | $ 23,872,039.23 |
| HRZ | Horizon | -7 | 4 | -4 | 24 | 0.13 | $ 73,836,776.00 |
| CAI | Calidus Resources | -7 | -3 | 22 | -4 | 0.585 | $ 234,057,533.00 |
| CDT | Castle Minerals | -7 | 44 | 63 | 160 | 0.026 | $ 21,983,616.28 |
| RSG | Resolute Mining | -7 | -15 | -42 | -56 | 0.3475 | $ 380,856,374.40 |
| MXR | Maximus Resources | -7 | -19 | -20 | -57 | 0.063 | $ 19,072,081.92 |
| EVN | Evolution Mining | -7 | 6 | -29 | -27 | 3.76 | $ 7,057,079,579.55 |
| AXE | Archer Materials | -7 | -22 | 61 | 122 | 1.19 | $ 293,367,140.30 |
| CXU | Cauldron Energy | -7 | -4 | -40 | -22 | 0.025 | $ 12,282,340.75 |
| RDT | Red Dirt Metals | -8 | -2 | 366 | 125 | 0.675 | $ 169,645,407.88 |
| ALY | Alchemy Resource | -8 | -8 | -28 | -39 | 0.012 | $ 11,428,138.68 |
| HXG | Hexagon Energy | -8 | -18 | -6 | 39 | 0.082 | $ 36,573,133.81 |
| OBM | Ora Banda Mining | -8 | -13 | -67 | -76 | 0.07 | $ 68,195,715.35 |
| SLR | Silver Lake Resource | -8 | -7 | -19 | -16 | 1.55 | $ 1,412,207,087.34 |
| VAN | Vango Mining | -8 | -8 | -14 | -17 | 0.057 | $ 73,076,382.66 |
| AVW | Avira Resources | -8 | -8 | -8 | -35 | 0.0055 | $ 9,453,345.00 |
| LCY | Legacy Iron Ore | -8 | 69 | 38 | 267 | 0.022 | $ 134,499,508.86 |
| PDI | Predictive Disc | -8 | 19 | 100 | 286 | 0.22 | $ 300,120,174.64 |
| BRV | Big River Gold | -8 | -14 | -41 | -53 | 0.22 | $ 48,277,339.44 |
| MAT | Matsa Resources | -9 | -12 | -36 | -56 | 0.053 | $ 19,340,349.48 |
| ZAG | Zuleika Gold | -9 | 5 | -45 | -67 | 0.021 | $ 7,791,774.09 |
| GML | Gateway Mining | -9 | -9 | -30 | -47 | 0.0155 | $ 34,728,372.65 |
| BDCDB | Bardoc Gold | -9 | -12 | -21 | -21 | 0.35 | $ 101,223,347.05 |
| SBM | St Barbara Limited | -9 | -10 | -33 | -51 | 1.2625 | $ 918,837,528.46 |
| SBR | Sabre Resources | -9 | 0 | 0 | -55 | 0.005 | $ 8,446,568.25 |
| STK | Strickland Metals | -9 | -17 | 130 | 30 | 0.069 | $ 83,854,365.43 |
| SAU | Southern Gold | -9 | -16 | -21 | -41 | 0.059 | $ 12,586,396.60 |
| CEL | Challenger Exp | -10 | 6 | -2 | 36 | 0.285 | $ 287,454,025.38 |
| LRL | Labyrinth Resources | -10 | -3 | -27 | 46 | 0.038 | $ 30,434,641.97 |
| NST | Northern Star | -10 | -2 | -23 | -32 | 8.84 | $ 10,539,731,350.95 |
| OZM | Ozaurum Resources | -10 | -10 | -18 | 0.135 | $ 7,724,160.00 | |
| TG1 | Techgen Metals | -10 | -8 | -22 | 0.175 | $ 7,837,589.88 | |
| XAM | Xanadu Mines | -10 | -4 | -43 | -30 | 0.026 | $ 33,994,019.25 |
| CHZ | Chesser Resources | -10 | -7 | -10 | -42 | 0.13 | $ 62,841,976.88 |
| AQI | Alicanto Min | -10 | -16 | -7 | 4 | 0.13 | $ 49,752,770.21 |
| KTA | Krakatoa Resources | -11 | -16 | -6 | -22 | 0.051 | $ 14,735,495.85 |
| ARN | Aldoro Resources | -11 | -26 | 31 | 170 | 0.405 | $ 37,788,275.33 |
| WGX | Westgold Resources. | -11 | -2 | -18 | -28 | 1.845 | $ 776,530,502.95 |
| MBK | Metal Bank | -11 | 0 | -7 | -24 | 0.008 | $ 9,512,546.43 |
| A8G | Australasian Metals | -11 | -27 | 159 | 0.44 | $ 17,039,164.89 | |
| TAR | Taruga Minerals | -11 | -9 | -57 | -22 | 0.04 | $ 20,482,400.24 |
| DTR | Dateline Resources | -11 | -8 | -1 | 58 | 0.079 | $ 34,596,608.65 |
| GOR | Gold Road Res | -11 | -2 | -12 | 4 | 1.335 | $ 1,194,839,055.56 |
| S2R | S2 Resources | -11 | 22 | 22 | -25 | 0.195 | $ 67,711,222.45 |
| NES | Nelson Resources. | -11 | -26 | -48 | -50 | 0.031 | $ 6,023,058.05 |
| TLM | Talisman Mining | -11 | 7 | -30 | 41 | 0.155 | $ 29,099,622.04 |
| BEZ | Besragoldinc | -12 | -18 | 0.115 | $ 19,762,745.40 | ||
| PRU | Perseus Mining | -12 | -6 | 5 | 24 | 1.475 | $ 1,852,950,550.70 |
| SPQ | Superior Resources | -12 | 0 | 36 | -6 | 0.015 | $ 27,685,388.54 |
| PUR | Pursuit Minerals | -12 | -21 | -62 | 36 | 0.03 | $ 29,984,445.31 |
| RMS | Ramelius Resources | -12 | -9 | -26 | -18 | 1.4575 | $ 1,280,739,214.50 |
| PKO | Peako Limited | -12 | -4 | -37 | 0 | 0.022 | $ 6,785,990.22 |
| ICG | Inca Minerals | -12 | -36 | -42 | 50 | 0.087 | $ 42,323,152.70 |
| A1G | African Gold . | -12 | -22 | -27 | 11 | 0.18 | $ 21,403,859.04 |
| AZL | Arizona Lithium | -12 | -20 | 229 | 820 | 0.092 | $ 180,741,438.41 |
| OAU | Ora Gold Limited | -13 | 6 | -33 | -36 | 0.014 | $ 12,631,428.33 |
| GNM | Great Northern | -13 | -13 | -56 | -59 | 0.007 | $ 8,463,356.83 |
| KRM | Kingsrose Mining | -13 | 21 | 29 | 105 | 0.076 | $ 56,732,975.37 |
| BTR | Brightstar Resources | -13 | 2 | 37 | -31 | 0.048 | $ 26,249,321.71 |
| RRL | Regis Resources | -13 | -13 | -35 | -56 | 1.6725 | $ 1,301,989,114.05 |
| M24 | Mamba Exploration | -14 | -7 | -30 | 0.19 | $ 7,400,000.00 | |
| TRM | Truscott Mining Corp | -14 | 3 | -9 | 50 | 0.03 | $ 4,558,246.32 |
| DEX | Duke Exploration | -14 | -5 | -57 | -52 | 0.18 | $ 17,591,174.64 |
| DLC | Delecta Limited | -14 | -20 | 100 | 100 | 0.012 | $ 14,458,904.46 |
| KNB | Koonenberrygold | -14 | -14 | 0.15 | $ 11,117,434.20 | ||
| AWJ | Auric Mining | -15 | -4 | -26 | 0.115 | $ 6,447,976.06 | |
| AZS | Azure Minerals | -16 | -21 | 19 | -62 | 0.32 | $ 97,881,752.12 |
| ENR | Encounter Resources | -16 | -35 | -18 | -15 | 0.13 | $ 44,354,355.64 |
| SNG | Siren Gold | -16 | -10 | -13 | -58 | 0.305 | $ 25,316,283.75 |
| STN | Saturn Metals | -17 | -2 | -6 | -38 | 0.45 | $ 50,887,129.50 |
| E2M | E2 Metals | -17 | 23 | -9 | -57 | 0.29 | $ 42,131,939.64 |
| PNM | Pacific Nickel Mines | -20 | -37 | 52 | 43 | 0.076 | $ 18,621,811.76 |
| AYM | Australia United Min | -20 | -20 | 14 | -11 | 0.008 | $ 14,740,619.88 |
| BRB | Breaker Res NL | -21 | -17 | 62 | 62 | 0.3 | $ 94,493,869.41 |
| ANL | Amani Gold | -25 | -40 | 50 | 50 | 0.0015 | $ 32,813,346.16 |
Weekly stock focus
Dacian Gold (ASX:DCN) has returned to the market chasing cash for its Mt Morgans gold mine near Laverton in WA’s Goldfields.
The $200 million capped gold miner entered a trading halt seeking $20 million in a fully underwritten raising to complete pre-stripping at its “thicker, higher grading” ‘Doublejay’ orebody by March 2022.
Dacian will have cash and gold on hand before costs of $36.8m.
The gold miner produced 15,819oz at an AISC of $2,362/oz in the September quarter, with FY2022 guidance of 100,000-110,000oz at an AISC of $1550-$1700/oz.
Northern Star Resources (ASX:NST) subscribed for a C$154m ($169 million Aussie) convertible note that will give it an exclusive option for a 50% share in Osisko Mining’s Windfall project.
‘Windfall’ is a high-grade exploration and development asset in Canada’s Quebec Province.
It contains an indicated mineral resource of 1.857Moz at an ultra-high grade of 9.6g/t, with a further 4.24Moz at 8g/t in inferred resources.
That would underpin a mine with a 300,000ozpa capacity over its first 7 years, operating at all-in sustaining costs of just US$610/oz.
First production is pencilled in for 2024.
And West African Resources (ASX:WAF) has finalised the acquisition of the 6.8Moz Kiaka gold mine in the hopes of becoming a 400,000ozpa producer by the middle of the decade.
Having kicked off production at the Sanbrado mine in Burkina Faso in March 2020 at the start of the Covid-19 pandemic, WAF is now one of the lowest cost mid-tier gold producers on the ASX.
It is on track to beat the 280,000oz upper end of its production guidance in its first full year of operations in 2021.
Related Topics

Related Stories


UNLOCK INSIGHTS
Discover the untold stories of emerging ASX stocks.
Daily news and expert analysis, it's free to subscribe.
By proceeding, you confirm you understand that we handle personal information in accordance with our Privacy Policy.


