DRC concentrate export ban could put more pressure on global copper, cobalt supply
Pic: Schroptschop / E+ via Getty Images
The Democratic Republic of Congo (DRC) — the world’s leading producer of cobalt and Africa’s biggest copper producer — has made good on a longstanding threat to ban cobalt and copper concentrate exports.
In 2013, the DRC banned concentrate exports to encourage miners to process and refine ore in the country, but insufficient smelting capacity forced it to repeatedly issue ‘waivers’.
However, threat of its future enforcement has been maintained.
In 2019, the government implemented the concentrate ban for just one month before lifting it, saying the waiver would be reviewed every six months.
Its looks like those waivers have not been extended.
Fastmarkets confirmed with three companies operating copper and cobalt mines in DRC that they all received a notice banning concentrate exports.
At present, the trucks carrying copper and cobalt concentrate could still pass through the border, and the effective date of the order is not mentioned, sources told Fastmarkets.
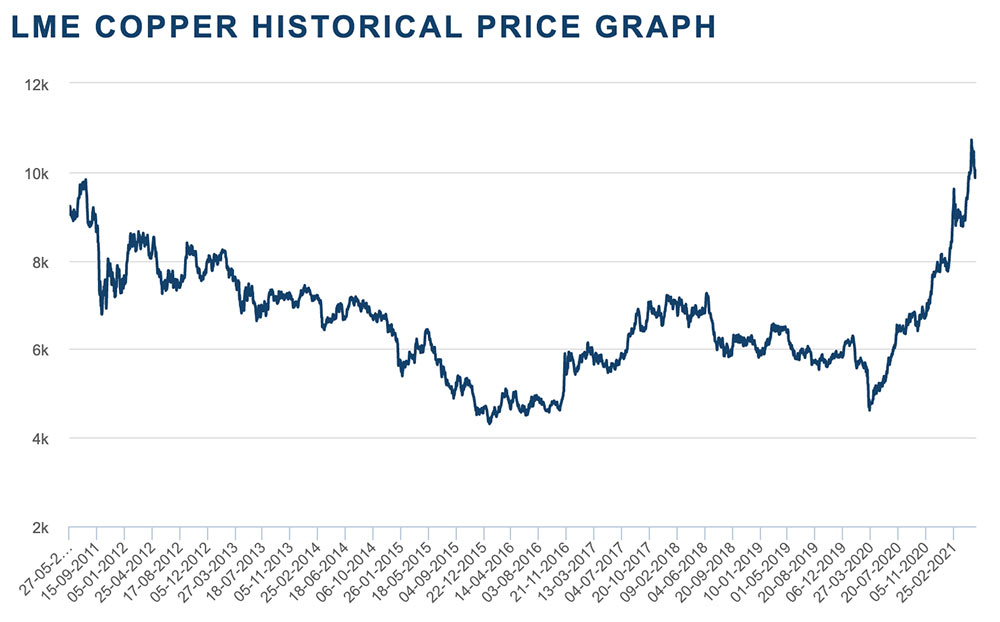
Recent concerns around global copper supply – which could be further hampered by today’s ban, if enforced – have pushed the price up to $US10,032.65/t, close to all-time highs.
Here’s how ASX-listed copper-facing stocks are performing:
Scroll or swipe to reveal table. Click headings to sort. Best viewed on a laptop
| CODE | COMPANY | 1 DAY RETURN % | 1 WEEK RETURN % | 6 MONTH RETURN % | 1 YEAR RETURN % | PRICE | MARKET CAP |
|---|---|---|---|---|---|---|---|
| ALY | Alchemy Resources | 27 | 6 | 6 | 39 | 0.019 | $ 10,083,651.80 |
| TAR | Taruga Minerals | 11 | 27 | 110 | 708 | 0.105 | $ 48,020,268.07 |
| IVR | Investigator Res | 10 | 20 | 93 | 588 | 0.11 | $ 132,394,660.70 |
| LEX | Lefroy Exploration | 10 | 42 | 515 | 530 | 1.26 | $ 138,011,117.05 |
| GED | Golden Deeps | 9 | 20 | -20 | 100 | 0.012 | $ 8,523,365.84 |
| MEP | Minotaur Exploration | 9 | 0 | -31 | 161 | 0.12 | $ 55,147,306.28 |
| HMX | Hammer Metals | 7 | 6 | 184 | 320 | 0.105 | $ 79,051,946.86 |
| CVV | Caravel Minerals | 6 | 33 | 502 | 1900 | 0.5 | $ 163,391,699.11 |
| OAR | OAR Resources | 6 | 55 | -26 | 750 | 0.017 | $ 25,912,807.04 |
| STM | Sunstone Metals | 6 | 0 | 29 | 157 | 0.018 | $ 37,569,789.98 |
| C6C | Copper Mountain | 6 | 2 | 203 | 748 | 4.58 | $ 72,599,577.18 |
| OZL | OZ Minerals | 5 | 1 | 56 | 165 | 25.42 | $ 8,067,071,783.13 |
| RVR | Red River Resources | 5 | 2 | -17 | 255 | 0.22 | $ 108,732,617.07 |
| CCZ | Castillo Copper | 5 | 0 | -4 | 100 | 0.046 | $ 44,851,708.31 |
| AQD | Ausquest Limited | 4 | 14 | 33 | 85 | 0.024 | $ 18,933,366.11 |
| AQI | Alicanto Min | 4 | -4 | -14 | 46 | 0.12 | $ 37,704,758.02 |
| MLX | Metals X Limited | 4 | 4 | 201 | 184 | 0.25 | $ 217,743,856.08 |
| IGO | IGO Limited | 4 | 4 | 60 | 52 | 7.6 | $ 5,528,055,034.90 |
| HAV | Havilah Resources | 4 | -5 | 53 | 174 | 0.26 | $ 76,569,307.00 |
| RIO | Rio Tinto Limited | 4 | 1 | 22 | 36 | 124.61 | $ 44,497,687,572.18 |
| AML | Aeon Metals . | 4 | 19 | -36 | -7 | 0.083 | $ 54,205,578.16 |
| AZS | Azure Minerals | 4 | 11 | -70 | 221 | 0.295 | $ 87,804,430.49 |
| AQX | Alice Queen | 3 | 3 | -45 | -38 | 0.0155 | $ 18,548,799.68 |
| SFR | Sandfire Resources | 3 | -1 | 61 | 54 | 7.16 | $ 1,235,281,737.69 |
| CYM | Cyprium Metals | 3 | -6 | 41 | 132 | 0.325 | $ 172,799,302.41 |
| BHP | BHP Group Limited | 3 | 0 | 24 | 40 | 48.16 | $ 137,865,845,239.20 |
| ORN | Orion Minerals | 3 | 3 | 33 | 125 | 0.036 | $ 144,375,450.80 |
| REE | Rarex Limited | 3 | 4 | -30 | 53 | 0.0905 | $ 38,231,001.95 |
| HCH | Hot Chili | 3 | 3 | -22 | 153 | 0.038 | $ 114,181,808.82 |
| AOU | Auroch Minerals | 3 | -7 | 22 | 200 | 0.195 | $ 52,920,332.16 |
| VXR | Venturex Resources | 3 | -2 | 410 | 1097 | 0.79 | $ 327,337,659.88 |
| BAT | Battery Minerals | 2 | 5 | -5 | 223 | 0.021 | $ 41,846,107.59 |
| AZY | Antipa Minerals | 2 | 0 | -2 | 77 | 0.046 | $ 139,332,543.21 |
| RCP | Redbank Copper | 2 | -5 | 19 | 400 | 0.095 | $ 47,955,517.89 |
| CNJ | Conico | 2 | -3 | -22 | 222 | 0.029 | $ 25,403,960.67 |
| HGO | Hillgrove Res | 2 | -7 | 58 | 104 | 0.062 | $ 57,155,132.24 |
| KGL | KGL Resources | 1 | -3 | 152 | 337 | 0.7 | $ 270,697,358.28 |
| BYH | Bryah Resources | 1 | 13 | 12 | 48 | 0.077 | $ 11,973,078.61 |
| RXM | Rex Minerals Limited | 1 | -15 | 175 | 413 | 0.385 | $ 160,481,949.60 |
| SGQ | St George Min | 1 | -2 | -35 | -19 | 0.081 | $ 47,135,274.96 |
| NWC | New World Resources | 1 | -9 | 71 | 638 | 0.096 | $ 138,102,294.96 |
| QML | Qmines Limited | 0 | 23 | 0.48 | $ 22,120,207.68 | ||
| TRN | Torrens Mining | 0 | 4 | 0.14 | $ 9,503,821.18 | ||
| TTM | Titan Minerals | 0 | -8 | 0 | 46 | 0.115 | $ 131,037,029.91 |
| IPT | Impact Minerals | 0 | 7 | -27 | 14 | 0.016 | $ 32,380,718.70 |
| DEX | Duke Exploration | 0 | 8 | 14 | 0.415 | $ 25,039,859.57 | |
| MBK | Metal Bank | 0 | 0 | 0 | 28 | 0.011 | $ 13,029,591.34 |
| CBY | Canterbury Resources | 0 | 8 | -3 | 39 | 0.097 | $ 10,850,924.11 |
| GMN | Gold Mountain | 0 | 0 | -7 | -26 | 0.04 | $ 30,708,996.96 |
| AUQ | Alara Resources | 0 | 0 | -17 | 15 | 0.015 | $ 10,581,438.59 |
| ERM | Emmerson Resources | 0 | 11 | 4 | -30 | 0.08 | $ 39,859,079.12 |
| SRI | Sipa Resources | 0 | 4 | -20 | 12 | 0.057 | $ 10,136,158.84 |
| AKN | Auking Mining | 0 | 0 | 0 | 0 | 0.4 | $ 1,865,279.60 |
| ATM | Aneka Tambang | 0 | 0 | 0 | 0 | 1 | $ 1,303,649.00 |
| MCB | MCB Resources | 0 | -100 | -100 | -100 | 0 | $ 1,798,548.64 |
| SVY | Stavely Minerals | 0 | -2 | -34 | 4 | 0.59 | $ 153,967,256.68 |
| DGR | DGR Global | 0 | 3 | -19 | 10 | 0.062 | $ 60,485,881.07 |
| A1M | Aic Mines | 0 | 5 | -26 | -9 | 0.29 | $ 19,927,355.22 |
| AMG | Ausmex Mining Gp | 0 | 7 | 26 | 23 | 0.049 | $ 27,160,493.17 |
| CWX | Carawine Resources | 0 | -6 | 0 | 32 | 0.25 | $ 27,222,475.50 |
| PEX | Peel Mining Limited | 0 | 13 | 55 | 142 | 0.34 | $ 142,153,237.38 |
| GRL | Godolphin Resources | 0 | -11 | -31 | -11 | 0.17 | $ 14,298,771.74 |
| ENR | Encounter Resources | 0 | 44 | 15 | 44 | 0.195 | $ 61,534,922.09 |
| BOA | Boadicea Resources | 0 | -5 | 31 | 58 | 0.3 | $ 18,643,723.80 |
| FNT | Frontier Resources | 0 | -13 | 17 | 56 | 0.014 | $ 6,847,427.13 |
| NML | Navarre Minerals | 0 | -12 | -47 | -28 | 0.115 | $ 62,817,847.37 |
| TAS | Tasman Resources | 0 | 3 | -10 | 10 | 0.037 | $ 24,832,633.84 |
| SUH | Southern Hem Min | 0 | 13 | 36 | 479 | 0.043 | $ 10,510,909.55 |
| MAU | Magnetic Resources | 0 | 6 | 28 | 23 | 1.475 | $ 321,584,647.75 |
| CAE | Cannindah Resources | 0 | -6 | 118 | 663 | 0.061 | $ 31,651,800.84 |
| SCI | Silver City Minerals | 0 | 9 | 100 | 118 | 0.036 | $ 19,928,811.71 |
| CHK | Cohiba Min | 0 | 0 | -11 | 100 | 0.016 | $ 22,263,412.05 |
| GTE | Great Western Exp. | 0 | 14 | -22 | 203 | 0.16 | $ 21,791,689.76 |
| COY | Coppermoly Limited | 0 | 0 | 0 | 71 | 0.012 | $ 25,526,567.87 |
| DEV | Devex Resources | 0 | 30 | 22 | 232 | 0.365 | $ 103,168,651.60 |
| AL8 | Alderan Resource | 0 | 0 | -39 | 0 | 0.06 | $ 17,876,465.52 |
| KTA | Krakatoa Resources | -2 | -21 | -11 | 54 | 0.054 | $ 15,342,250.00 |
| ARD | Argent Minerals | -2 | -2 | 13 | 200 | 0.051 | $ 45,563,518.47 |
| ANX | Anax Metals | -2 | -5 | 37 | 222 | 0.093 | $ 33,267,469.55 |
| TLM | Talisman Mining | -2 | -4 | 88 | 145 | 0.225 | $ 42,924,528.55 |
| ALK | Alkane Resources | -2 | 2 | -13 | 1 | 0.88 | $ 535,849,920.00 |
| BOC | Bougainville Copper | -2 | -9 | 127 | 176 | 0.635 | $ 260,690,625.00 |
| CHN | Chalice Mining | -3 | 9 | 119 | 798 | 8.49 | $ 3,019,044,384.27 |
| SLZ | Sultan Resources | -3 | -3 | 5 | 78 | 0.2575 | $ 18,426,613.09 |
| HLX | Helix Resources | -5 | 8 | 320 | 396 | 0.042 | $ 55,198,920.35 |
| EM2 | Eagle Mountain | -5 | -14 | 217 | 567 | 1 | $ 209,511,138.90 |
| AIS | Aeris Resources | -5 | 20 | 143 | 401 | 0.18 | $ 364,693,064.58 |
| PXX | Polarx Limited | -6 | 3 | -3 | 0 | 0.034 | $ 24,187,640.18 |
| RTG | RTG Mining Inc. | -6 | 0 | -6 | 142 | 0.16 | $ 108,714,261.18 |
| KAU | Kaiser Reef | -6 | -11 | -28 | -11 | 0.295 | $ 30,494,631.51 |
| ZNC | Zenith Minerals | -7 | -10 | 112 | 208 | 0.265 | $ 83,892,608.55 |
| ARE | Argonaut Resources | -11 | -6 | 33 | 60 | 0.008 | $ 26,215,843.04 |
| CZN | Corazon | -12 | 6 | -24 | -34 | 0.038 | $ 8,731,328.19 |
| XAM | Xanadu Mines | -17 | -14 | 32 | 14 | 0.05 | $ 75,337,065.00 |
SMALL CAP COPPER STANDOUTS
A review of old VTEM data has identified a 7km-long anomaly corresponding with the high grade ‘Wyacca’ copper discovery at the Mt Craig project in South Australia.
Recent drill results from Wyacca included 5m at 2.4% copper from 17m, including 1m at 9.5% copper.
“This anomaly is open to the east beyond the survey limits, where likely extensions are also contained within Taruga’s Exploration Permit,” Targua chief exec Thomas Line said May 24.
“Here, the intensified anomaly becomes somewhat isolated, and we look forward to targeting this and other newly identified VTEM anomalies in the upcoming RC program.”
INVESTIGATOR RESOURCES (ASX:IVR)
Investigator’s main game is the Paris silver project, but it also has a joint venture over the Pernatty copper project in South Australia.
In April, JV partner DGO Gold (ASX:DGO) hit “Zambian style” copper mineralisation in maiden wide-spaced drilling.
Highlights included 1m @ 2% CuEq (0.82% copper, 0.1% cobalt, & 19.7g/t silver) from 75m.
Follow up drilling was to commence as soon as approvals were granted, DGO says.
Kalgoorlie explorer Lefroy has gained 480% since the ‘Burns’ copper-gold discovery was first made in February.
New drilling has now extended the mineralised porphyry zone to at least 100m below an impressive earlier strike of 8m at 7.63g/t of gold and 0.56 per cent copper from 134m.
It is the first news flow from an accelerated 14-hole, 3000m diamond drill program.
Drilling at the Nosib prospect in Namibia hit thick intervals of copper mineralisation in 13 of the 15 holes completed, the explorer said yesterday.
One hole intersected a 5m interval of semi-massive copper sulphides from only 10m downhole (8.6m below surface).
Copper mineralisation was discovered at Nosib in 1915, with mine access development work between 1917 to 1920.
Underground sampling conducted by Golden Deeps along the development drives pulled up impressive results like 6m at 9.3% copper, 4.72% lead, and 7.92g/t silver.
Current drilling is testing between the previously developed levels, targeting extensions to this high-grade copper-lead-silver-vanadium ore that was sampled.
Related Topics

Related Stories


UNLOCK INSIGHTS
Discover the untold stories of emerging ASX stocks.
Daily news and expert analysis, it's free to subscribe.
By proceeding, you confirm you understand that we handle personal information in accordance with our Privacy Policy.


