Chart of the Day: Did the crypto plunge cause the gold bull flag breakout?

Chart of the Day - Spot gold price. Picture: Getty Images
Gold is heading up, and it is one cracker of a chart.
Let’s start with the classic double bottom, dating back to March and April of this year.
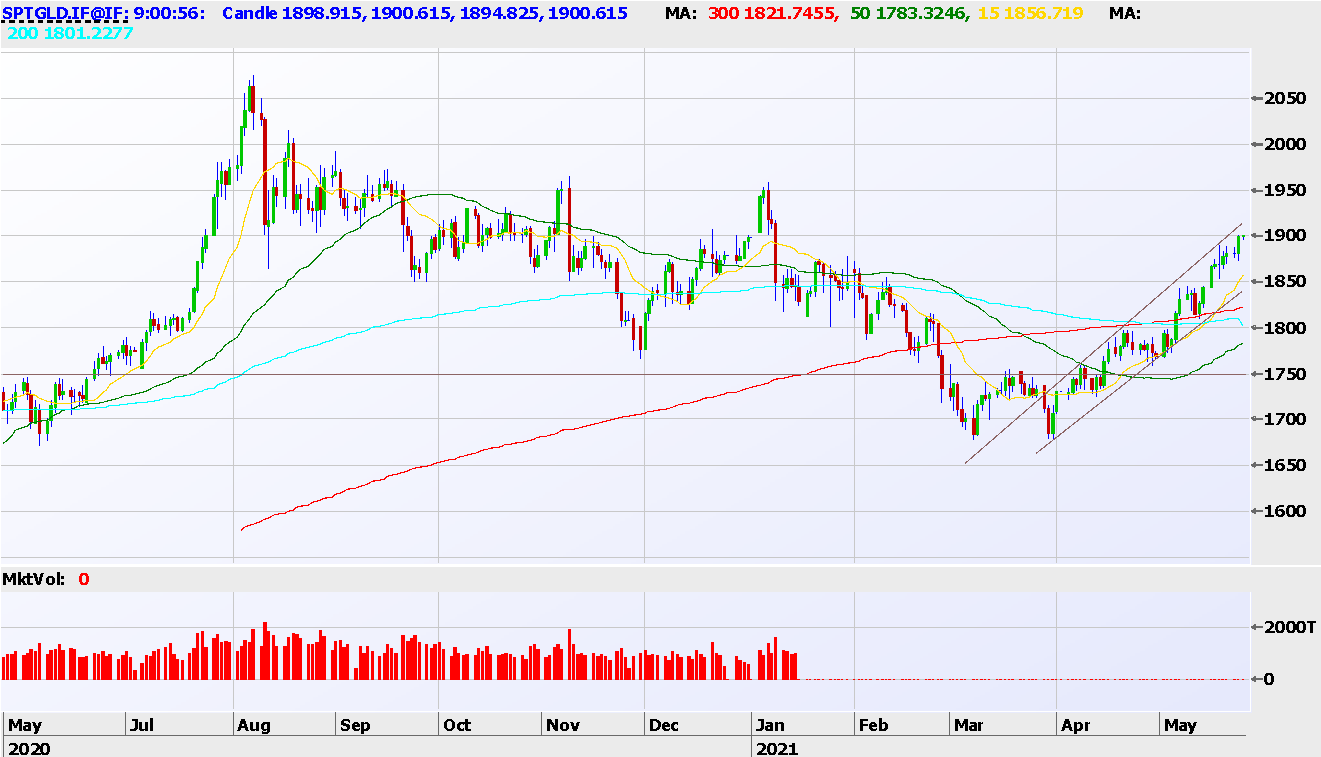
That’s textbook, right there at $1750/oz, and if one waited for confirmation that the double bottom was in before buying, there really hasn’t been a whole lot of pain since.
More recently, the 1750-1800/oz zone resolved favourably as we moved into early May.
Next up came a clean assault on more meaningful resistance at 1800/oz which happened to coincide generally with both the simple (red) and exponential (light blue) moving averages.
Once that was satisfied and overcome on May 6 and 7, there was a desirable re-test of those averages on May 12 and 13.
After the re-test held, it has been pretty much non-stop northbound to levels just shy of US$1900/oz at the time of writing.
For all the fantastic punditry that is and will continue to be ascribed to gold and its role in financial markets, I find little incentive to extend the analysis beyond that of real yields, given their exceedingly strong correlation in recent years.
Of course, in delightful contradiction to what I just wrote, the heat coming out of crypto markets short term I would imagine has also played a part in recent days, as we think about the nature of the marginal buyer for this asset class, and their likely motives.
Another interesting exercise is to go back and have a look at where your favourite gold stocks on the ASX were trading when gold first hit US$1900/oz in July 2020 during that bull run.
You might be surprised!
There are obviously a host of ways to play the space, the IMA is certainly involved, and will continue to be whilst the price action remains this progressive.
Steve Collette of Collette Capital Pty Ltd (ABN 56645766507) is a Corporate Authorised Representative (No. 1284431) of Sanlam Private Wealth (AFS License No. 337927), which only provides general advice.
Collette Capital only makes services available to professional and sophisticated investors as defined by the Corporations Act, Section (s)708(8)C and 761G(7)C.
The Collette Capital Wholesale IMA Strategy has returned +24.57% p.a. net of all fees as at the end of February 2021 since inception in January 2015 (using the Time Weighted Return method of calculating returns).
Learn more at www.collette.capital
Related Topics

Related Stories


UNLOCK INSIGHTS
Discover the untold stories of emerging ASX stocks.
Daily news and expert analysis, it's free to subscribe.
By proceeding, you confirm you understand that we handle personal information in accordance with our Privacy Policy.


