Bulk Buys: The Grosvenor fire should be bullish for met coal, but prices have been falling

Pic: Getty Images
- Met coal prices slide as Grosvenor fire supply threat fails to offset weak steel demand picture
- Grange Resources ups sale price on high-grade iron ore
- But iron ore benchmark slides worrying to a touch above US$100/t
The closure of Anglo American’s Grosvenor mine prompted a sharp rise in futures prices for steelmaking coal after the fire that halted one of Queensland’s premier coking coal operations.
Force Majeure came later in the week, as Anglo flagged with its customers it would not be able to deliver into some December quarter contracts after stockpiles from Grosvenor were wound down.
That prompted many analysts to go bull on coking coal. Goldman Sachs tipped US$300/t for premium hard coking coal in the September quarter.
They lifted long-term forecasts from US$205/t to US$220/t thanks to higher costs and Queensland royalty rates and Morgan Stanley tipped US$290/t by year’s end.
Whitehaven Coal (ASX:WHC), which delivered its first quarterly results last week with the formerly BHP (ASX:BHP)-owned Daunia and Blackwater steelmaking coal mines in its stable, was also bullish on the long-term outlook.
“The expected structural shortfall in global metallurgical coal production, particularly due to long-term production constraints of HCC from Australian producers, combined with increased seaborne demand from India, is anticipated to drive higher metallurgical coal prices over the near- and long-term,” WHC said.
“While the relativities for PCI and SSCC to PLV HCC are below historical averages, favourable absolute prices are being realised.
“Recent disruptions in the supply of steel making coal add to the increasing volatility of the market prices for metallurgical coal.”
But prices have, ironically, gone the other way thanks to concerns around China’s steel demand, which have also put the kibosh on iron ore.
On Monday coking coal futures tracked down 1.8% to US$224/t, below their levels in the lead up to the Grosvenor fire.
Prices under pressure
Fitch’s BMI Commodity Insights has maintained its forecast for high quality coking coal to collect US$260/t, but says prices are coming under pressure due to flailing steel demand.
“We maintain our 2024 coking coal price forecast for Australian premium hard coking coal at an annual average of $US260/t, as prices remain under continued pressure in H2 2024 over weak demand from poor steel production growth,” its analysts said in a note this week.
“2024 has cemented negative investor sentiment over Mainland China’s construction industry, the downfall of which now looks irreversible in the coming 2-3 years at least.
“As Mainland China’s construction industry holds the reigns on coking coal demand through the steel industry (which in turn remains in doldrums), we see little revival in coking coal prices in the coming months. Australia premium hard coking coal prices are hovering around US$242/t at the time of writing on July 21, and we expect further pressure in the months ahead.
“Prices have averaged US$275/t in the year-to-date, and we continue to expect prices to remain in the range of US$220-250/t in 2024. Slowing steel production growth in importing nations (except India) will continue to cap coking coal demand, and thus prices in 2024.”
India is now the largest customer for Australian coalminers BHP and Coronado, but its 10 year high shipment rate has benefitted Russian and US miners more than Australian ones.
Their market share in India has dropped from 81% in 2018 to 59% in FY24.
“Throughout FY2024, Russian coking coal was sold at discounts of 20-25%, while Indian mills also started re-calibrating their furnaces to ensure a better mix of high-ash content coal coming in from Russia,” BMI said.
“Russia has successfully displaced countries including Mozambique and Canada to move up as the third largest supplier of coking coal to India. Strong infrastructure and construction demand is supporting the domestic steel market in India, and will continue to do so in the remaining months of 2024.”
Discounted Russian supplies of lower grade coals like PCI and semi-soft have resulted in sliding realisations for those grades shipped by Aussie miners.
Longer term BMI sees coking coal remaining high by historical standards from 2024-2028, but believes it will see waning demand as green steel production expands longer term, with BMI forecasting prices to drop to US$130/t by 2029.
Thermal coal has been rangebound this year and continues to be so, with front month Newcastle futures trading for around US$135/t.
ASX coal stocks
Scroll or swipe to reveal table. Click headings to sort.
| CODE | COMPANY | PRICE | WEEK RETURN % | MONTH RETURN % | 6 MONTH RETURN % | YEAR RETURN % | YTD % | MARKET CAP |
|---|---|---|---|---|---|---|---|---|
| NAE | New Age Exploration | 0.0035 | 17% | 17% | -30% | -36% | -42% | $ 7,175,595.64 |
| CKA | Cokal Ltd | 0.086 | -2% | -12% | -18% | -22% | -28% | $ 90,631,714.32 |
| BCB | Bowen Coal Limited | 0.048 | -4% | -21% | -38% | -65% | -52% | $ 142,400,274.90 |
| SVG | Savannah Goldfields | 0.035 | -15% | 75% | -8% | -62% | -30% | $ 9,556,887.14 |
| GRX | Greenx Metals Ltd | 0.82 | -7% | -8% | -11% | -12% | -11% | $ 235,671,372.04 |
| AKM | Aspire Mining Ltd | 0.3 | -20% | -13% | 50% | 305% | 186% | $ 152,291,095.50 |
| AVM | Advance Metals Ltd | 0.029 | 4% | 21% | -13% | -78% | -21% | $ 3,926,960.85 |
| YAL | Yancoal Aust Ltd | 6.88 | -4% | 10% | 26% | 38% | 39% | $ 8,978,988,171.60 |
| NHC | New Hope Corporation | 4.67 | -5% | -2% | -11% | -10% | -9% | $ 3,981,530,035.44 |
| TIG | Tigers Realm Coal | 0.0035 | -13% | 17% | -30% | -30% | -36% | $ 52,266,809.47 |
| SMR | Stanmore Resources | 3.7 | -6% | 5% | -9% | 35% | -8% | $ 3,398,246,460.18 |
| WHC | Whitehaven Coal | 7.91 | -7% | -1% | 0% | 13% | 6% | $ 6,684,440,264.16 |
| BRL | Bathurst Res Ltd. | 0.81 | -1% | 1% | -13% | -18% | -16% | $ 153,087,824.00 |
| CRN | Coronado Global Res | 1.275 | -11% | 6% | -22% | -23% | -28% | $ 2,171,007,580.35 |
| JAL | Jameson Resources | 0.06 | 0% | 71% | 88% | 20% | 33% | $ 29,343,847.32 |
| TER | Terracom Ltd | 0.2 | -7% | -11% | -45% | -52% | -52% | $ 168,202,909.35 |
| ATU | Atrum Coal Ltd | 0.004526 | 0% | 0% | 0% | 0% | 0% | $ 11,966,853.96 |
| MCM | Mc Mining Ltd | 0.14 | 0% | -7% | 8% | -7% | -7% | $ 57,961,868.86 |
| DBI | Dalrymple Bay | 3.03 | 0% | 3% | 10% | 10% | 13% | $ 1,502,157,851.01 |
| AQC | Auspaccoal Ltd | 0.095 | 1% | 42% | 0% | -34% | -5% | $ 50,711,087.78 |
Grange reports higher prices
The final big dogs in the iron ore game to report will be arriving this week with Fortescue (ASX:FMG) due for a very intriguing quarterly call tomorrow after announcing a 700-person job slashing last week. Andrew Forrest will either front analysts to pick over the scaleback of FMG’s green energy ambitions or be conspicuous by his absence.
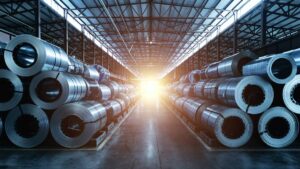
Singapore iron ore prices plunged below US$100/t yesterday, dropping over 3.5% to US$99.41/t, after muted support for the struggling Chinese property sector at Beijing’s Third Plenum meetings last week.
The country’s indolence has forced China into a chastening rate cut to try stir its slothful economy off the couch, doomscrolling through TikTok, and into action.
China Daily said financial institutions were upbeat on the country’s economy. This Dalian iron ore chart suggests traders think otherwise.

On Friday, sometimes lithium, sometimes iron ore, all times interesting miner Mineral Resources (ASX:MIN) will be on the bill.
Until then we have smaller players to keep us busy. One was Grange Resources (ASX:GRR) which, interestingly, saw prices rise from US$108.11/t in the March quarter to US$134.69/t in the June quarter despite a falling benchmark.
Translating to $206.11/t Australian, Grange enjoyed a drop in cash operating costs from $161.70/t to $145.05/t after concentrate production lifted from 586,000t to 675,000t due to better milling performance.
That saw Grange’s cash and liquid investments rise from $271.96m at March 31 to $289.55m and $5.37m at June 30 (though it did have $30.37m of trade receivables at the end of March).
Grange spent $22.7m on capex, completing an underground exploration decline at its Savage River magnetite mine, upgrading accommodation in the Savage River townsite and replacing two 777 trucks on its ROM.
GRR produces a high grade magnetite concentrate, typically used as a blending product with lower grade ores or sold to mills looking to produce via the lower emissions DRI pathway.
That gets it a premium over 62% Fe prices, though they have been less pronounced in the past two years because of weak margins at steel mills, who have preferred lower grade feedstock to save on costs.
ASX iron ore stocks
Scroll or swipe to reveal table. Click headings to sort.
| CODE | COMPANY | PRICE | WEEK RETURN % | MONTH RETURN % | 6 MONTH RETURN % | YEAR RETURN % | YTD % | MARKET CAP |
|---|---|---|---|---|---|---|---|---|
| ACS | Accent Resources NL | 0.007 | 0% | 0% | 0% | -36% | -13% | $ 3,311,890.98 |
| ADY | Admiralty Resources. | 0.011 | -8% | 22% | 83% | 57% | 57% | $ 17,924,213.34 |
| AKO | Akora Resources | 0.15 | 7% | 7% | 12% | -24% | 1% | $ 18,073,106.40 |
| BCK | Brockman Mining Ltd | 0.024 | 0% | 33% | -4% | -23% | -14% | $ 222,725,571.14 |
| BHP | BHP Group Limited | 41.46 | -5% | -3% | -10% | -8% | -18% | $ 211,178,543,219.88 |
| CIA | Champion Iron Ltd | 6 | -7% | -6% | -22% | 4% | -28% | $ 3,165,597,116.11 |
| CZR | CZR Resources Ltd | 0.26 | -5% | -13% | -21% | 63% | 24% | $ 61,291,007.96 |
| DRE | Dreadnought Resources Ltd | 0.023 | 5% | -12% | -8% | -62% | -23% | $ 77,287,605.12 |
| EFE | Eastern Resources | 0.005 | 25% | -17% | -29% | -55% | -38% | $ 6,209,732.31 |
| CUF | Cufe Ltd | 0.012 | -8% | -8% | -25% | -20% | -14% | $ 17,376,773.25 |
| FEX | Fenix Resources Ltd | 0.39 | 3% | 20% | 47% | 26% | 37% | $ 267,427,899.20 |
| FMG | Fortescue Ltd | 21.21 | -6% | -2% | -24% | -6% | -27% | $ 66,259,325,035.36 |
| RHK | Red Hawk Mining Ltd | 0.865 | 2% | -1% | 44% | 85% | 46% | $ 172,836,929.34 |
| GEN | Genmin | 0.135 | 13% | 13% | -16% | -16% | -16% | $ 95,932,121.04 |
| GRR | Grange Resources. | 0.34 | -11% | -3% | -21% | -40% | -27% | $ 405,068,544.30 |
| GWR | GWR Group Ltd | 0.08 | 0% | -8% | -5% | -1% | -16% | $ 25,697,332.40 |
| HAV | Havilah Resources | 0.2 | -18% | 18% | 25% | -17% | 3% | $ 66,494,234.10 |
| HAW | Hawthorn Resources | 0.069 | 15% | 6% | -30% | -52% | -26% | $ 21,776,014.85 |
| HIO | Hawsons Iron Ltd | 0.026 | 0% | -4% | -38% | -37% | -45% | $ 27,445,536.94 |
| IRD | Iron Road Ltd | 0.075 | -3% | -3% | 12% | -15% | 12% | $ 63,241,468.38 |
| JNO | Juno | 0.031 | 3% | -18% | -67% | -61% | -72% | $ 5,640,303.06 |
| LCY | Legacy Iron Ore | 0.018 | 29% | 38% | 0% | -5% | 6% | $ 123,416,772.19 |
| MAG | Magmatic Resrce Ltd | 0.062 | -23% | -2% | 59% | -23% | 27% | $ 26,691,245.70 |
| MDX | Mindax Limited | 0.052 | 8% | 8% | -2% | -21% | -13% | $ 106,536,756.56 |
| MGT | Magnetite Mines | 0.295 | -3% | -6% | 8% | -30% | -5% | $ 28,053,886.08 |
| MGU | Magnum Mining & Exp | 0.013 | 0% | -13% | -35% | -75% | -54% | $ 10,521,698.24 |
| MGX | Mount Gibson Iron | 0.375 | -13% | -11% | -29% | -19% | -32% | $ 462,975,102.54 |
| MIN | Mineral Resources. | 54.42 | -6% | -2% | 4% | -22% | -22% | $ 10,765,289,127.12 |
| MIO | Macarthur Minerals | 0.064 | 7% | -2% | -53% | -67% | -49% | $ 11,011,954.43 |
| PFE | Panteraminerals | 0.031 | -6% | -3% | -38% | -61% | -40% | $ 14,023,988.31 |
| PLG | Pearlgullironlimited | 0.017 | -6% | -11% | -43% | -47% | -43% | $ 3,477,210.43 |
| RHI | Red Hill Minerals | 5.55 | -3% | 4% | 37% | 56% | 37% | $ 359,114,700.00 |
| RIO | Rio Tinto Limited | 113.81 | -5% | -5% | -11% | -3% | -16% | $ 42,485,695,692.30 |
| RLC | Reedy Lagoon Corp. | 0.003 | 0% | 0% | -40% | -66% | -40% | $ 1,858,622.20 |
| CTN | Catalina Resources | 0.0025 | -17% | -17% | -17% | -50% | -44% | $ 3,096,217.23 |
| SRK | Strike Resources | 0.035 | 0% | -10% | -17% | -50% | -29% | $ 9,931,250.00 |
| SRN | Surefire Rescs NL | 0.007 | 8% | -13% | -22% | -59% | -18% | $ 12,911,000.78 |
| TI1 | Tombador Iron | 0.014 | 0% | 0% | 0% | -36% | 0% | $ 30,218,753.22 |
| TLM | Talisman Mining | 0.265 | 0% | -2% | 13% | 77% | 13% | $ 48,963,290.74 |
| EQN | Equinoxresources | 0.31 | -5% | -16% | 3% | 138% | 3% | $ 38,285,000.93 |
| AMD | Arrow Minerals | 0.003 | 0% | 0% | -40% | -25% | -40% | $ 36,887,777.84 |
| CTM | Centaurus Metals Ltd | 0.36 | -9% | -23% | 13% | -59% | -33% | $ 171,194,406.15 |
UNLOCK INSIGHTS
Discover the untold stories of emerging ASX stocks.
Daily news and expert analysis, it's free to subscribe.
By proceeding, you confirm you understand that we handle personal information in accordance with our Privacy Policy.


