Bulk Buys: Covid Zero policy the bull in China shop for steel market
Pic: vicnt/iStock via Getty Images
- China’s Covid Zero policy has seen analysts knock down economic forecasts
- Bad news for sentiment in steel and raw materials, with iron ore futures tumbling in afternoon trade
- Coal prices remain freaking high
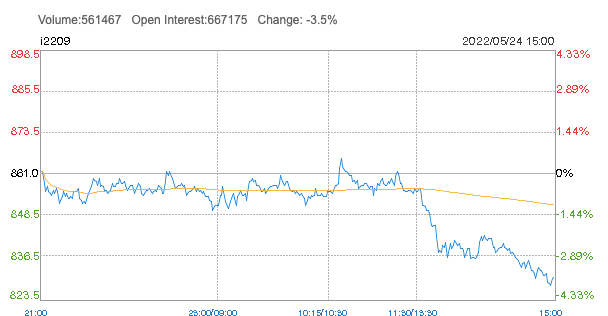
A precipitous slide in Asian iron ore futures yesterday reflected growing nervousness about the outlook for China’s economic recovery.
Dalian iron ore tumbled from 1.30pm, engineering a tank to a 3.5% loss akin to the 336-second collapse from Steven Gerrard’s Aston Villa that handed Manchester City Premier League glory on Sunday.
Singapore was little better, off 3.92% to US$128.65/t after a week of trade symbolised by hopes China was through the worst of its pandemic lockdowns.
The jitters flowed through onto the Aussie stock market, where impressive early gains for the materials sector led by iron ore miners like MinRes (ASX:MIN), Rio Tinto (ASX:RIO) and Fortescue Metals Group (ASX:FMG) were pared back in afternoon trade.
The Chinese economy is the canary in the coal mine for Australian iron ore producers, given it produces ~60% of the world’s steel and is the recipient of more than 80% of iron ore exports from the big boys up in the Pilbara.
Its infrastructure and property sectors respectively are believed to account for around 60% of downstream steel demand, but neither can fire while large pockets of the country are locked up at home.
Yesterday JP Morgan and UBS knocked down their economic growth forecasts for China as its Covid Zero policy persists, with UBS reducing its prediction from 4.2% to 3% of GDP growth, well below the 5.5% target laid out earlier this year by the Chinese Communist Party.
Outside the steel and iron ore industry Airbnb announced it would stop taking bookings from July 30, suggesting companies were finding it no easier to operate amid the persistent lockdowns.
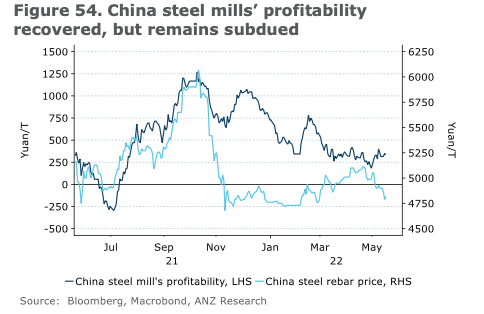
Steel prices down in China
Steel consultancy MySteel reported rebar steel prices in China, which have been under pressure with the lockdowns stalling construction activity, fell US$16/t last week to US$726.54/t.
Hot rolled coil and billet prices also eased, although a crunch on margins caused by high raw materials prices like iron ore and coking coal looks to have eased.
Steel production is also rising, with ANZ Research commodity strategists Soni Kumari and Daniel Hynes saying the first week of May saw 2.3t/day of steel production against 2.2t/day at the start of April.
That has seen port inventories fall towards the ~130Mt range (down from near record levels of around 160Mt earlier this year) even as shipments from Australia and Brazil have increased following a weak first quarter.
Steel inventories though are 3% higher than this point last year on the back of weak demand due to the lockdowns the ANZ analysts noted in a report.
Who’s looking good among the ASX iron ore miners?
| CODE | COMPANY | PRICE | 1 WEEK RETURN % | 1 MONTH RETURN % | 6 MONTH RETURN % | 1 YEAR RETURN % | MARKET CAP |
|---|---|---|---|---|---|---|---|
| ACS | Accent Resources NL | 0.06 | 0% | 0% | 9% | 58% | $ 27,961,636.98 |
| ADY | Admiralty Resources. | 0.016 | 0% | -11% | 7% | -16% | $ 18,250,108.14 |
| AKO | Akora Resources | 0.26 | 21% | -13% | 0% | -10% | $ 15,542,905.10 |
| BCK | Brockman Mining Ltd | 0.042 | -2% | -11% | 2% | -14% | $ 389,769,749.50 |
| BHP | BHP Group Limited | 47.8 | 5% | -1% | 26% | 0% | $ 242,130,918,177.70 |
| CIA | Champion Iron Ltd | 7.81 | 16% | 4% | 71% | 13% | $ 3,977,911,445.20 |
| CZR | CZR Resources Ltd | 0.014 | 0% | -13% | 100% | -7% | $ 55,781,172.43 |
| DRE | Dreadnought Resources Ltd | 0.042 | 8% | -5% | -11% | 62% | $ 122,063,392.69 |
| EFE | Eastern Resources | 0.036 | -3% | -28% | -51% | 157% | $ 37,788,591.98 |
| CUF | Cufe Ltd | 0.027 | 4% | -16% | -18% | -47% | $ 26,841,146.22 |
| FEX | Fenix Resources Ltd | 0.33 | 16% | -3% | 35% | 3% | $ 154,864,176.00 |
| FMG | Fortescue Metals Grp | 20.77 | 10% | -2% | 20% | -7% | $ 63,765,363,451.78 |
| FMS | Flinders Mines Ltd | 0.42 | -11% | -21% | -36% | -53% | $ 71,760,645.23 |
| GEN | Genmin | 0.2 | 0% | 0% | 25% | -26% | $ 56,657,570.00 |
| GRR | Grange Resources. | 1.69 | 34% | 28% | 236% | 286% | $ 1,851,741,916.80 |
| GWR | GWR Group Ltd | 0.125 | 0% | -24% | 4% | -56% | $ 40,152,081.88 |
| HAV | Havilah Resources | 0.265 | 56% | 43% | 36% | -4% | $ 82,098,790.61 |
| HAW | Hawthorn Resources | 0.12 | 4% | -23% | 35% | 145% | $ 38,354,295.50 |
| HIO | Hawsons Iron Ltd | 0.58 | -14% | -2% | 552% | 490% | $ 429,031,770.00 |
| IRD | Iron Road Ltd | 0.175 | 0% | -3% | -19% | -10% | $ 139,744,728.20 |
| JNO | Juno | 0.115 | 10% | -12% | -12% | -41% | $ 15,600,670.12 |
| LCY | Legacy Iron Ore | 0.024 | 9% | -14% | -11% | 60% | $ 153,763,828.78 |
| MAG | Magmatic Resrce Ltd | 0.072 | 4% | -15% | -27% | -67% | $ 16,796,128.67 |
| MDX | Mindax Limited | 0.059 | 0% | 0% | 23% | -9% | $ 112,672,163.12 |
| MGT | Magnetite Mines | 0.023 | -12% | -26% | 0% | -60% | $ 94,792,406.68 |
| MGU | Magnum Mining & Exp | 0.058 | -6% | -28% | -31% | -66% | $ 31,249,366.34 |
| MGX | Mount Gibson Iron | 0.7 | 10% | 7% | 73% | -22% | $ 853,450,463.27 |
| MIN | Mineral Resources. | 60.63 | 10% | 0% | 37% | 41% | $ 11,283,963,563.88 |
| MIO | Macarthur Minerals | 0.34 | -3% | -26% | -15% | -22% | $ 58,051,255.68 |
| PFE | Panteraminerals | 0.145 | 21% | -17% | -36% | 0% | $ 7,070,000.00 |
| PLG | Pearlgullironlimited | 0.036 | -31% | -55% | -64% | 0% | $ 2,525,506.17 |
| RHI | Red Hill Iron | 3.62 | -1% | 7% | 32% | 419% | $ 231,057,899.38 |
| RIO | Rio Tinto Limited | 110.47 | 6% | -3% | 16% | -10% | $ 40,648,175,433.00 |
| RLC | Reedy Lagoon Corp. | 0.028 | 12% | -20% | -35% | 65% | $ 15,902,359.67 |
| SHH | Shree Minerals Ltd | 0.009 | -10% | -40% | -18% | -44% | $ 12,222,368.92 |
| SRK | Strike Resources | 0.18 | 13% | 29% | 64% | -33% | $ 49,275,000.00 |
| SRN | Surefire Rescs NL | 0.031 | 15% | 3% | 158% | 29% | $ 47,039,960.60 |
| TI1 | Tombador Iron | 0.034 | 6% | -21% | 0% | -68% | $ 38,010,311.49 |
| TLM | Talisman Mining | 0.15 | 0% | -14% | -17% | -29% | $ 27,222,227.07 |
| VMS | Venture Minerals | 0.041 | 0% | -31% | -20% | -61% | $ 71,808,176.46 |
| EQN | Equinoxresources | 0.19 | 31% | -3% | -10% | 0% | $ 8,550,000.19 |
High grade Tasmanian iron ore producer Grange Resources (ASX:GRR) was among the standout iron ore stocks over the past week.
A number of mid-tier and junior iron ore miners surged over the past five trading days as investors have looked down the lower end of the market in search of value.
Grange, which reliably secures prices well above the benchmark 62% iron ore price by selling a 66% and above magnetite product at a production rate of around 2Mtpa from its Savage River mine, hit a 14-year high of $1.69 yesterday.
Other junior iron ore producers and explorers on the winners’ list included 2021 listing Equinox Resources (ASX:EQN).
That came following the resignation of managing director and CEO Daniel Taylor from the company which is seeking to develop its Hamersley Iron Ore project, 60km northeast of Tom Price in the Pilbara.
Make of that what you will. The new search has begun.
Coal prices remain sky high
Bearish sentiment sent coking coal prices lower on the seaborne market, with prices for premium hard coking coal FOB Dalrymple Bay seen at US$516.25/t by Fastmarkets on Monday, down US$4.73/t.
Before you go crying for BHP et. al. that’s a margin upwards of $400 on each tonne shipped.
Coal miners will remain very, very happy at those prices, even with a new Labor Government and forthcoming changes to the carbon safety mechanism to think about.
Human Rights Watch Australia researcher and former journalist Sophie MacNeill called on an Albanese Government to “end support for new oil, gas, and coal projects.”
That seems unlikely, given Albanese explicitly ruled out signing a pledge on the phasing out of coal ahead of the Federal Election.
It still stands as a major export earner for the Australian Government, with a shortage and the shunning of Russian coal from international trade flows coalescing in record prices.
According to The Australian, a record shipment of 25,000t of Australian coal from the port of Newcastle traded at an astonishing US$442.50/t last week. That boom is showing little signs of slowing.
| CODE | COMPANY | PRICE | 1 WEEK RETURN % | 1 MONTH RETURN % | 6 MONTH RETURN % | 1 YEAR RETURN % | MARKET CAP |
|---|---|---|---|---|---|---|---|
| NAE | New Age Exploration | 0.01 | -13% | -29% | -9% | -41% | $ 14,358,989.10 |
| CKA | Cokal Ltd | 0.15 | 0% | -9% | -12% | 131% | $ 140,842,347.00 |
| NCZ | New Century Resource | 2.22 | 14% | 3% | 2% | -24% | $ 284,249,847.21 |
| BCB | Bowen Coal Limited | 0.35 | -4% | 15% | 112% | 460% | $ 539,679,857.96 |
| LNY | Laneway Res Ltd | 0.005 | 0% | 0% | -13% | 16% | $ 25,208,065.64 |
| GRX | Greenx Metals Ltd | 0.18 | -5% | -10% | -16% | -21% | $ 48,187,888.16 |
| AKM | Aspire Mining Ltd | 0.09 | 0% | 1% | 17% | 18% | $ 45,179,691.67 |
| PAK | Pacific American Hld | 0.011 | -8% | -35% | -39% | -41% | $ 5,256,651.42 |
| AHQ | Allegiance Coal Ltd | 0.53 | -2% | -9% | -10% | -4% | $ 210,502,875.60 |
| YAL | Yancoal Aust Ltd | 5.97 | 7% | 25% | 117% | 197% | $ 7,698,161,917.71 |
| NHC | New Hope Corporation | 4.05 | 9% | 22% | 95% | 202% | $ 3,296,134,044.72 |
| TIG | Tigers Realm Coal | 0.019 | -5% | 27% | -21% | 138% | $ 248,267,344.99 |
| SMR | Stanmore Resources | 2.7 | 16% | 28% | 173% | 321% | $ 2,487,813,486.48 |
| WHC | Whitehaven Coal | 5.2 | 6% | 11% | 108% | 264% | $ 5,231,755,616.55 |
| BRL | Bathurst Res Ltd. | 1.3 | -2% | 16% | 93% | 306% | $ 258,335,703.00 |
| CRN | Coronado Global Res | 2.32 | 6% | 4% | 103% | 263% | $ 3,805,549,967.10 |
| JAL | Jameson Resources | 0.075 | 1% | -11% | -13% | -17% | $ 25,767,045.09 |
| TER | Terracom Ltd | 0.79 | 32% | 32% | 327% | 558% | $ 553,901,608.05 |
| ATU | Atrum Coal Ltd | 0.012 | 0% | 0% | -66% | -78% | $ 8,296,420.03 |
| MCM | Mc Mining Ltd | 0.135 | -10% | -16% | 50% | 29% | $ 26,683,407.45 |
Related Topics
Related Stories


UNLOCK INSIGHTS
Discover the untold stories of emerging ASX stocks.
Daily news and expert analysis, it's free to subscribe.
By proceeding, you confirm you understand that we handle personal information in accordance with our Privacy Policy.


