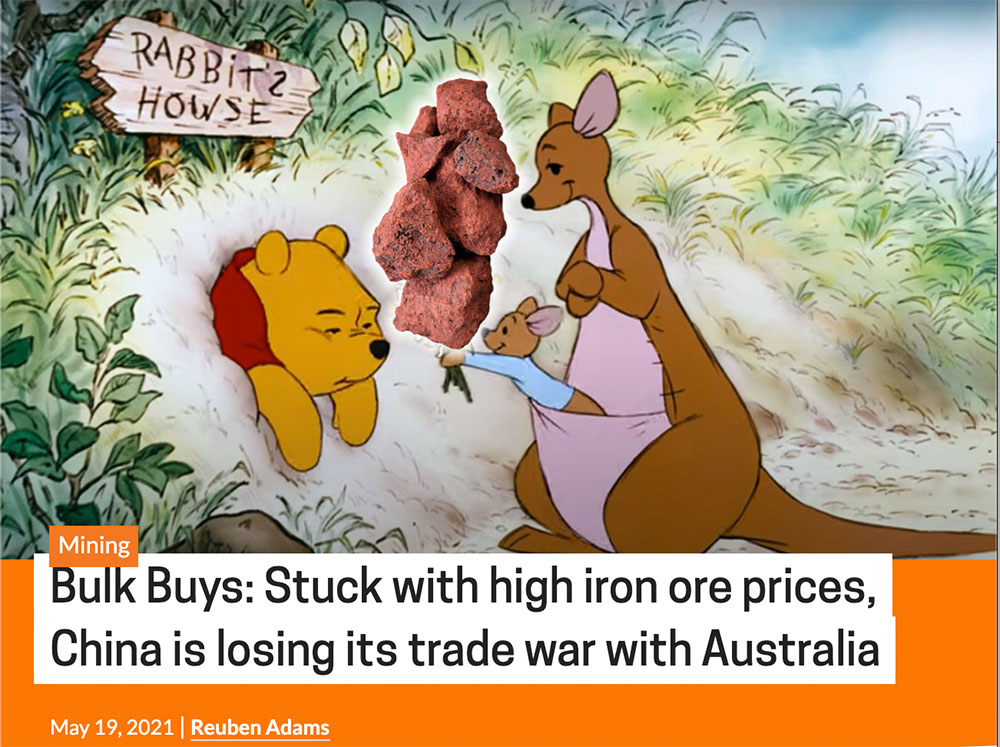
Bulk Buys: China tells iron ore players to stop with the high prices, or else

Pic: Bloomberg Creative / Bloomberg Creative Photos via Getty Images
Early last week, Chinese premier Li Keqiang said China needed to take more steps to curb “unreasonable” price increases for bulk commodities, right after we wrote this:

…which aged badly. Iron ore prices have fallen below $US200/t since.
On Sunday, China’s main economic planning body the NDRC and four other regulators met with domestic steel, iron ore, copper and aluminium companies for a serious convo.
“[This] meeting pointed out that this round of price rises is the result of a combination of many factors, including malicious speculation, urging companies to take the lead in maintaining pricing order in commodity markets, not to collude with each other to manipulate market prices and not to fabricate and spread false information about price increases,” Argus says.
“Relevant regulatory authorities will closely track and monitor the trend of commodity prices, strengthen linkage supervision on commodity futures and spot markets and have zero tolerance for illegal activity, the meeting said.”
How exactly will prices be kept to a ‘reasonable’ level, you ask? What is a reasonable level? Will prices ever go over $US200/t again?
We don’t know, yet, but fear, uncertainty and doubt have certainly stifled market sentiment.
The Argus ICX 62% index has now dropped ~18.7% from a record high of $US235.55/t hit on 12 May.
“Mills’ demand is gradually shifting to medium and low-grade ores amid the squeezed margins, coupled with market uncertainty,” a Shandong trader told Argus.
“Most participants were on the sidelines, waiting for a clearer direction,” a Hebei trader also said.
Well played, Li Keqiang.
For obvious reasons it was generally a pretty bad week for iron ore stocks, but — in the context of some mammoth share price gains made over the past year — there’s really nothing to worry about yet.
Ion ore prices are still up ~15% year to date.
Here’s how ASX-listed iron ore stocks are performing:
Scroll or swipe to reveal table. Click headings to sort. Best viewed on a laptop
| CODE | COMPANY | 1 WEEK CHANGE % | 1 MONTH CHANGE % | 6 MONTH CHANGE % | 1 YEAR CHANGE % | PRICE | MARKET CAP |
|---|---|---|---|---|---|---|---|
| ACS | Accent Resources NL | 32 | 56 | 400 | 900 | 0.05 | $ 23,301,364.15 |
| BCK | Brockman Mining | 9 | -26 | 85 | 92 | 0.05 | $ 445,403,142.29 |
| CZR | CZR Resources | 7 | 25 | 7 | 50 | 0.015 | $ 41,368,773.96 |
| DRE | Dreadnought Resources | 6 | 42 | 6 | 410 | 0.0255 | $ 61,707,294.03 |
| MAG | Magmatic Resrce | 5 | 18 | 14 | -41 | 0.195 | $ 44,963,856.84 |
| TI1 | Tombador Iron | 5 | 44 | 128 | 399 | 0.105 | $ 100,641,506.50 |
| HAW | Hawthorn Resources | 4 | -14 | -53 | -57 | 0.049 | $ 15,675,233.81 |
| SRN | Surefire Rescs NL | 4 | 0 | -19 | 733 | 0.025 | $ 26,331,849.84 |
| MGT | Magnetite Mines | 3 | 3 | 550 | 3442 | 0.065 | $ 206,737,285.80 |
| HAV | Havilah Resources | 2 | 31 | 57 | 175 | 0.275 | $ 84,991,930.77 |
| EFE | Eastern Iron | 0 | 7 | 18 | 195 | 0.011 | $ 8,942,781.17 |
| SHH | Shree Minerals | 0 | -12 | 36 | 275 | 0.015 | $ 15,153,553.38 |
| RHI | Red Hill Iron | 0 | 83 | 352 | 579 | 0.95 | $ 53,890,334.10 |
| LCY | Legacy Iron Ore | 0 | -17 | 114 | 650 | 0.015 | $ 96,071,077.76 |
| ADY | Admiralty Resources. | 0 | -14 | 27 | 46 | 0.019 | $ 22,023,559.28 |
| GRR | Grange Resources. | -2 | -15 | 86 | 109 | 0.5 | $ 584,456,042.49 |
| MIN | Mineral Resources. | -2 | -5 | 38 | 131 | 43.71 | $ 8,206,240,497.36 |
| IRD | Iron Road | -3 | -19 | 34 | 337 | 0.195 | $ 155,701,230.55 |
| GEN | Genmin | -3 | 6 | 0.28 | $ 78,211,776.44 | ||
| RIO | Rio Tinto Limited | -4 | 0 | 17 | 33 | 121.07 | $ 44,360,337,573.00 |
| MGU | Magnum Mining & Exp | -5 | -13 | 228 | 425 | 0.16 | $ 73,486,349.87 |
| BHP | BHP Group Limited | -5 | -1 | 23 | 38 | 47.29 | $ 138,072,054,836.78 |
| FMG | Fortescue Metals Grp | -6 | 1 | 20 | 60 | 21.8 | $ 65,797,480,297.66 |
| AKO | Akora Resources | -7 | -5 | 0.28 | $ 14,599,296.00 | ||
| CIA | Champion Iron | -7 | -2 | 42 | 167 | 6.68 | $ 3,407,507,783.72 |
| MIO | Macarthur Minerals | -9 | -13 | -13 | 121 | 0.42 | $ 60,356,578.05 |
| MGX | Mount Gibson Iron | -9 | -3 | 12 | 29 | 0.87 | $ 1,037,677,530.75 |
| TLM | Talisman Mining | -12 | 52 | 83 | 129 | 0.22 | $ 41,991,386.63 |
| FEX | Fenix Resources | -13 | -8 | 93 | 314 | 0.29 | $ 140,089,176.00 |
| FMS | Flinders Mines | -14 | -27 | 8 | 73 | 0.87 | $ 146,898,261.99 |
| GWR | GWR Group | -15 | -16 | 55 | 270 | 0.255 | $ 80,238,407.40 |
| SRK | Strike Resources | -15 | -2 | 83 | 315 | 0.22 | $ 55,605,210.30 |
| VMS | Venture Minerals | -16 | 37 | 137 | 506 | 0.097 | $ 132,417,928.30 |
| RLC | Reedy Lagoon Corp. | -16 | -27 | 23 | 300 | 0.016 | $ 7,520,418.66 |
| JNO | Juno | -18 | 0.18 | $ 24,418,440.18 | |||
| MDX | Mindax Limited | -23 | 2100 | 2100 | 2100 | 0.066 | $ 120,930,562.93 |
| CAP | Carpentaria Resource | -34 | 139 | 184 | 357 | 0.105 | $ 47,574,064.50 |
Related Topics
UNLOCK INSIGHTS
Discover the untold stories of emerging ASX stocks.
Daily news and expert analysis, it's free to subscribe.
By proceeding, you confirm you understand that we handle personal information in accordance with our Privacy Policy.


