Bulk Buys: Baltimore bridge collapse puts spotlight on coal supplies
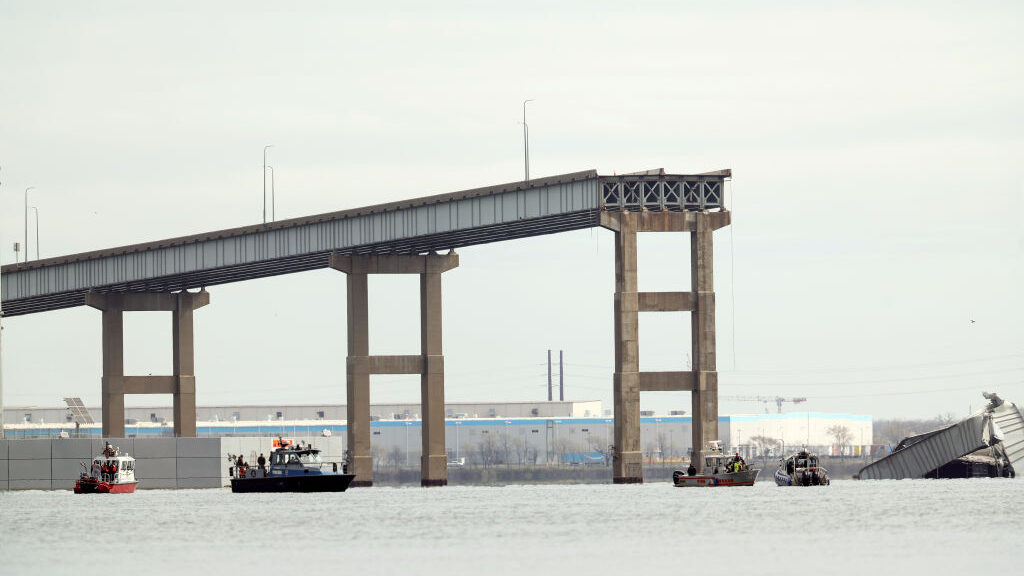
The Port of Baltimore is one of the largest and busiest on the US East Coast. Pic: Kevin Dietsch/Getty Images
- Coal markets are on watch for the impact of a shocking bridge collapse blocking the Baltimore port
- Jarden says stronger Asian steel spreads linked to lower iron ore and met coal prices will be positive for BlueScope
- Iron ore unlike to dip sustainably below US$100/t, says CBA
The collapse of the Francis Scott Key Bridge in Baltimore, which was crashed into by a Singapore flagged container ship, is another reminder that every action has numerous unforeseen effects.
Immediate concerns are for the six people missing and presumed dead after the early morning tragedy, which saw the sudden collapse of a bridge servicing 30,000 cars a day.
But it also marked the entry way to one of the largest coal export terminals on the US East Coast.
Resulting in the deferral of shipments of north and central Appalachian coal including major US producer Arch Resources is another trade disruption after years of them, notably from Covid, wet weather in Australia, fires and rail issues in the Russian logistics network and copper banditry on South African lines.
According to S&P Global, around 4.3Mt of thermal coal has been moved out of the port up to the end of February.
But traders, including in Baltimore’s runaway top customer India, are doubtful about any major price impact with the market largely well supplied.
“First only two ports get impacted by this incident one is CSX and CNX. Looking at these two ports I don’t see there is much quantity of coal that will move out from the market. Second point: I have not seen any force majeure from any major supplier like Consol or Javelin or Arch or any other supplier,” a trader told S&P reporters.
How will the tragedy impact supply chains?
However, it’s worth noting Baltimore’s export grades are pretty bespoke.
The port, which Argus says has a capacity of a little under 31Mtpa, typically shifts high CV coal suited for Asian markets but has a very high sulphur content. Platts specs for Baltimore 6900kcal product come in at 3% sulphur.
Newcastle specs according to S&P Platts come in at 0.75% sulphur and below.
Baltimore’s two terminals loaded around 2.4Mt in February. That’s less than 2% of global coal flows, according to DBX Commodities, but enough that it could affect the broader market.
“To provide context, Baltimore coal flows represent less than 2% of global flows, but their removal would still impact the market,” DBX head of sales Andreas Christopoulos said in a brief note.
“Counterintuitively, the disruption is expected to have a lesser effect on the Atlantic market and Europe compared to Asia.
“This is because much of the coal exported from the port has high sulfur content, which is not suitable for European power stations and not relevant for the API2 prices.”
Around 500,000t of coal is currently marooned at port, according to DBX, with a hypothetical one-month closure to lead to 835,000t of lost met coal sales and 1.65Mt of deferred thermal exports.
Argus said April API2 futures rose US$2/t to US$113.30/t on Monday, while front month Newcastle thermal coal futures were up US$2.2/t to US$128.50/t yesterday morning.
The timing of the disruptions could keep prices from rising stiffly, with coal largely regarded to be entering the shoulder season in the north between winter and summer when electricity use declines.
ASX coal stocks
Scroll or swipe to reveal table. Click headings to sort.
| CODE | COMPANY | PRICE | WEEK RETURN % | MONTH RETURN % | 6 MONTH RETURN % | YEAR RETURN % | MARKET CAP |
|---|---|---|---|---|---|---|---|
| NAE | New Age Exploration | 0.004 | 0% | 0% | -33% | -20% | $ 7,175,595.64 |
| CKA | Cokal Ltd | 0.115 | 62% | 15% | 10% | -32% | $ 124,079,132.70 |
| BCB | Bowen Coal Limited | 0.045 | -4% | -21% | -70% | -79% | $ 127,980,247.41 |
| SVG | Savannah Goldfields | 0.024 | -17% | -20% | -62% | -85% | $ 7,308,207.82 |
| GRX | Greenx Metals Ltd | 0.95 | 2% | -5% | 1% | 60% | $ 259,529,765.65 |
| AKM | Aspire Mining Ltd | 0.215 | 16% | 19% | 144% | 284% | $ 109,141,951.78 |
| AVM | Advance Metals Ltd | 0.038 | -3% | 23% | -68% | -76% | $ 1,523,228.25 |
| YAL | Yancoal Aust Ltd | 5.23 | -4% | -8% | 1% | -3% | $ 6,905,898,255.51 |
| NHC | New Hope Corporation | 4.46 | -5% | -2% | -28% | -18% | $ 3,677,209,268.40 |
| TIG | Tigers Realm Coal | 0.0055 | 10% | -8% | -8% | -58% | $ 71,866,863.02 |
| SMR | Stanmore Resources | 3.15 | -2% | -5% | -14% | -8% | $ 2,785,300,149.06 |
| WHC | Whitehaven Coal | 6.74 | 3% | -2% | -3% | 6% | $ 5,513,199,166.56 |
| BRL | Bathurst Res Ltd. | 0.87 | 2% | 4% | -12% | -5% | $ 166,483,008.60 |
| CRN | Coronado Global Res | 1.2 | -2% | -7% | -37% | -22% | $ 1,986,597,670.05 |
| JAL | Jameson Resources | 0.022 | 0% | -27% | -52% | -69% | $ 9,586,133.08 |
| TER | Terracom Ltd | 0.23 | -13% | -12% | -48% | -59% | $ 188,227,065.23 |
| ATU | Atrum Coal Ltd | 0.004526 | 0% | 0% | 0% | 0% | $ 11,966,853.96 |
| MCM | Mc Mining Ltd | 0.165 | 14% | 18% | 10% | -8% | $ 67,301,972.76 |
| DBI | Dalrymple Bay | 2.7 | -1% | -4% | -3% | -4% | $ 1,338,556,500.90 |
| AQC | Auspaccoal Ltd | 0.079 | -5% | 8% | -31% | -12% | $ 40,524,439.69 |
Jarden boosts BlueScope as steel spreads improve
Iron ore fell a calamitous 4% on Monday, dropping to around US$104/t in a slasher flick day for steel-linked metals.
Zinc dropped 2.1% to US$2442/t, impacted also by news Glencore would restart the McArthur River mine after it was curbed by a cyclone this month, while nickel sunk 1.8% to US$16,640/t, erasing the gains that had brought short-lived optimism for the struggling commodity.
But falling commodity prices aren’t all bad. Asian hot rolled coil spreads are starting to rebound as iron ore and coal prices normalise, rising from recent lows of US$125/t to US$156/t.
That is positive for BlueScope Steel’s Australian operations.
“Our estimates suggest a recovery to US$221/mt average in Jun-24. This is driven by improved HRC pricing and recent softening in iron ore and coking coal prices (expanding spreads),” Jarden analysts led by Rohan Gallagher said.
“The average spread for 2H24 HTD is now US$156/mt, modestly above BSL’s guidance of US$145/mt (Jarden US$146/mt).
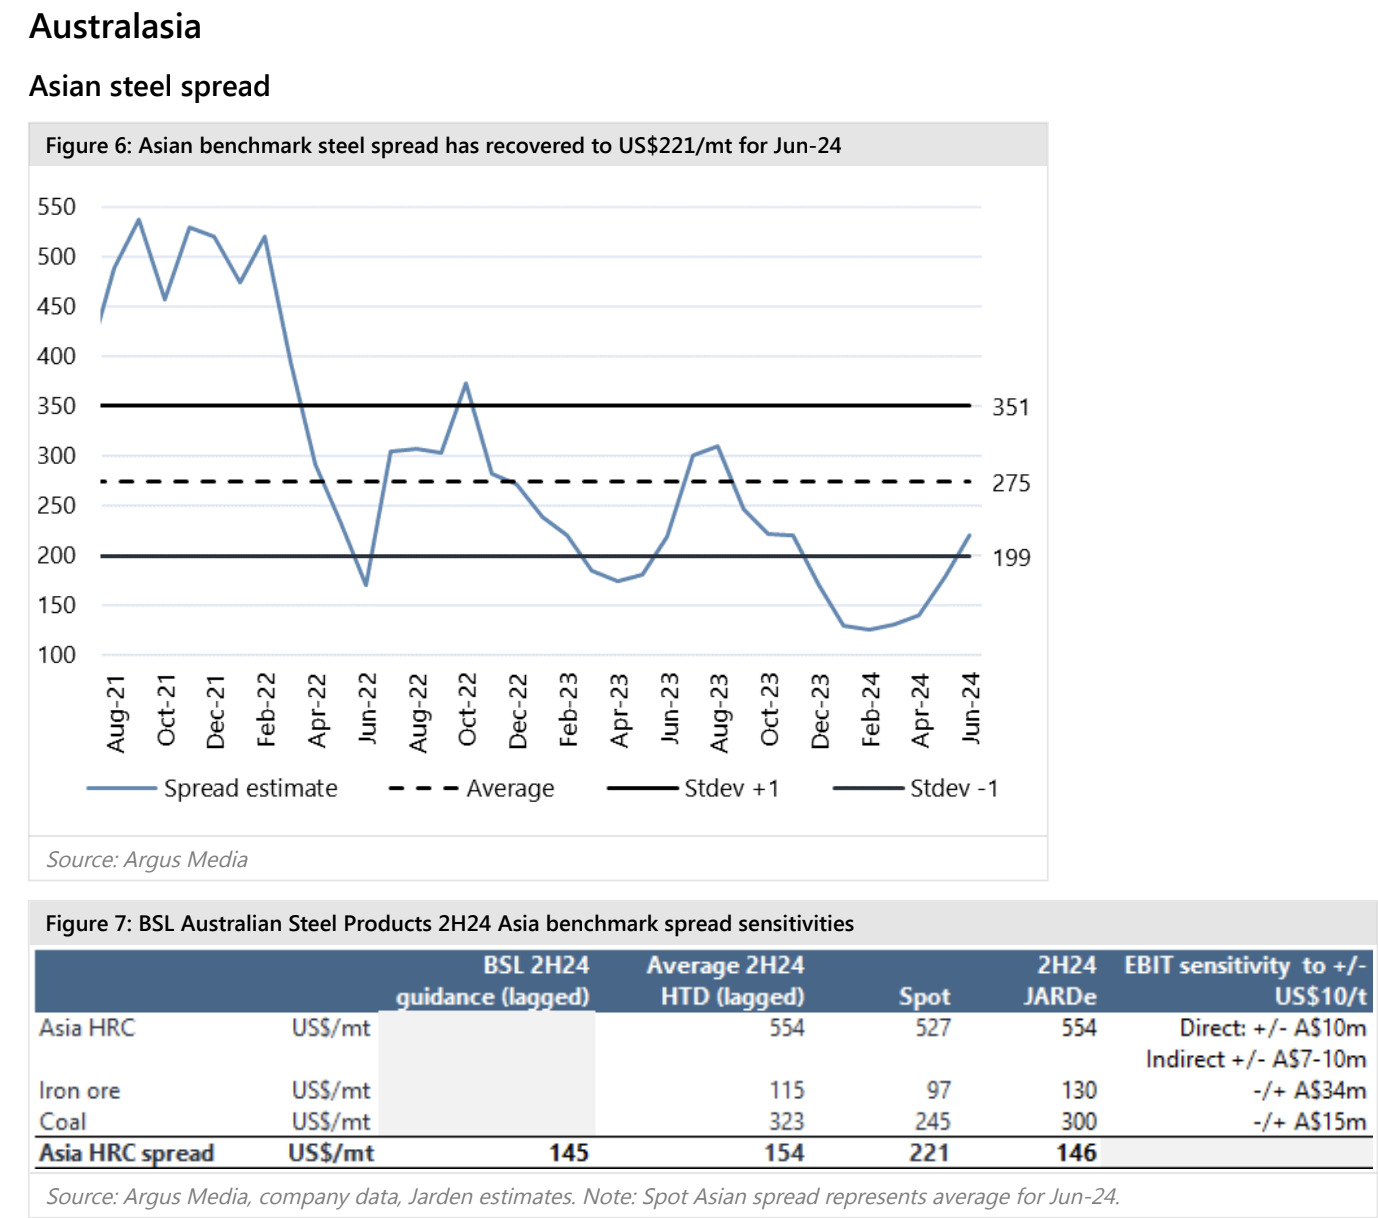
“An indicative mark to market, applying spot rates to spread components for the remainder of the half, would see our Australian Steel Products EBIT increase to A$140m (current JARDe $109m). BSL’s previous guidance for Australian Steel Products is to achieve EBIT ‘less than half’ 1H24 (A$258m), implying up to but no more than A$130m in 2H.
“Whilst down meaningfully, the last time we saw spreads this low, Australia was barely breakeven, reflecting the concerted effort on cost management and shift to greater value add across its product range to more stable priced, higher margin Zincalume, Truecore and Colorbond products.”
US steel spreads are up, but present downside risk coming well below BlueScope’s US$510/t guidance.
“The 2H mark to market is 2.5% shy of BSL’s guidance (2H US$510/t),” Jarden says.
“Whilst this could provide possible downside risk, the positive turnaround in spreads should see any risks pare back. Note the typical lag is 1-2 months.”
Jarden has a $24.60 price target on BlueScope (9.1% return on Monday’s closing price) with an overweight rating and a $14 price target (15.3% return) on steel recycler Sims (ASX:SGM) but neutral rating.
BlueScope Steel (ASX:BSL) and Sims (ASX:SGM) share prices today
Iron ore prices dive, but bank analysts think downside is limited
After ANZ put support levels for iron ore in the US$90-110/t range in 2024, Commonwealth Bank has joined them, saying prices will struggle to sit sustainably below US$100/t.
Mining analyst Vivek Dhar said lower iron ore prices were bringing Chinese steel mills back to profitably, and that he expects steel demand to remain flat in China this year with infrastructure spending to shelter the load left by a waning real estate sector.
CBA thinks a lift in infrastructure spending could equal a 0.5-1% chunk of GDP growth.
“Our second reason is tied to how seaborne iron ore costs have evolved over the last few years. The seaborne iron ore market has transformed meaningfully since Vale was forced to reduce supply following the Brumadinho dam collapse in January 2019,” Dhar said.
“The market replaced Vale’s iron ore exports with higher cost supply that BHP estimates in the $US80‑100/t range. That means that if China’s iron ore demand is mostly unchanged this year, we would need iron ore prices to stay mostly above $US100/t to avoid high‑cost seaborne supply from exiting the market.
“We also don’t believe that the seaborne iron ore market will change much over the remainder of this year given the world’s largest iron ore exporters like BHP, Rio Tinto, Vale and Fortescue have flagged iron ore production and shipment guidance in line with recent performance.”
He said upside risks included potential Chinese stimulus measures to meet an ambitious 5% GDP growth target, with any disappointment in economic performance drawing the potential for policy intervention.
ASX iron ore stocks
Scroll or swipe to reveal table. Click headings to sort.
| CODE | COMPANY | PRICE | WEEK RETURN % | MONTH RETURN % | 6 MONTH RETURN % | YEAR RETURN % | MARKET CAP |
|---|---|---|---|---|---|---|---|
| ACS | Accent Resources NL | 0.007 | 0% | -30% | -13% | -72% | $ 3,311,890.98 |
| ADY | Admiralty Resources. | 0.006 | 0% | -14% | 0% | -25% | $ 7,821,474.92 |
| AKO | Akora Resources | 0.17 | 3% | 17% | 10% | -3% | $ 16,147,078.38 |
| BCK | Brockman Mining Ltd | 0.025 | 4% | -11% | -19% | -4% | $ 232,005,803.28 |
| BHP | BHP Group Limited | 43.68 | 0% | -1% | 0% | 0% | $ 221,098,429,508.94 |
| CIA | Champion Iron Ltd | 7.27 | 3% | -6% | 21% | 12% | $ 3,719,751,402.68 |
| CZR | CZR Resources Ltd | 0.27 | 10% | -2% | 157% | 59% | $ 63,648,354.42 |
| DRE | Dreadnought Resources Ltd | 0.017 | 0% | -6% | -67% | -72% | $ 59,186,740.32 |
| EFE | Eastern Resources | 0.007 | -13% | 0% | -22% | -30% | $ 8,693,625.23 |
| CUF | Cufe Ltd | 0.013 | 0% | -7% | 0% | -19% | $ 14,899,460.75 |
| FEX | Fenix Resources Ltd | 0.26 | 6% | 6% | 16% | 8% | $ 180,600,659.20 |
| FMG | Fortescue Ltd | 25.19 | 2% | -8% | 24% | 24% | $ 77,589,915,933.60 |
| RHK | Red Hawk Mining Ltd | 0.68 | -6% | 6% | 7% | 55% | $ 134,779,175.60 |
| GEN | Genmin | 0.160002 | 0% | 0% | 0% | -5% | $ 95,574,744.75 |
| GRR | Grange Resources. | 0.42 | 1% | 1% | -7% | -40% | $ 497,655,640.14 |
| GWR | GWR Group Ltd | 0.1 | -5% | 5% | 19% | 5% | $ 32,121,665.50 |
| HAV | Havilah Resources | 0.165 | 6% | 10% | -31% | -48% | $ 52,245,469.65 |
| HAW | Hawthorn Resources | 0.07 | 0% | -13% | -33% | -16% | $ 23,451,092.91 |
| HIO | Hawsons Iron Ltd | 0.033 | 0% | 0% | -11% | -39% | $ 30,329,344.95 |
| IRD | Iron Road Ltd | 0.064 | -2% | 10% | -22% | -42% | $ 52,635,084.42 |
| JNO | Juno | 0.067 | 10% | 0% | -20% | -24% | $ 12,190,332.42 |
| LCY | Legacy Iron Ore | 0.015 | 7% | 0% | 0% | 0% | $ 115,703,223.93 |
| MAG | Magmatic Resrce Ltd | 0.096 | 13% | 159% | 37% | -3% | $ 36,637,339.10 |
| MDX | Mindax Limited | 0.04 | 3% | 0% | -20% | -64% | $ 81,822,351.20 |
| MGT | Magnetite Mines | 0.285 | 10% | 8% | -2% | -52% | $ 27,561,667.00 |
| MGU | Magnum Mining & Exp | 0.017 | -6% | -15% | -32% | -6% | $ 13,759,143.85 |
| MGX | Mount Gibson Iron | 0.42 | -2% | -13% | -2% | -16% | $ 510,251,167.86 |
| MIN | Mineral Resources. | 68.3 | 1% | 6% | 3% | -11% | $ 13,219,976,768.44 |
| MIO | Macarthur Minerals | 0.1 | 2% | -17% | -41% | -33% | $ 16,625,348.80 |
| PFE | Panteraminerals | 0.053 | 20% | 10% | -12% | -43% | $ 13,805,549.92 |
| PLG | Pearlgullironlimited | 0.03 | -12% | -19% | 15% | -12% | $ 6,136,253.70 |
| RHI | Red Hill Minerals | 5.64 | 3% | 4% | 20% | 31% | $ 360,415,006.80 |
| RIO | Rio Tinto Limited | 120.93 | 0% | -2% | 9% | 6% | $ 45,069,360,541.74 |
| RLC | Reedy Lagoon Corp. | 0.004 | 0% | 0% | -33% | -31% | $ 2,478,162.93 |
| CTN | Catalina Resources | 0.004 | 0% | -20% | 0% | -43% | $ 4,953,947.57 |
| SRK | Strike Resources | 0.045 | -13% | -8% | -15% | -27% | $ 12,768,750.00 |
| SRN | Surefire Rescs NL | 0.011 | 0% | 0% | -27% | -45% | $ 21,849,385.94 |
| TI1 | Tombador Iron | 0.014 | 0% | 0% | -30% | -39% | $ 30,218,753.22 |
| TLM | Talisman Mining | 0.245 | 44% | 40% | 75% | 81% | $ 46,138,485.51 |
| VMS | Venture Minerals | 0.023 | 21% | 35% | 130% | 15% | $ 52,133,633.15 |
| EQN | Equinoxresources | 0.225 | 29% | -17% | 29% | 32% | $ 22,764,375.68 |
| AMD | Arrow Minerals | 0.005 | 0% | 0% | 100% | 67% | $ 47,398,531.85 |
| CTM | Centaurus Metals Ltd | 0.295 | -9% | 18% | -54% | -67% | $ 146,024,214.42 |
Related Stories


UNLOCK INSIGHTS
Discover the untold stories of emerging ASX stocks.
Daily news and expert analysis, it's free to subscribe.
By proceeding, you confirm you understand that we handle personal information in accordance with our Privacy Policy.


