ASX gold miners smash world’s biggest producers on costs, share price gains

Pic: Via getty
Ever wonder why record high gold prices haven’t translated to booming share prices and investor returns?
Since 2009, mining costs for the world’s biggest gold producers have risen in line with the spot price, leaving little extra money available for shareholders.
This is according to Metals Focus’ Gold Peer Group quarterly analysis, which includes global leaders Agnico Eagle, AngloGold Ashanti, Barrick Gold, Endeavour Mining, Gold Fields, Harmony, Kinross, Newmont, Polymetal and Sibanye Stillwater.
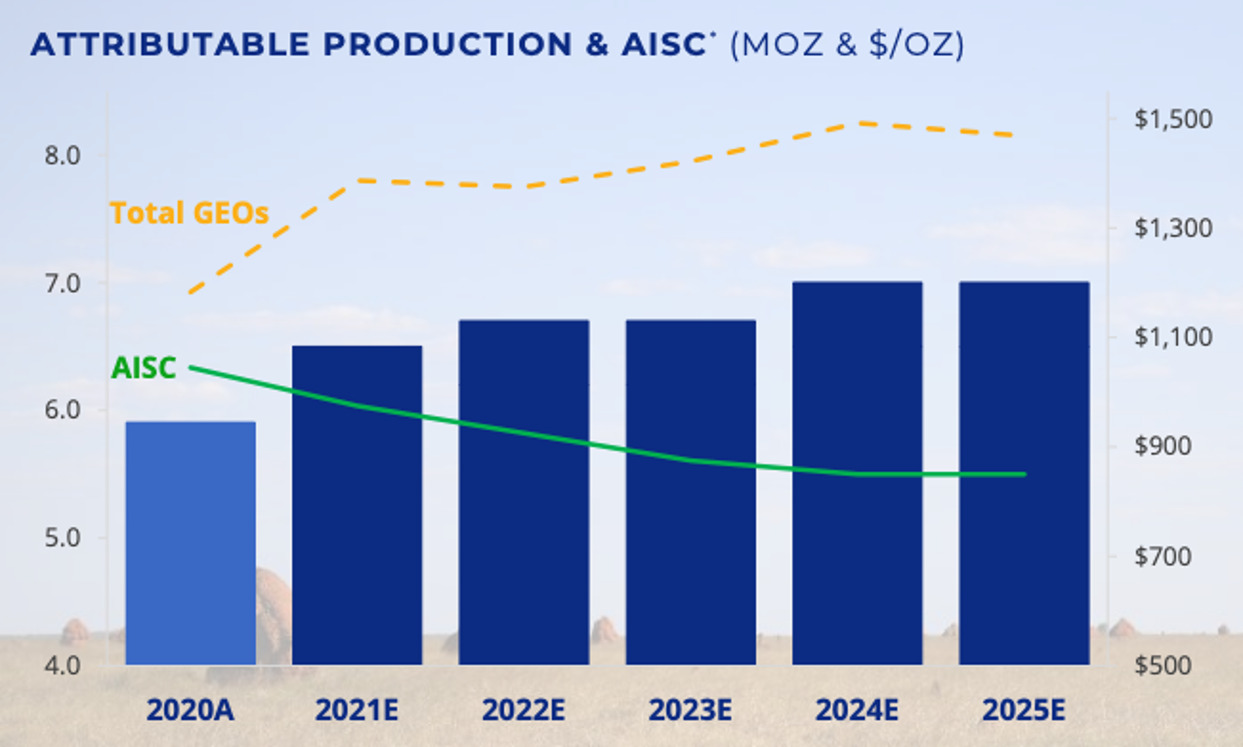
All in sustaining cost (AISC) is an imperfect but solid metric used by investors to compare producers and project developers.
In 2000, the average AISC for the Metals Focus peer group to produce an ounce of gold was ~US$300.
In 2012, AISC for these majors ballooned to US$900/oz. It kept rising, hitting a record high US$1,447/oz in Q3 this year.
Global average #gold all-in-sustaining costs rose to US$1,342/oz in Q3’23 – a new record high in our series. While costs remain elevated, we continue to see a slowing trend in cost growth. See the charts here: https://t.co/9qKZ2DkHMN pic.twitter.com/hyH4kTCUoC
— Krishan Gopaul (@KrishanGopaul) December 18, 2023
It has caught the big miners by surprise. In August 2021, the world’s largest gold miner Newmont predicted AISC to fall +13% to between US$800–$900/oz from 2023.
Instead, it went the other way, touching US$1,400/oz in Q3 this year.
Shareholder margins peaked in 2020
Metals Focus’ ‘shareholder cash cost’ includes all-in-sustaining-costs, project capital expenditure, cash taxes, interest, and royalties.
Anything left over is available to pay dividends, repay debt or be used for corporate activity.
Comparing shareholder cash costs to the gold price from 2009 to Q3.23, it is apparent that costs have risen with the gold price, leaving little money available for shareholders:
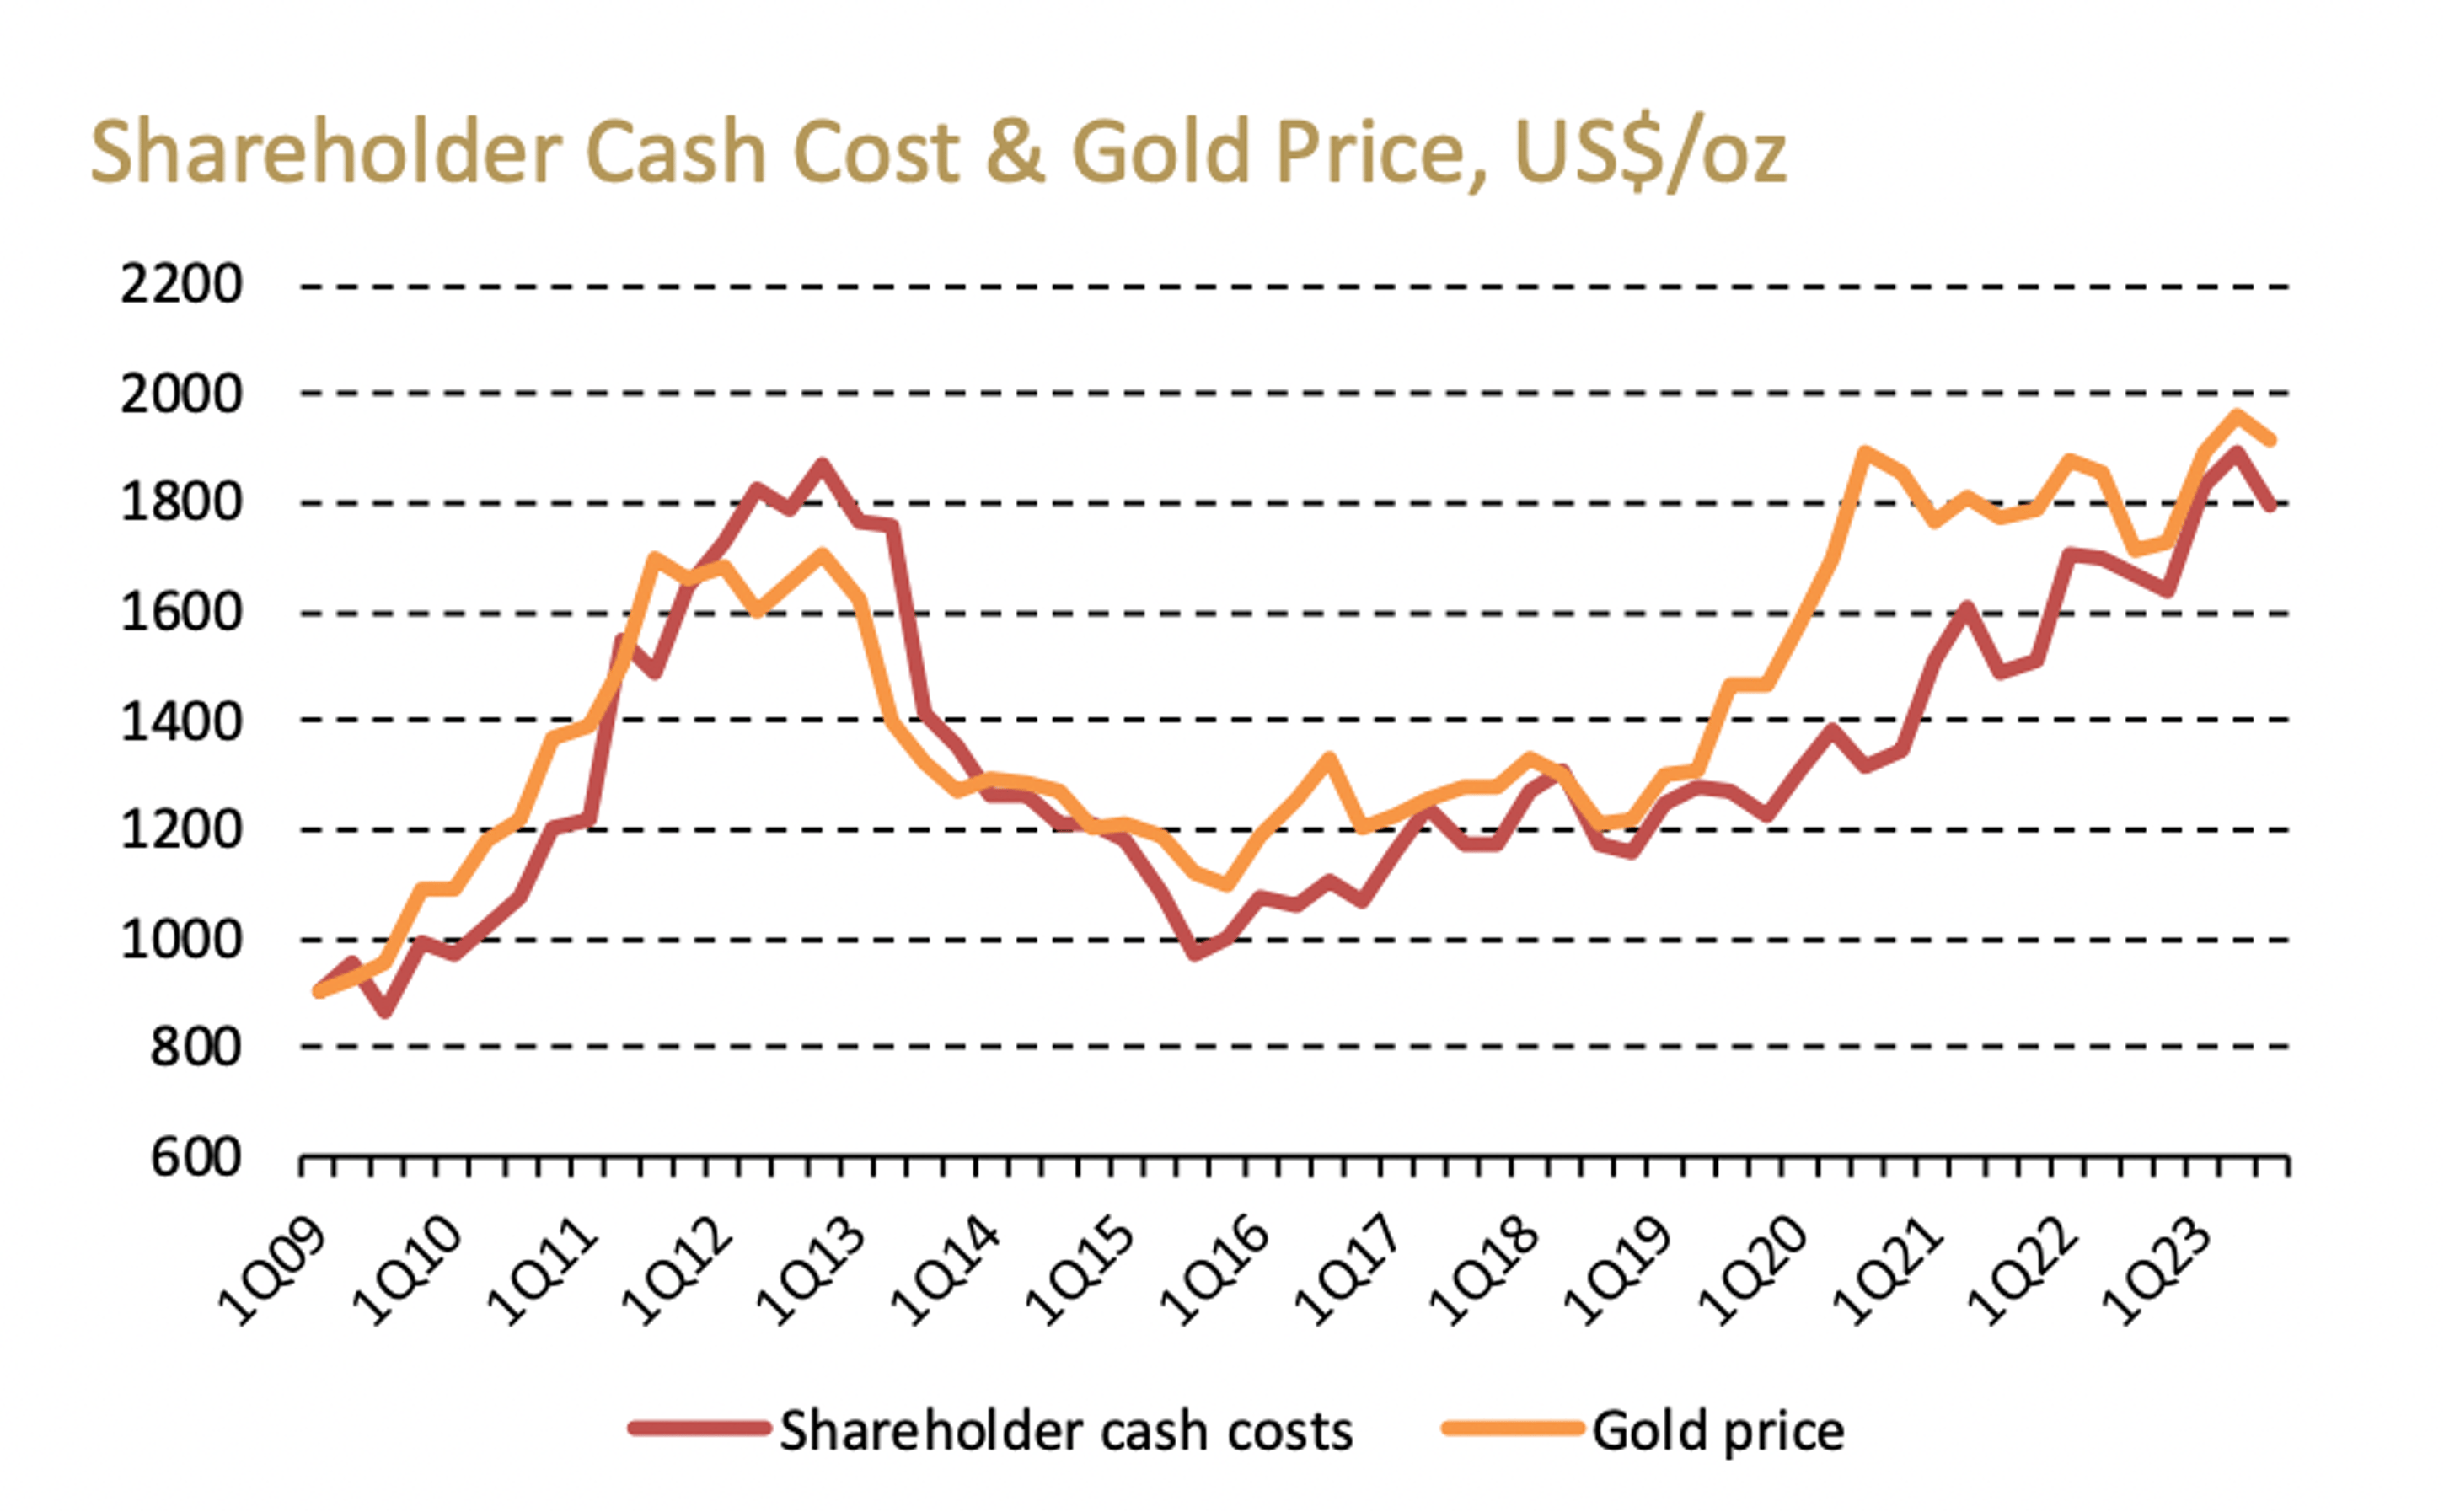
For Q3.23, shareholder cash costs were US$1,800/oz, down 5% compared to the previous quarter, but 8% higher year on year.
This represented a positive cash margin of US$116/oz, or 6% compared to the gold price. The cash margin peaked in Q3.20 at US$575/oz.
Since the end of 2020, this conversion ratio has been falling, in effect generating negative cash flow to the rising gold price, Metals Focus says.
“In conclusion, our gold mining peer group has faced substantial headwinds over the past few years,” Metals Focus says.
“Costs have risen largely in-line with the gold price, and, in our opinion, capital investment will have to increase to maintain production.”
The good news: divvies should make a comeback regardless
There is upside though, as gold majors complete a decade-long drive to pay off debt.
“Debt reduction is now largely complete, and dividends should benefit,” Metals Focus says.
“Nearly all the companies in our peer group are now paying regular dividends.
“However, they remain relatively low. We calculate that for our peer group at the end of Q3.23, the implied dividend yield was 3.3%.”
What is a dividend yield?
Dividend yield is a stock’s annual dividend payments to shareholders as a percentage of the stock’s current price.
For example: $10/sh stock with 33c in dividends per year = 3.3% divvy yield.
It is a good basic measure used by investors to compare income stocks.
US$47bn capped Newmont (NYSE: NEM) has a current yield of 3.91%, with an average of 2.76% over the past five years.
But investors must look beyond the headline numbers. High divvy yields can be misleading when they are the result of a special one-off payment, or a declining stock price.
South African platinum-gold miner Sibanye Stillwater (NYSE:SSW), for example, tops the peer list with a 7% yield, but the stock is down +50% YTD and has actually slashed dividends as it grapples with declining PGM prices.
How do the ASX top gold stocks compare on costs, share price, and divvies?
It has been hard graft for the world biggest gold miners, with most of the peer group – except for Gold Fields, Harmony, and Kinross — either treading water or posting double share price digit losses in 2023.
Meanwhile, our short list of +$1bn capped dividend paying Aussie gold stocks have enjoyed strong double digit gains, with Africa-focused Perseus (ASX:PRU) the only loser.
Costs are also better at the top end:
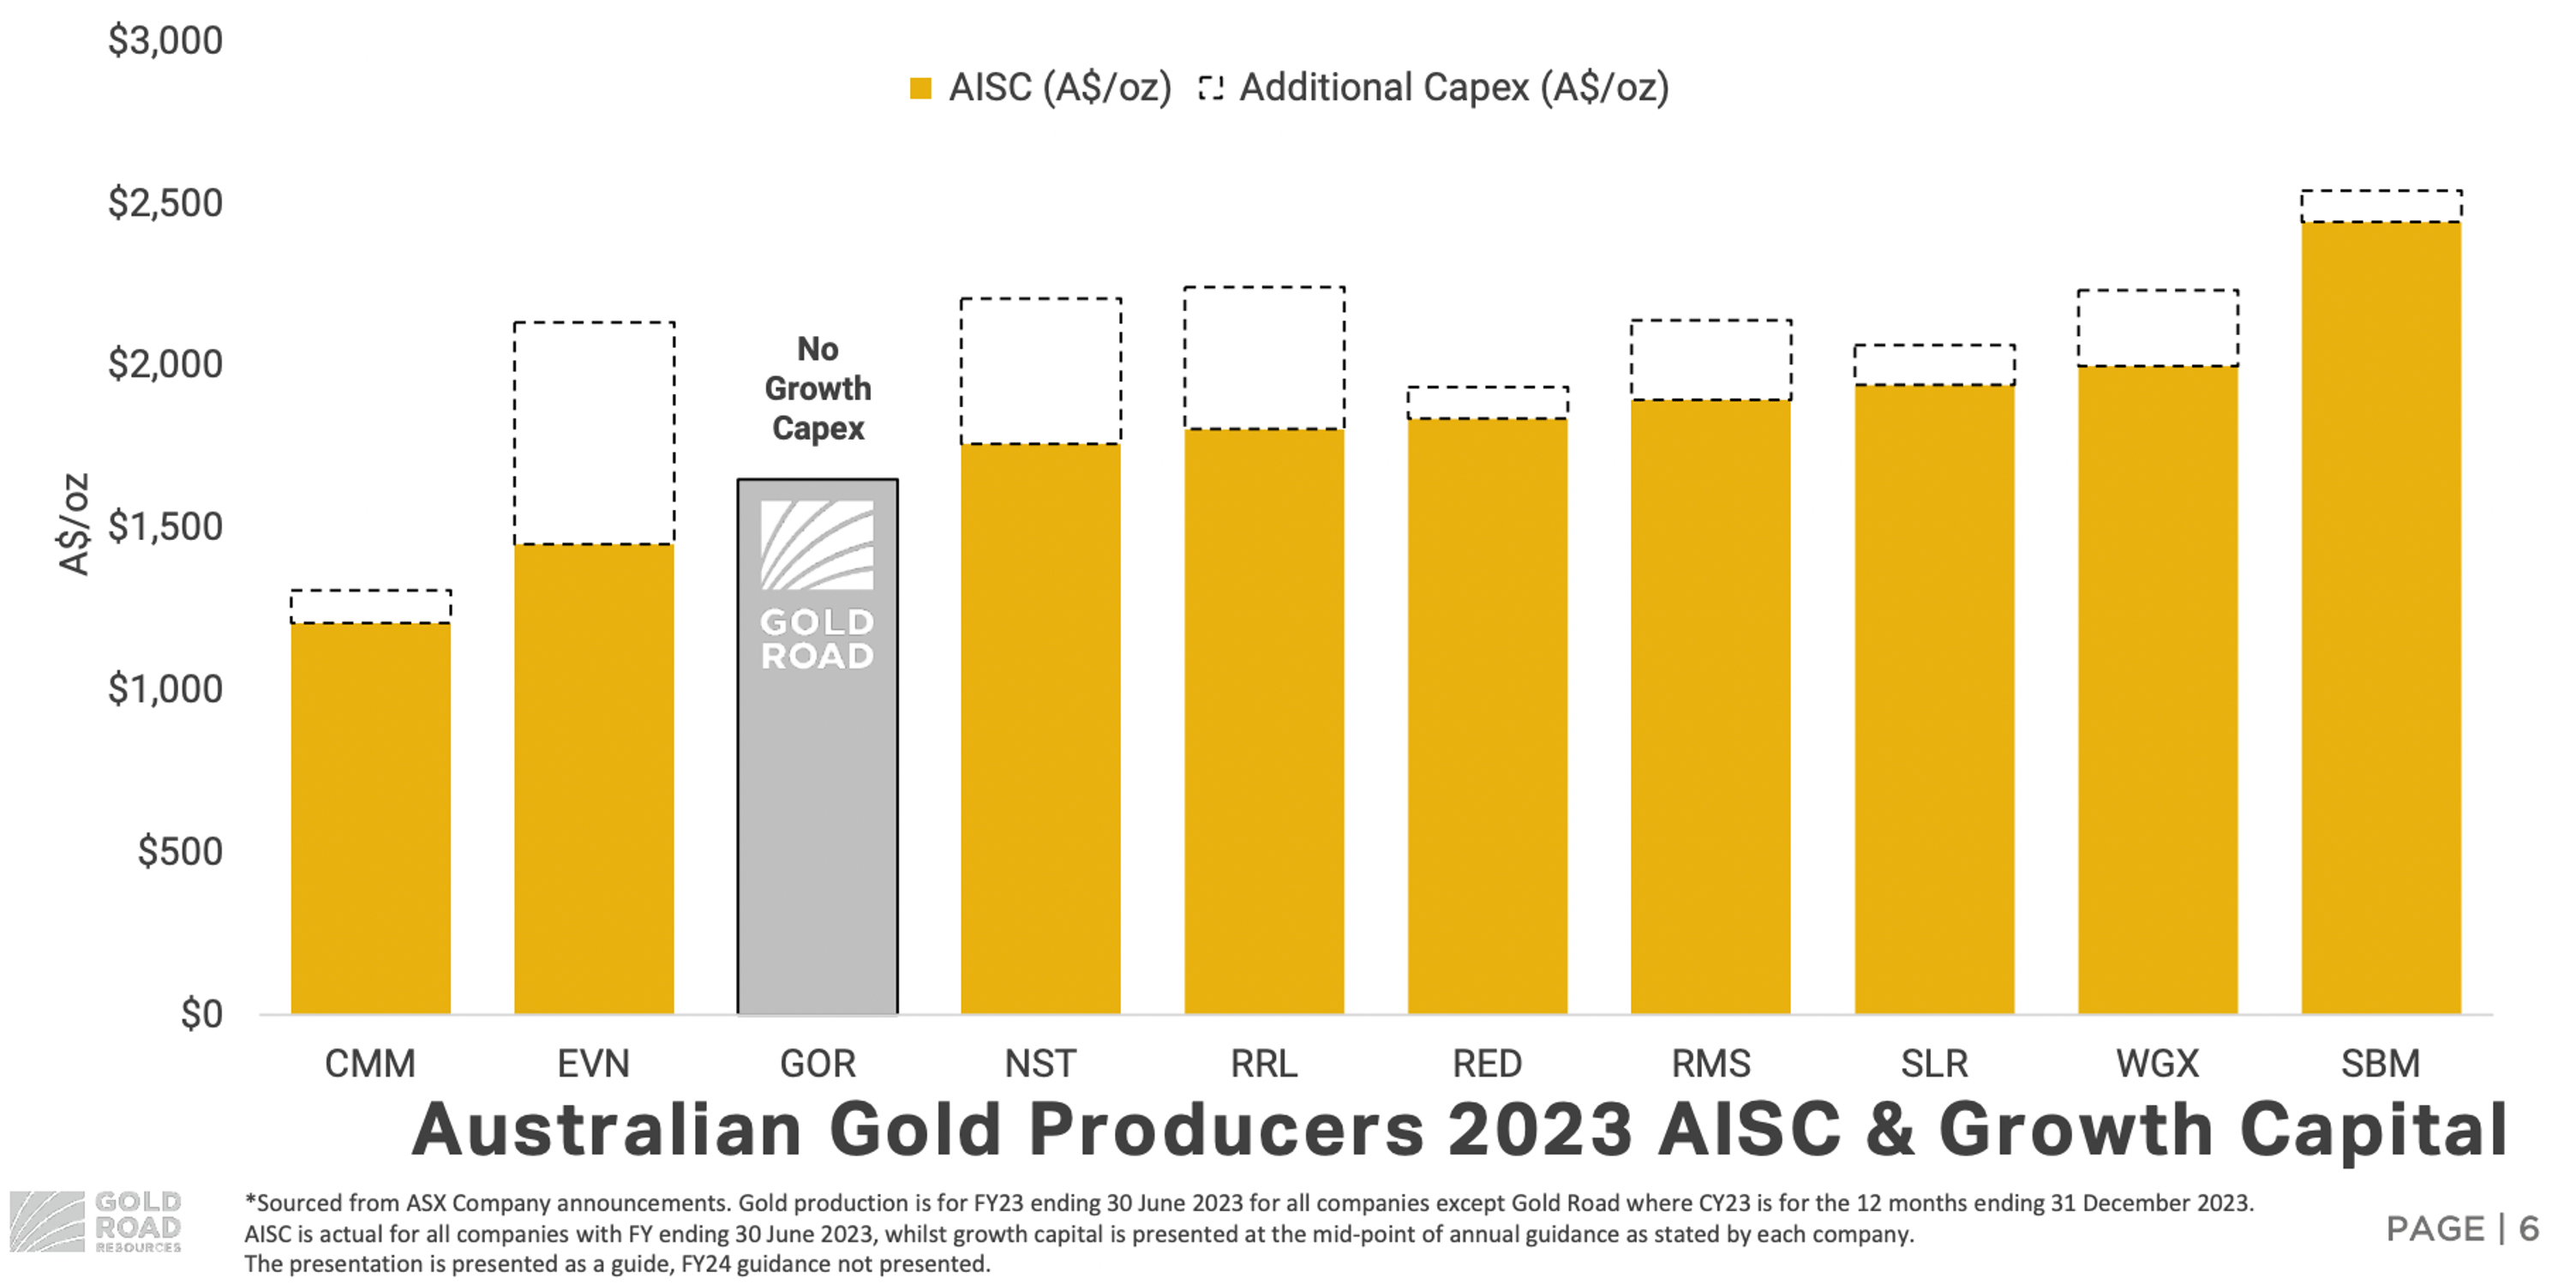
However, yields lag. Below we compare these ASX locals against the peer group yardstick of US$1,447/oz ASIC in Q3, and well as an implied average dividend yield of 3.3% across the peer group.
| CODE | COMPANY | AISC (Q3) | AISC +/- (QUARTER ON QUARTER) | CURRENT DIVVY YIELD | DIVVY YIELD 5 YR AVERAGE |
|---|---|---|---|---|---|
| NST | NORTHERN STAR | $1,939/oz (US$1,260/oz) | 13% | 2.02% | 1.65% |
| EVN | EVOLUTION MINING | $1,612/oz (US$1,056/oz) | -15% | 1.08% | 2.46% |
| PRU | PERSEUS MINING | $1391/oz (US$937/oz) | -6% | 1.93% | n/a |
| GOR | GOLD ROAD RESOURCES | $1,682/oz (US$1132/oz) | 4% | 0.87% | n/a |
| RMS | RAMELIUS RESOURCES | $1,975/oz (US$1330/oz) | 20% | 1.20% | 1.23% |
Related Stories


UNLOCK INSIGHTS
Discover the untold stories of emerging ASX stocks.
Daily news and expert analysis, it's free to subscribe.
By proceeding, you confirm you understand that we handle personal information in accordance with our Privacy Policy.


