An Idiot’s Guide to Mining Gibberish for Dummies™

"A portrait of the author struggling to understand what the miners mean by 'gold'." Pic via Getty Images.
Mining companies often make for good investments, but with Great Value comes Impenetrable Jargon, which is going to take some explaining.
Like it or not, mining is Big Business in Australia, largely because there is a lot of Australia, and very large chunks of it are made up of stuff that can be turned into other stuff, or sold to China for vast sums of cash.
Gold, coal, iron ore and lithium are the sorts of things that can make you rich if you’re brave enough to battle extreme heat in the outback, or you’re happy spending your life several hundred metres closer to the centre of the Earth than is normally considered “ideal”.
In the event that you’re unlucky enough to find coal, you face the almost insurmountable dangers posed by angry community groups, who will have zero hesitation in mobilising an army of local geriatrics to hold very witty signs and aggressively drink tea at you.
Or, rather inconveniently, chain themselves to other stuff that you own.
However, beyond those dangers lie almost untold riches for the companies prepared to go looking for them – but that sorta thing is hellishly expensive, mostly because all the gold that was just lying around for bazillions of years on the surface of Australia has pretty much been picked up and spent already.
A lot of the stuff that mining companies can sell is, therefore, underground. And that means exploring for it is a monstrous ball ache, requiring expertise in difficult stuff like geology, geochemistry, flying helicopters and buying up land next door to places where other mining companies have already found similar stuff.
Huge hassle, very expensive, and no guarantee it’s going to pay off. You’d have to be mad, right?
You could probably argue, then, that you’d need to be even more unhinged to want to throw money at a little mining company, especially if you don’t have the foggiest idea what goes into a company like, for example, De Grey Mining (ASX:DEG).
A very quick story time.
Waaaaaay, way back in 2015, De Grey was a shadow of its former self – and, let me be clear, that’s being very polite. In 2004, the company was trading at a peak of around $11 a share, but by 2015 things had changed “a little bit”, and the company was changing hands at just $0.02 a slice.
But in late 2019, the company found what looked like a decent sized gold deposit, and told the market about it… and then went poking around for hard evidence that it was on the money.
Fast forward to 6 February, 2020, and De Grey announced to the ASX that it had evidence that it had literally struck gold.
“Hemi confirms potential for major discovery”, the headline said, with details including that two patches of gold-bearing ground had been found at a site called Hemi.
Alongside area A, De Grey listed the following numbers:
- 24m @ 7.5g/t Au from 126m in BWAC315, including 18m @ 8.6g/t (EOH)
- 49m @ 3.7g/t Au from 65m in BWAC309, including 18m @ 6.6g/t
- 36m @ 4.0g/t from 39m in BWAC245, including 11m @ 8.9g/t
Alongside the second patch of ground, where these ones:
- 24m @ 4.2g/t Au from 36m in BWAC312, including 10m @ 7.4g/t (EOH)
- 15m @ 2.5g/t Au from 33m in BWAC313 (EOH)
- 21m @ 2.5g/t from 36m in BWAC258 (EOH)
Utter gibberish, of course – but to the right people with the understanding of what that all meant, it said simply this: “There is probably a lot of gold at Hemi.”
And they were right. Hemi, as it turns out, is stupidly massive. One of those very rare occasions where it’s actually justified to use words like “eyewatering” and “game-changer”.
For publicly listed companies, there’s a requirement for them to let everyone know what’s happening while they’ve been out looking for precious things to mine – and that’s when investors get to find out which of The Little Mining Companies that Could are looking likely to morph into The Cash Cow that Laid… uh, the… Golden Goose?
Or something like that. You know what I mean.
Ahuh… but the gibberish! Explain it. Quickly.
The first time I tried to make sense of a mining company’s ASX announcement about a gold discovery in some far-flung part of the country, it reminded me of high school, and discovering to my abject horror that Year 10 maths appeared to have given up on using numbers completely.
So when faced with a document that said the company was reporting the following, my head exploded and I nearly died. But I got better.
The announcement looked a little like this:
“The Company” is pleased to announce assay results from “Some Random Gold Project Somewhere”, including results from hole “Gibberish Hole ID Number” showing more than 45m of mineralisation:
- 10m @ 6.09 g/t Au from 8 to 18m –
- including 2.6m @ 20.81 g/t Au from 15.1m to 17.7m;
- 2m @ 9.23 g/t Au from 40m to 42m;
- 13m @ 21.91 g/t Au from 58m to 71m –
- including 0.5m @ 209 g/t Au from 60.5m to 61.0m,
- including 1.0m @ 64.0 g/t Au from 61.0m to 62.0m,
- including 1.0m @ 31.8 g/t Au from 63.0m to 64.0m, and
- including 1.0m @ 22.3 g/t Au from 64.0m to 65.0m.
So, as you can see, it’s a bunch of random nonsense to an outsider, but once you unpack what it all means, you’ll get a sense of why those particular numbers are actually a phenomenal result.
Let’s start at the beginning and break it all down, starting with understanding that these intercepts are from samples collected from a single hole drilled in the ground.
For visual reference, go to 7-11, and buy yourself a Slurpee. Stick the straw in all the way to the bottom, put your finger over the hole at the top of the straw, and pull the straw out – then, carefully, release your finger and drag the bottom of the straw along a plate.
What will come out is a tube of icy, sugary goodness – a core sample of your headache-inducing beverage – and that’s precisely how exploratory drilling for a mine works, except it’s vastly more expensive and dangerous, and there’s no guarantee there’s even any Slurpee in the cup.
Let’s say, for example, that the hole is an arbitrary 100 metres deep – and of that 100 metres, “45m of mineralisation” means there’s gold in 45 of those metres, in varying amounts.
The next step is to look at the next bit of the info, which is usually presented in the following format:
“Core sample length” @ “resource grade” of “mineral name” from “sample depth start” to “sample depth end”.
Using our Random Gold Project numbers in it, that looks like this: 10m @ 6.09 g/t Au from 8 to 18m.
That means that there is a 10m intersection (segment) of the core sample that contains 6.09 grams per tonne (g/t) of gold (Au), between the depths of 8m and 18m.
So, as a quick cheater’s guide, you basically want all of the numbers in that line of miner’s jargon to be as large as possible, with the exception of the last ones (because the deeper under the ground it is, the more it’s going to cost to bring to the surface).
Beneath that first line, there’s a second which says: including 2.6m @ 20.81 g/t Au from 15.1m to 17.7m.
The units and numbers mean the same, but they’re highlights from within the original 10 metre section (between 8m and 18m) – in this case, a 2.6m segment where the gold concentration is 20.81 grams per tonne, between the depths of 15.1m and 17.7m.
Stockhead resources legend Reuben Adams explains that investors “need to be careful when there is a super high-grade chunk within a larger intercept”.
“It’s called ‘grade smearing’, companies can sometimes intentionally mislead punters by making a potentially economic intercept look larger than it actually is.”
You can do the maths yourself online.
The above intercept would look something like this:
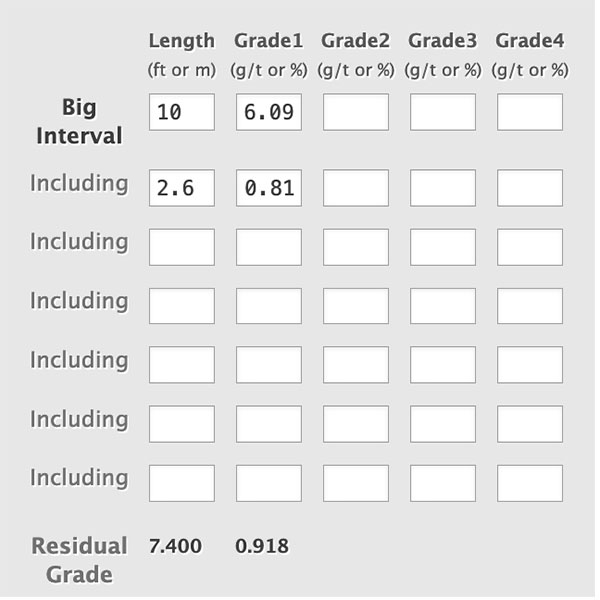
“As the graphic here clearly shows, the remaining 7.4m of the above intercept contains just 0.91 grams of gold per tonne of dirt,” Reubs said.
That, good sir, is as clear as mud. Plz explain.
That’s just the first step to figuring out what it means, because the rest of it takes some explaining as well.
Let’s start with the first thing most people say at this point: “Grams per tonne is a tiny concentration of gold” – to which the response is “well spotted!”
Grams per tonne might not sound like a lot, because it’s not – but it is indicative of what gold (and other minerals) mining looks like in the modern era.
So the idea in your head of what a gold mine might look like – an old prospector (possibly Dwarvish) with a pick, shovel and lamp in a tunnel bored into the side of a mountain, chipping individual fist-sized nuggets of gold – is entirely wrong. Mostly.
Gold mines are either very large tunnels, full of boring equipment, and trucks hauling huge quantities of dirt and rocks away to be processed.
Despite its name, that boring equipment is actually pretty interesting. My mate Ben works for a company that operates boring equipment, and part of his job is to keep track of where under Sydney that equipment is – a tremendously easy gig, since it moves at a positively glacial 5 metres per day.
The other main shape gold mines take are thumping great big massive open pits, which are also full of trucks hauling huge quantities of dirt and rocks.
And it’s a testament to both modern chemistry and the value of these minerals, that quantities that aren’t even visible to the naked eye are still economically viable for extraction.
Think of it like the internet: there are trillions of webpages, but most of them are crap. It’s the same with gold.
Ahuh… so – what’s a good grade?
That’s a great question, and the answer is simple: it depends entirely on what the mineral is and how much it is currently selling for… and a bunch of other stuff too, so actually it’s not very simple at all.
The numbers we’re discussing here are called grades, and – just to keep you on your toes – grades are reported in different ways for different resources.
For gold and similar metals, you’ll often see it reported in terms of grams per tonne, or g/t.
For more abundant minerals, particularly those that are usually found as concentrations inside larger mineral deposits – think nickel, copper, that sort of thing – you’ll see it represented as a percentage.
Lithium is almost always talked about in terms of percentages or parts per million (ppm), while other more scarcely-present resources can be represented as parts per billion (ppb) – but it’s also worth knowing that 1,000ppb is pretty much the same as 1 gram per tonne.
(I’ll pause here to mention that lithium, the current market darling, is its own beast in terms of assay results – there are two main ways of mining it, very different from each other, depending on whether its dissolved in brine or bound up in other material like pegmatite. It’s very complicated, and one day I’ll understand it well enough to have a stab at explaining that to you. Maybe.)
Given that there are so many variables besides simple grade that dictate whether a mine is viable, it’s near-on impossible to say “X amount is what you’re looking for”, but luckily there are some easy-to-spot terms for newbies to keep an eye out for.
For gold, the words you’re probably looking for are “bonanza grade”, because that usually means there’s a very high volume of desirable stuff, compared to the otherwise useless dirt and rock around it.
And so, because the simple numbers on their own don’t tell the whole story, it’s vital to bear in mind that the grade is not the be all and end all. They’re important, but they’re definitely not the everything.
A moderate to good grade “from surface”, ie it’s right there where your boots are, can be a lot cheaper to mine than a bonanza grade find that’s 300+ metres under countless tonnes of other garbage, like – for instance – Adelaide.
Great. I get it. Can I go and have a punt now, please?
Yeah, you might just want to keep it in first gear a while longer there, sport – because another crucial part of the puzzle is understanding where in the exploration cycle these results are coming from.
So an understanding of the life cycle of a mining company through its exploration phase is essential in getting a handle on when it’s time to start throwing money at it and having a better than average chance of maybe seeing more money come back.
The first phase is Exploration, which is often handled by little (like, seriously little) companies. In some cases just a handful of geo-nerds and a fella who’s good with maps and another bloke who also has a mate who will lend them a HiLux for the weekend in the bush.
And that exploration takes a number of forms, from the very early days of poring over geological survey maps to get a sense of where there might be something worth spending money on, to getting boots on the ground to poke around in person.
(This bit is often made a lot easier by looking to see who else has found gold in a region, and buying the block next door. It’s referred to as “nearology”, and is about as precise a science as the obviously made-up name suggests.)
It’s at this stage that companies might start to make some noises about what they’ve found – and that usually starts with “rock chip samples” which are, as the name suggests, chips of rock that the team picks up off the ground, which (in a perfect world) get sent off to a lab to be assayed.
Rock chip analysis is, incredibly, almost-always massively positive news, often returning chemical analysis showing that an unremarkable-looking chunk of the Western Australian desert (including all resident wildlife) is actually made entirely out of uranium.
That’s because it’s only the most dim-sighted rock-hound who is likely to pick up a chunk of something that isn’t what they’re looking for, and spending money having a lab confirm that it’s a house brick.
So… while it’s a good sign that there’s some of the target mineral there, it’s definitely not a solid indicator that there’s much of it there, let alone a quantity worth mining.
Rock Chip analysis often coincides with preliminary field assays, using a Portable X-Ray Fluorescence (pXRF) device – which, and I’m doing my best to be kind here – is tantamount to a high-tech version of pawing through the entrails of a sheep to determine the species of tree that you murdered it under.
The problem with pXRF is that while assay results can give you the mineral properties of a whole sample, XRF is limited in its scope.
It’s a hugely unreliable means of making a statement about the size, grade or overall quality of a mineral find – so much so, that whenever a mining company does make an excited announcement based on pXRF data, it’s also required to very clearly remind potential investors just how unreliable the tech is for making those sorts of claims.
At least once a month over the past year, there’s been a junior explorer with a banner headline find that’s been forced by the ASX to provide more data, or – in extreme cases – withdraw the announcement entirely because it’s based solely on pXRF results.
Thing is, in the rush to be ‘in on the ground floor’, a lot of newbie investors see big grades, miss the bit where it says “pXRF readings”, start throwing money at the company and it’s at triple digit gains before lunchtime.
There’s no “backsies” if the company catches a speeding ticket, though – so if you’ve stuck a lazy $1,000 on a horse that turns out to be three motorcycles taped together, you’re in line to kiss that money goodbye.
The gear you’re most likely looking for are actual laboratory assays – proper, catalogued drill samples that have been sent off for thorough chemical analysis, which the company will then have to report (whether they’re good, bad or just plain embarrassing).
The good news is that most companies will give you a heads-up that assay results are on the way – not with a specific day they’re going to drop, but usually in the form of an announcement that the current drill program is finished, and that “assay results are expected in the next 4-6 weeks”.
From there, the exploration continues, with the company adding more and more data to what they already have, in order to define a “mineral resource” – a total of what they reckon is lurking under the surface.
I’m glossing over this a little, because I’m conscious that we’re all going to die of old age if I don’t wrap this up quickly, but the gist of it is simple: The more mineral that’s there, the more likely it is that the mine will go into production.
So there’s more drilling, and more data released to the market, and this is usually the stage that more risk-averse investors will start nosing around.
Mineral Resource Estimates talk in big numbers – like million ounces (Moz) and million tonnes (Mt) – and usually look somewhat similar to the early assay results, but different enough to still be confusing.
But basically, if there’s a big number, and a smaller one, the big one is how much ore there is to work with, and the smaller number will be how much of the good stuff is there to be processed out.
The Gold Standard for mineral resource estimates is known as a JORC compliant MRE – JORC referring to “The Australasian Code for Reporting of Exploration Results, Mineral Resources and Ore Reserves”, which is “a professional code of practice that sets minimum standards for Public Reporting of minerals Exploration Results, Mineral Resources and Ore Reserves.”
It’s about as iron-clad as pre-production estimates of how much gold (or whatever) is under the ground – and it comes in two flavours: Measured and Indicated (meaning it’s been physically proven), or Inferred (meaning that it’s a highly-educated guess using very exacting methods).
There are more steps between that and going into production, but it’s late, I’m tired and I’m quietly certain you stopped paying attention hours ago so that’s going to need to wait until another day.
At Stockhead, we tell it like it is. While De Grey Mining is a Stockhead advertiser, it (clearly) did not sponsor this article.

Related Stories


UNLOCK INSIGHTS
Discover the untold stories of emerging ASX stocks.
Daily news and expert analysis, it's free to subscribe.
By proceeding, you confirm you understand that we handle personal information in accordance with our Privacy Policy.


