Spring Property 2022: Five ways this year will belong to the buyers

Via Getty
Eliza Owen works for CoreLogic, but on a more fundamental level, she works for all of us.
As the housing data firm’s Head of Australian Research, Eliza has forgotten more about housing pain than you or I will ever know.
Even more importantly she’s property agnostic. That means Eliza doesn’t think God owns his own home. And she doesn’t care where she lives. And she’s also neither on the side of the buyer or the seller, nay, not even the transaction.
Eliza does it for the property. And not just Sydney’s eastern suburbs property, but for all Australian property.
The cheap property. The over-priced property. The lost property, the second-hand property and most especially our own national propensity for property.
Having said that, the team of unfeeling economists at Westpac bank are now calculating that the cash rate (OCR) could increase to 3.10% by Christmas (OMG).
The full summit of rate rises won’t be achieved until February, when the OCR will be 3.35% (JCOAB).
And after Tuesday’s extra 50 basis points the cash rate is now 2.35%, the highest rate since the beginning of 2015.
As a result, variable mortgage rates are rising sharply for both new and existing borrowers which means that for the average variable punter like you and I and Eliza, the average variable rate on our borrowed money will be well beyond 5%.
Analysis from the Canstar Group-owned comparison website RateCity.com.au puts it like this, in bullet form, my fav:
Owner-occupiers:
➡ 5.11% will be the average existing customer variable rate for owner-occupiers.
➡ Under 4% will be a competitive variable rate for owner-occupiers paying principal and interest.
➡ About a dozen lenders are likely to have variable rates under 4%.
Investors:
➡ 5.46% will be the average existing customer variable rate for investors.
➡ Under 4.30% will be a competitive variable rate for investors paying principal and interest.
➡ About a dozen lenders will have investor variable rates under 4.30%.
So when we say she works for CoreLogic, we really mean she works for all Australians and many, many wealthy foreigners. And possibly the families of dictators our government finds beneficial to keep tabs on for later exploitation.
The point is: she’s good people.
But that certainly hasn’t stopped us here at Stockhead from hacking into her personal property and stealing a lot of Bitcoin (BTC) and the following Spring selling secrets – which after much debate across the entire newsroom, we’ve decided to share.
(Peter originally thought we could auction them to the highest bidder. But then he read the first one.)
Are you ready?
Five things to know for the 2022 spring selling season
➣ New listings and auctions will rise in the coming weeks
➣ The seasonal uplift in new listings will vary between regions
➣ It won’t be the bumper spring selling season we experienced last year
➣ Long-term owner-occupiers more likely to sell
➣ Sellers will have to listen to buyer feedback, and be flexible on price
The, after realising none of us understand real estate good, we sent in the German black ops team we like for this kind of journalism and took Eliza.
Back at the undisclosed location (3 bedrooms, double brick, close to public transport and water views) we disposed of the Germans, redistributed the BTC and got the answers we were looking for.
What follows is a redacted verbatim PG-13 version of what Ms Owen said. Except for the rude words. And some of the hoity-toity commentary and most of the insults.
EXT. Day.
Eliza walks through a Sydney park in springtime, let’s call it Centennial. Bees buzz and birds sing as she talks to the camera. She offers her forearm and a small eagle lands on it.
“Hello. I’m Eliza Owen. It’s great to be here on this beautiful Sydney spring morning, although as a pre-enactment of my kidnapping by members of the Stockhead editorial team and what appeared to be several former officers of the German army’s Kommando Spezialkräfte, I am currently being held at an undisclosed location (3 bedrooms, double brick, close to public transport and water views and judging by the taste of the wind and distance from the CBD, I’m thinking Randwick) against my will and speaking these words under duress – namely one of the KSK officers appears to have a Dannii Minogue box set (Ed: A bootleg edition of Danni Live in Bathurst – My Goodest Hits. Works every time). So while I appear to be in a Sydney property version of a David Attenborough documentary, I am in fact a victim of anti-social media and also worried my head will explode.
Let’s get this over with so I can get my Bitcoin back, have a glass of mead and get on with my selfless existence of watching Bitcoin lose value – where was I, ah yes…
Traditionally, for the Australian property market, spring is a time of fervent activity as sales and listings increases.
However, this spring is expected to hit a little differently amid higher mortgage rates, weak consumer sentiment, stretched household budgets and weaker buyer interest. Buyer segments may perform differently than others, and there’s likely to be a variety of activity levels throughout the regions too.
Let’s go through some of the key trends we’re expecting across this spring selling season using the latest top secret data and insights from my loving overlords at CoreLogic, all hail the data, in the data we trust.
➣ New listings and auctions will begin to rise in the coming weeks
‘New’ listings are the freshly advertised properties for sale, where the start of the campaign was in the past 28 days. To avoid counting ‘re- ‘listings’, a new listing will be excluded if it was also listed within the past 75 days. New listings are the flow of properties added to the market, or the new properties popping up when you refresh a listings page.
Here’s a rolling count of new listings of national dwellings compared with 4 years prior:
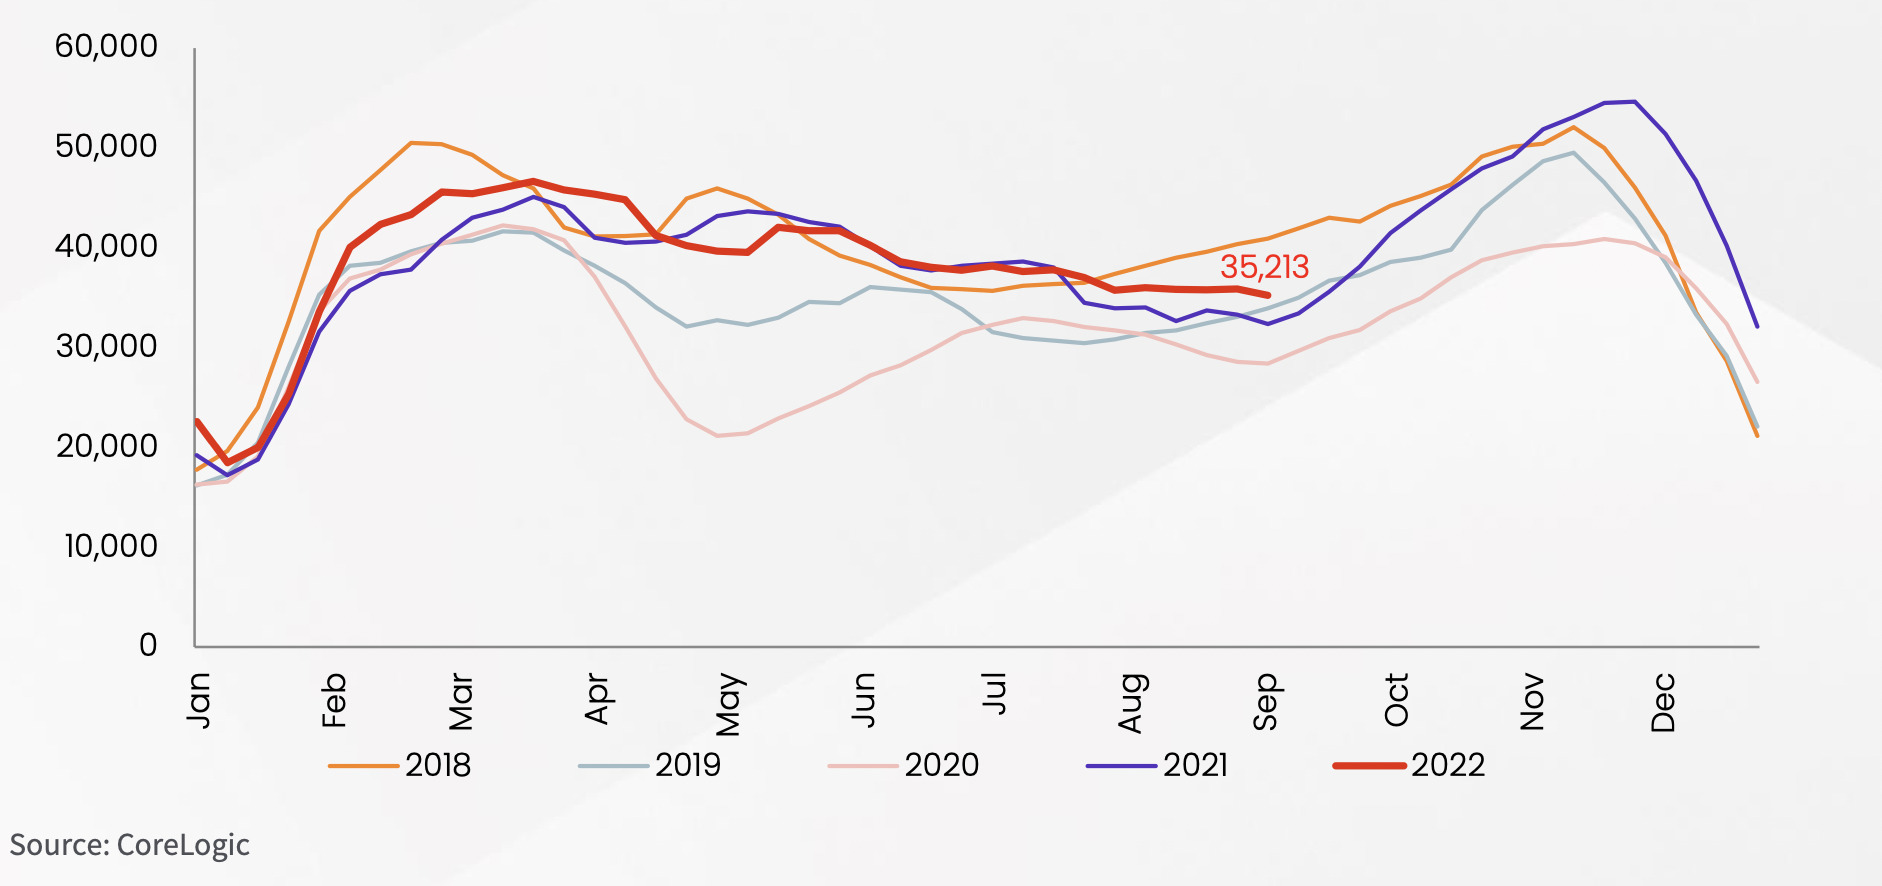
As you can see by the reddest squiggly line, in the 28 days to September 4th, there were 35,213 new listings advertised across Australia, which is higher than the equivalent period over the previous 3 years.
Yes, the new listings red line is trending lower, but I’ve got some data points that say a lift is on its way in the next few weeks.
- A count of the Comparative Market Analysis ‘CMA activity’, a leading indicator of rises and falls in listings volumes shows in final seven days of August, volumes rose 8.2%, indicating the seasonal lift in new listings is ready for take off.
2. The lift in listings is also expected to flow through to the auction market, where the number of properties going under the hammer across the combined capital cities typically lifts from September, and continues rising through to the start of December.
Here’s a rolling 4-week count of auctions, 2022 versus previous years
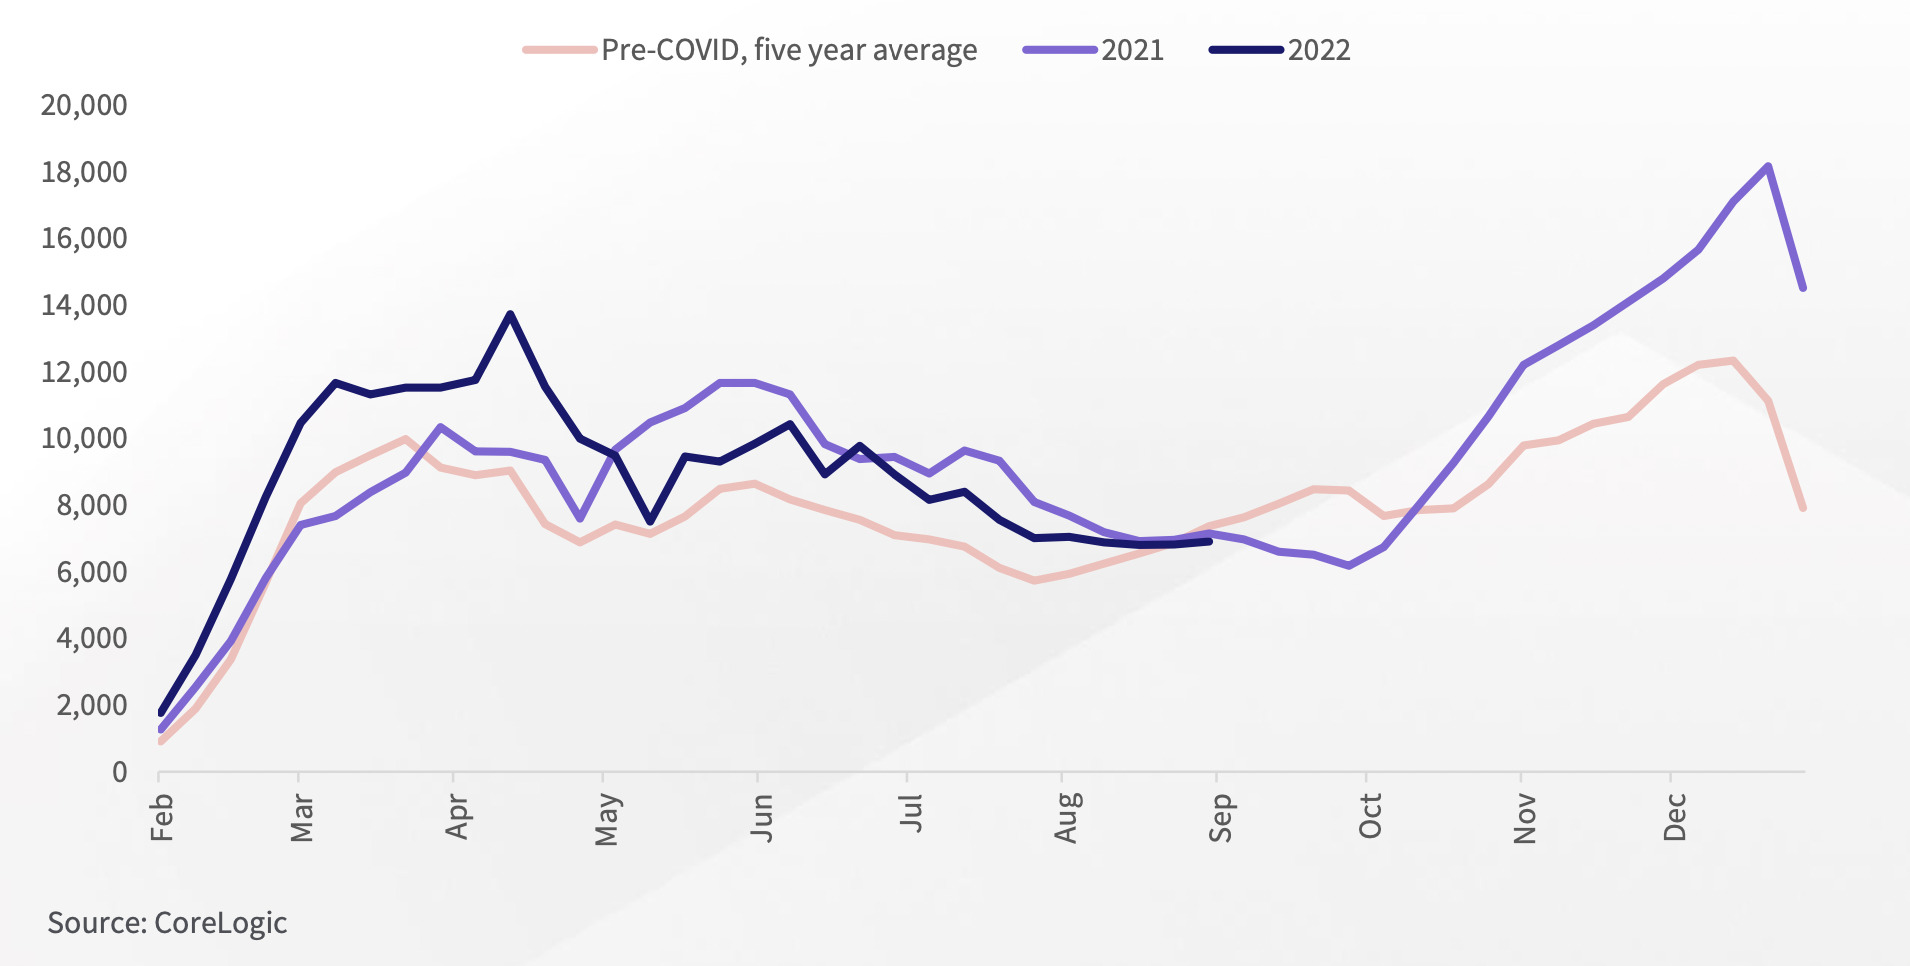
In the five years prior to the pandemic, new listings campaigns nationally have increased 19.6% on average between winter and spring.
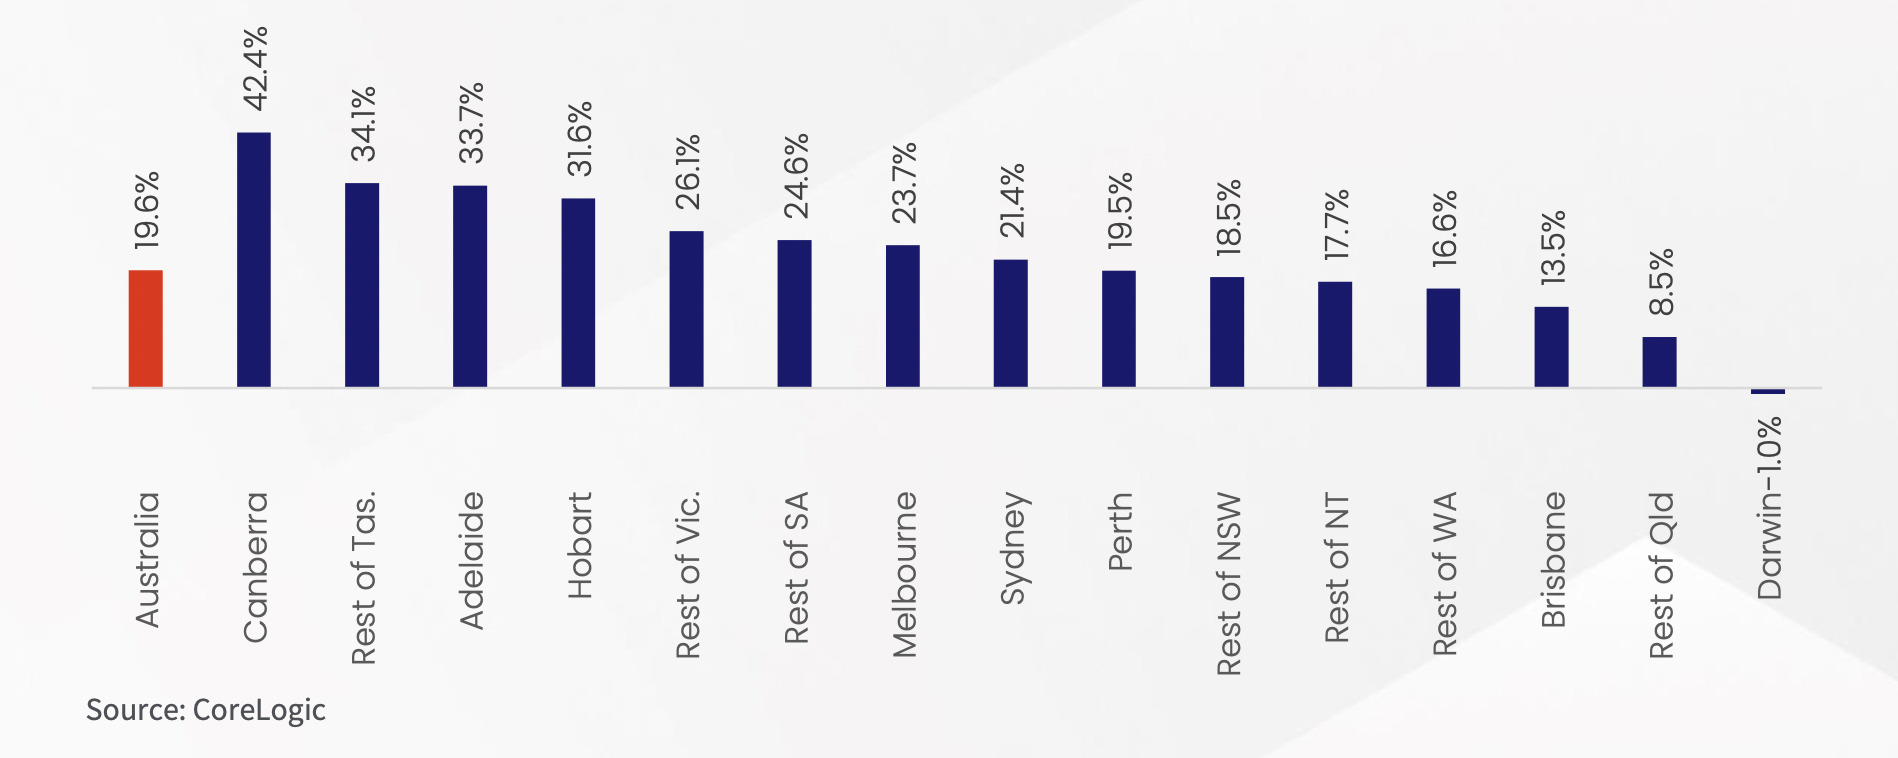
➣ The seasonal uplift in new listings will vary between regions
The seasonal bump varies between cities, with cooler climate areas like Canberra (42.4%), Adelaide (33.7%) and Hobart (31.6%) typically seeing a larger seasonal effect than more temperate markets.
Here’s the average volume change in new listings – winter to spring (2015-2019)
Check out this wonderful more granular yet sparsely formatted figure – it’s simplicty in motion, yet chic and urbane.
It’s a Local Government Authority (LGA) view of which markets see the biggest uplift in new properties advertised between winter and spring.
Between 2015 and 2019, the volume of new listings added to the market has on average doubled across Adelaide Hills in this period.
Also, many regional, hip lifestyle areas like the Mornington Peninsula, Yass Valley, Surf Coast and Huon Valley see a right uplift in new listings through spring.
Given home values across Adelaide have only just passed a peak in value, many sellers across the city may show interest in ‘cashing in’ this spring selling season.
Despite a -0.1% fall in the CoreLogic Home Value Index for Adelaide, values are still almost 45% higher since COVID-19’d back in March 2020.
➣ It won’t be the bumper spring selling season we experienced last year
No it won’t.
2021 had a particularly ‘bumper’ spring selling season, which is unlikely to be replicated this year, because, like… have you even been watching?
CoreLogic estimates there were 154,294 new listings added to the market through spring 2021, higher than the previous decade spring average of 144,985. Late 2021 also saw record-breaking auction volumes, with the highest count of auctions since forever for the week ending December 12th (4,981).
More listings were likely concentrated at the end of 2021, because rising COVID cases and extended lockdowns across parts of the country would have made it difficult to sell from June to early October.
In other words, sellers were playing ‘catch-up’ as pent-up demand from vendors was unleashed once lockdowns ended. In addition, annual capital growth rates averaged 21.3% nationally through spring last year, creating a big incentive for vendors to ‘cash in’ on price booms.
Coming into spring 2022, market conditions are very different. Buyer appetite is falling against higher interest rates, properties are taking longer to sell, and vendors are having to offer greater price discounts in order to get deals done.
➣ Long-term owner-occupiers more likely to sell
An interesting feature of a housing market in decline is average hold periods of sold properties rise.
This phenomenon is seen below, which shows the median hold period of national sales over a rolling 12-month period, compared with the annual change in dwelling values. Twelve-month hold periods have been elevated amid the current downturn, as well as the downturn from 2017-2019.
Here’s the national property value changes and median hold period:
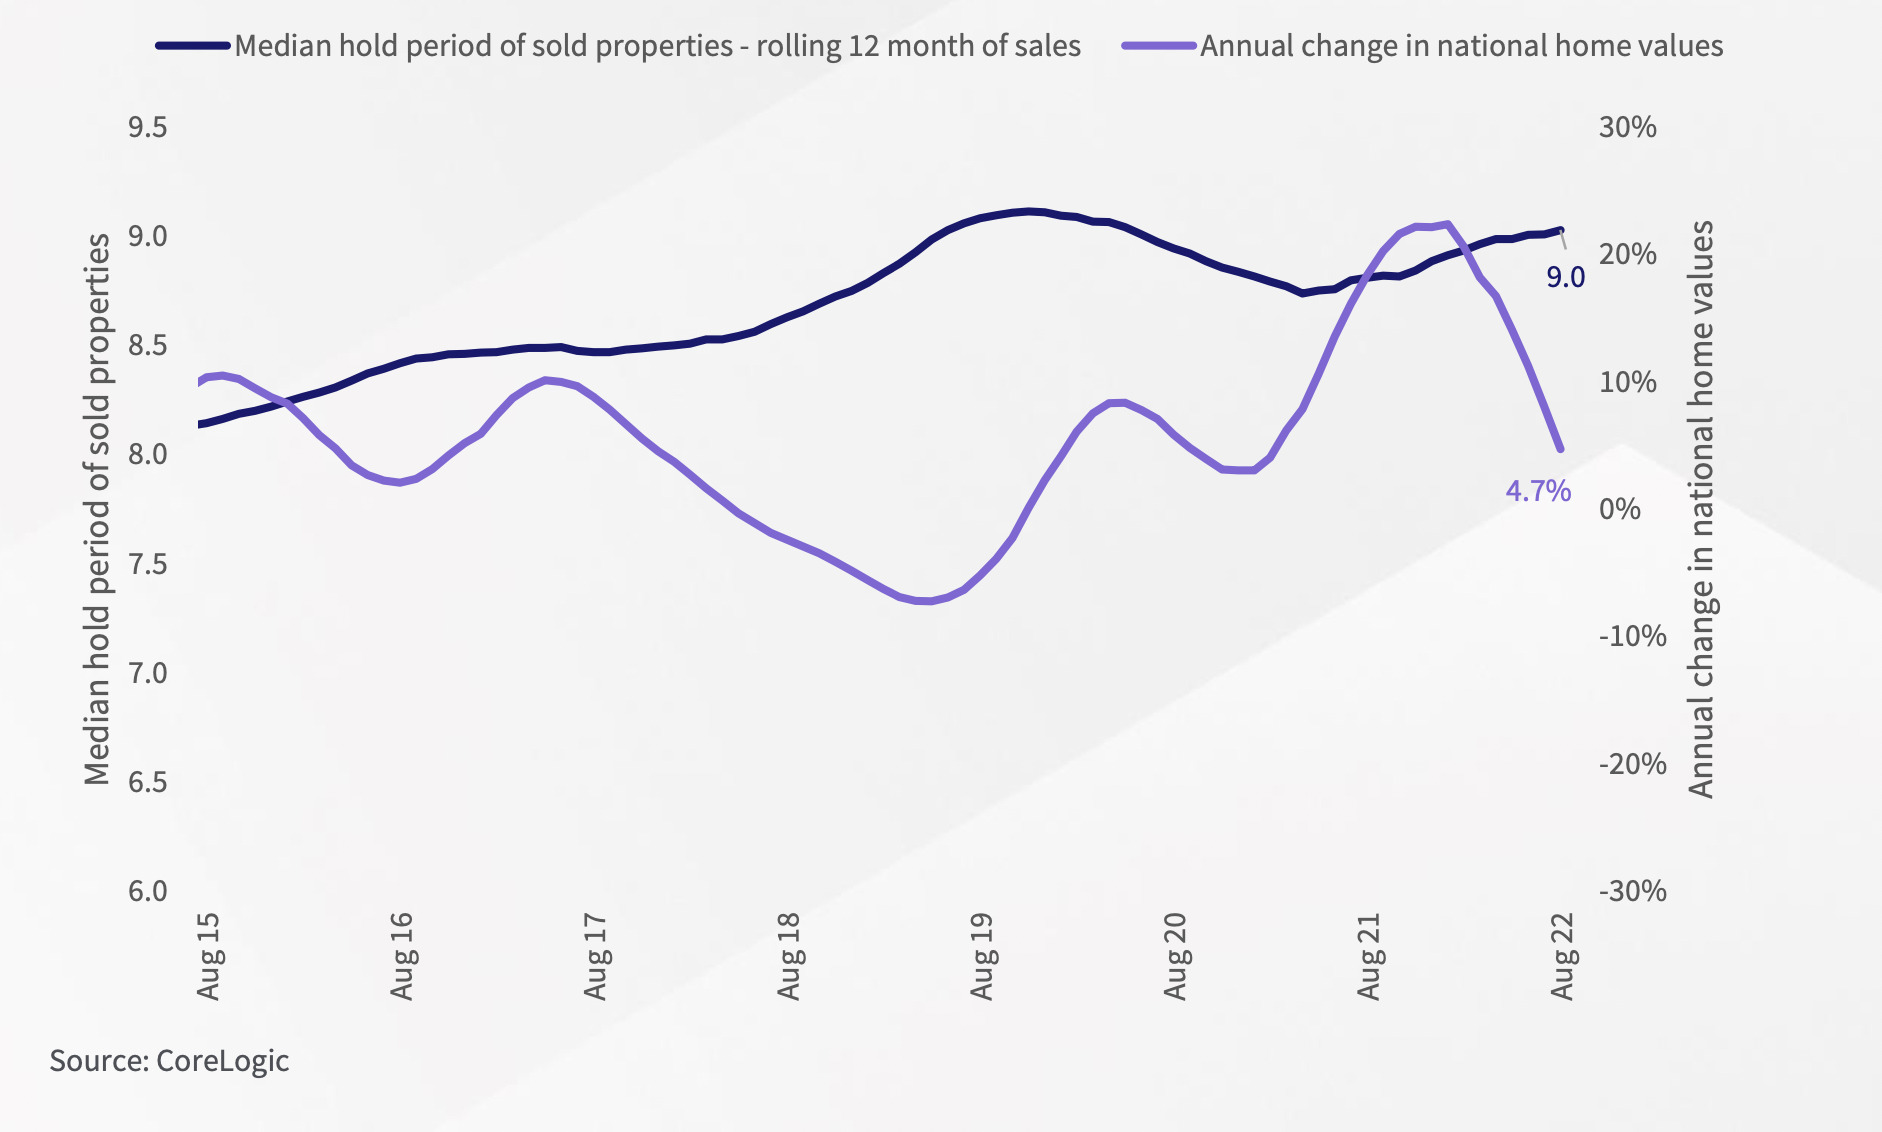
This is because recent buyers are at more risk of making a nominal loss if they sell during a downturn. Meanwhile, those who have held their property for longer are more likely to have made nominal gains, even if the market is going through a short-term, cyclical downswing.
Recent research by CoreLogic suggests home values have generally trended higher over time, and increased more than 380% in the past 30 years. Meanwhile national home values are sitting just 4.7% higher over the past 12 months, with annual value changes likely to hit negative territory over the course of the cycle.
➣ Sellers will have to listen to buyer feedback, and be flexible on price
While both buyers and sellers become more active during the spring selling season, this doesn’t make it a seller’s market.
Properties are taking longer to sell, with median days on market up to 33 days in the three months to August, which has increased from a low of 20 days
in November last year.
The discounts between initial listing prices and contract sale prices (otherwise known as ‘vendor discounting’) has also become larger as shown in figure 6, with the median discount sitting at -4.0% nationally. Similarly, auction clearance rates across the major auction markets are consistently below average.
Serious vendors will need to be realistic about their price expectations and ensure they have a quality marketing campaign behind the property in what is likely to be a more competitive selling environment through spring and early summer.
And this one’s the Median vendor discount of sales – rolling 3 months – national:
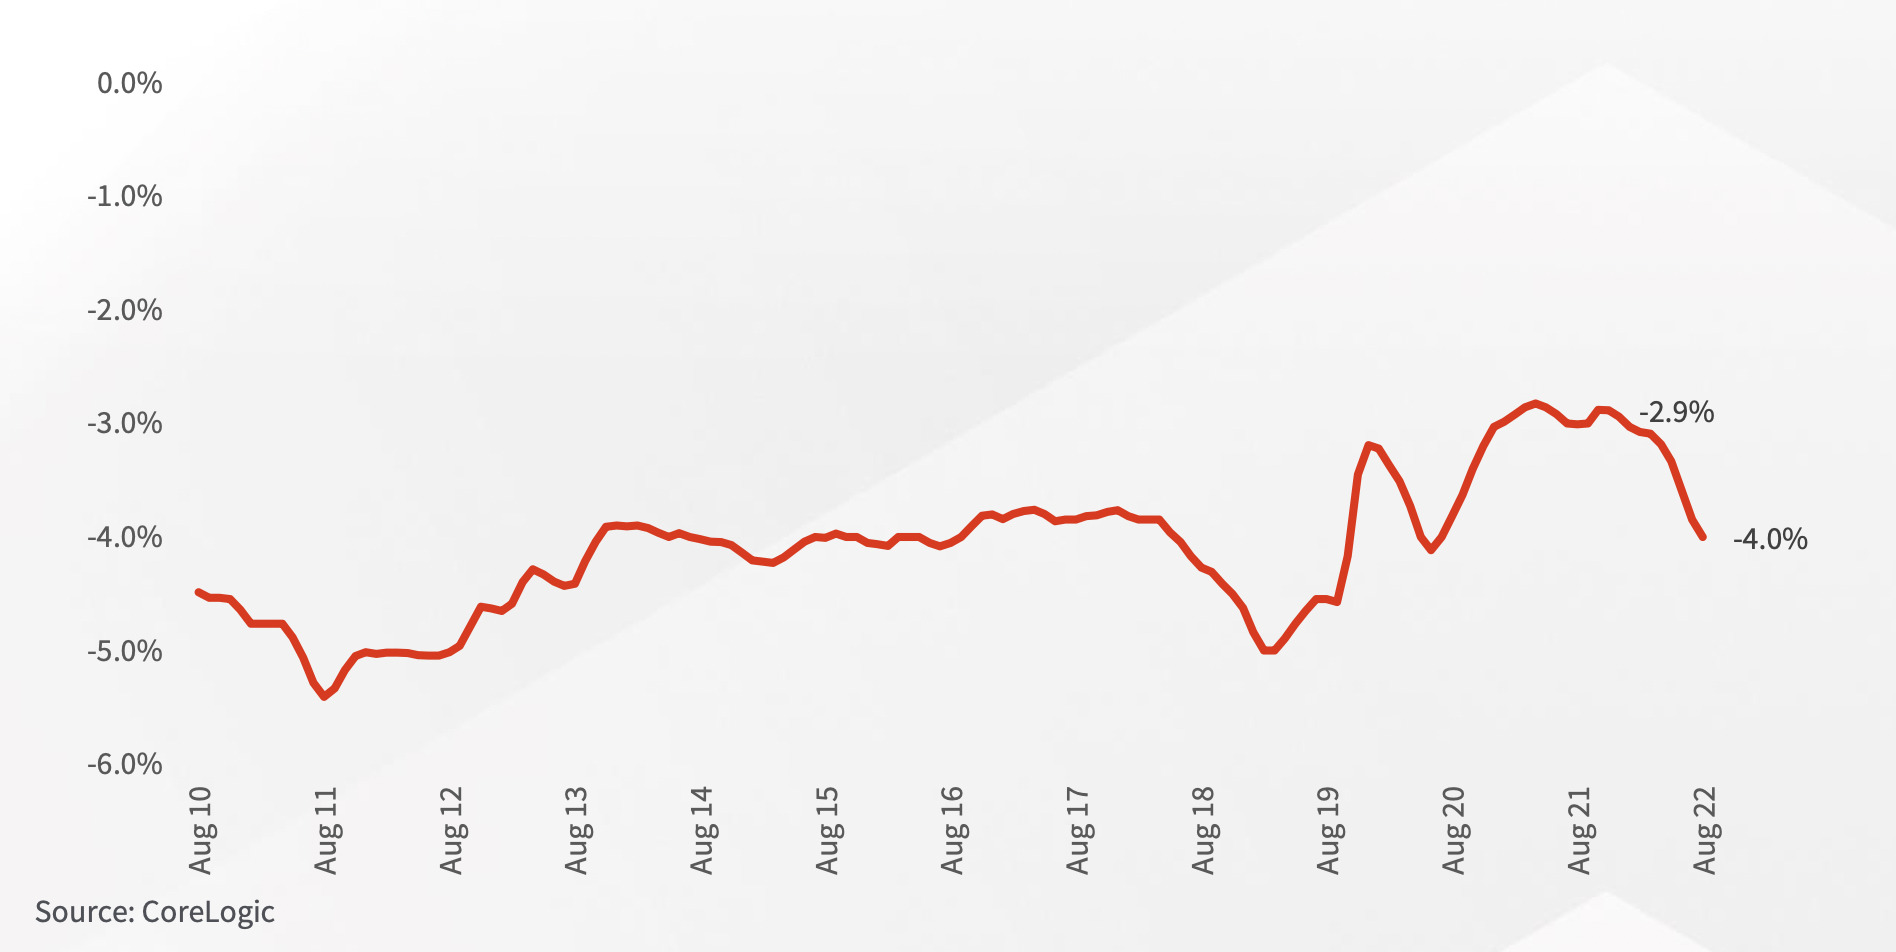
This reduction in price is largely a function of rising mortgage rates, where buyers may not be able to afford as much debt as they could a few months ago. The average owner-occupier home loan size has fallen nationally, from a recent high of $617,608 in January of 2022, to $609,043 in July.
As the cash rate is expected to rise further in the coming months, borrowers may become more constrained.
Now please. Get help.
Related Topics
Related Stories


UNLOCK INSIGHTS
Discover the untold stories of emerging ASX stocks.
Daily news and expert analysis, it's free to subscribe.
By proceeding, you confirm you understand that we handle personal information in accordance with our Privacy Policy.


