Real estate mania will continue through 2022. Here’s how investors can benefit

Pic: Stevica Mrdja / EyeEm / EyeEm via Getty Images
The global real estate market – covering industrial, retail, offices, hotel, leisure and residential — is expected to have another strong year in 2022 as the post-COVID recovery continues to accelerate.
Oxford Economics combined 97% of the global property index into its Global Economic Model to forecast overall returns of 8% in 2022.
While it’s all upside, some sectors and jurisdictions will perform better than others, it says.
Industrial properties lead the way
The established shift to online sales and a still-high share of spending on goods mean that the industrial sector – particularly distribution, warehousing, and urban logistics – should continue to offer superior returns, Oxford says.
“We expect 2022 returns to cool relative to 2021, but the sector is still likely to see the second-highest annual return on record at 14.2%,” Oxford chief global economist Innes McFee says.
Residential demand ‘like 2021’
Global investor demand for residential properties in 2022 is expected to generate another strong year for returns, Oxford says.
“The defensive characteristics of the residential sector, combined with the long-term demand drivers of urbanisation, smaller households, and affordability constraints on home ownership will continue to attract capital,” McFee says.
“We estimate global residential returns of 8.6% in 2022, similar to 2021 and the highest since 2015.”
Chad Hoy Poy, national lending manager at Australian digital lending and payment provider WLTH, adds that the reopening of international borders in 2022 could see cashed-up overseas investors clamber to enter the booming Australian property market.
Office, retail, hotel and leisure improve — but still below pre-COVID average
Office and retail returns have suffered much more than industrial and residential in the pandemic but Oxford expects the gap to start narrowing.
“Returns of 6.6% and 5.9% in 2022 respectively, while still lagging, will represent a big improvement on 2020 and 2021 (particularly for retail),” McFee says.
“The hotel and leisure sector returns have clearly been most damaged by the pandemic, falling more than 5% in 2020 alone.
“We expect the sector to continue to make up ground in 2022, but with business travel lagging the recovery, the 5.2% returns we expect this year are still below the pre-pandemic average.”
Property winners and losers
Here’s how a basket of ASX stocks with exposure to the property market are performing>>>
| CODE | COMPANY | WEEKLY RETURN % | 1 MONTH RETURN % | 6 MONTH RETURN % | 1 YEAR RETURN % | SHARE PRICE | MARKET CAP |
|---|---|---|---|---|---|---|---|
| GMG | Goodman Group | 2 | 9 | 28 | 33 | 24.475 | $ 45,808,818,372.68 |
| SCG | Scentre Group | 6 | 3 | 18 | 15 | 3.19 | $ 16,453,499,334.63 |
| DXS | Dexus | 3 | 0 | 10 | 14 | 11.14 | $ 12,057,086,407.66 |
| MGR | Mirvac Group | 4 | -1 | 6 | 11 | 2.925 | $ 11,591,444,693.22 |
| SGP | Stockland | 1 | -7 | -2 | -1 | 4.45 | $ 10,622,913,895.90 |
| GPT | GPT Group | 5 | 1 | 14 | 15 | 5.3 | $ 10,075,937,281.80 |
| CHC | Charter Hall Group | 2 | 9 | 42 | 47 | 19.25 | $ 8,947,578,686.51 |
| VCX | Vicinity Centres | 4 | 0 | 16 | 8 | 1.7775 | $ 8,057,527,383.66 |
| LLC | Lendlease Group | 8 | 1 | -9 | -24 | 10.96 | $ 7,260,027,455.86 |
| GOZ | Growthpoint Property | 3 | -1 | 13 | 15 | 4.185 | $ 3,234,918,771.34 |
| SCP | SCA Property Group | 3 | 2 | 22 | 15 | 2.895 | $ 3,208,458,203.50 |
| PXA | Pexagroup | 3 | 13 | 18.03 | $ 3,188,317,668.24 | ||
| CLW | Chtr H Lwr | 4 | -2 | 3 | 2 | 4.91 | $ 3,119,009,338.20 |
| ABP | Abacus Property Grp. | 4 | -1 | 23 | 18 | 3.63 | $ 3,002,877,250.33 |
| NSR | National Storage | 3 | 0 | 20 | 31 | 2.455 | $ 2,923,196,998.98 |
| BWP | BWP Trust | 1 | -3 | 0 | -2 | 4.14 | $ 2,665,892,782.45 |
| CNI | Centuria Capital | 3 | -1 | 24 | 34 | 3.29 | $ 2,568,052,860.75 |
| CQR | Charter Hall Retail | 2 | 2 | 17 | 8 | 4.23 | $ 2,452,329,007.92 |
| INA | Ingenia Group | -1 | -7 | 14 | 37 | 6.14 | $ 2,390,352,605.29 |
| CIP | Centuria I REIT | 3 | 1 | 9 | 21 | 3.77 | $ 2,373,425,467.50 |
| CMW | Cromwell Prop | 4 | 5 | -6 | -9 | 0.8625 | $ 2,251,024,780.50 |
| HMC | Home Consortium | -1 | -4 | 61 | 96 | 7.58 | $ 2,232,148,269.95 |
| LIC | Lifestyle Communit. | -4 | -13 | 50 | 81 | 20.23 | $ 2,112,857,097.51 |
| WPR | Waypoint REIT | 3 | -4 | 6 | -1 | 2.69 | $ 1,941,312,015.02 |
| AVN | Aventus Group | 1 | -2 | 20 | 28 | 3.42 | $ 1,925,064,467.39 |
| ARF | Arena REIT | 3 | 2 | 29 | 62 | 4.51 | $ 1,541,377,427.20 |
| CQE | Charter Hall Soc In | 3 | -1 | 14 | 27 | 3.77 | $ 1,350,996,600.17 |
| COF | Centuria Office REIT | 1 | -6 | 3 | 3 | 2.29 | $ 1,340,195,213.25 |
| HDN | Homeco Daily Needs | 1 | -3 | 10 | 9 | 1.46 | $ 1,136,265,420.29 |
| RFF | Rural Funds Group | 6 | 7 | 26 | 12 | 3 | $ 1,132,660,530.54 |
| LEP | ALE Property Group | 2 | 0 | 27 | 22 | 5.6 | $ 1,118,549,027.70 |
| ADI | Dexus Industria REIT | 0 | -3 | 7 | 15 | 3.33 | $ 1,040,469,948.86 |
| IAP | Irongate Group | -3 | 0 | 9 | 23 | 1.575 | $ 1,038,951,819.29 |
| URW | Unibailrodawestfield | -2 | 0 | -7 | 11 | 4.98 | $ 979,252,065.00 |
| HCW | Hlthcohcwellnsreit | 3 | 0 | 2.215 | $ 728,344,093.12 | ||
| HPI | Hotel Property | 0 | -3 | 10 | 13 | 3.5 | $ 672,172,823.87 |
| GDI | GDI Property Grp | 0 | -5 | 2 | -8 | 1.105 | $ 596,296,686.05 |
| PPC | Peet | 2 | 1 | -9 | 5 | 1.1 | $ 524,381,030.57 |
| REP | REP Essential Prop | -1 | -4 | 0.98 | $ 505,451,571.18 | ||
| DXC | Dexus Conv Ret REIT | 4 | 0 | -4 | -5 | 3.51 | $ 484,234,977.36 |
| CWP | Cedar Woods Prop. | -2 | -11 | -19 | -14 | 5.45 | $ 455,809,578.60 |
| SRV | Servcorp | -13 | -1 | 16 | 24 | 4 | $ 411,476,024.00 |
| SDG | Sunland Group | 3 | 11 | 24 | 50 | 2.8 | $ 392,930,308.05 |
| AOF | Australian Unity Off | 0 | 1 | -4 | 7 | 2.35 | $ 381,369,573.84 |
| GDF | Garda Prpty Group | 0 | 0 | 18 | 23 | 1.565 | $ 357,401,646.77 |
| CDP | Carindale Property | 1 | 0 | 8 | 13 | 4.7 | $ 340,019,022.78 |
| UOS | United Overseas Aust | -3 | -8 | -13 | -12 | 0.68 | $ 336,699,113.40 |
| ECF | Elanor Comm Prop | 1 | 1 | 4 | 2 | 1.1 | $ 309,521,767.50 |
| AVJ | AVJennings | -3 | -3 | 7 | 6 | 0.59 | $ 239,676,129.52 |
| APZ | Aspen Group | -4 | 2 | 34 | 34 | 1.63 | $ 227,347,299.30 |
| WOT | Wotso Property | 0 | 0 | 3 | -3 | 1.385 | $ 225,646,501.87 |
| FRI | Finbar Group | -3 | -8 | -5 | -1 | 0.795 | $ 216,337,897.89 |
| EGH | Eureka Group | -4 | 4 | 13 | 53 | 0.675 | $ 164,268,263.60 |
| ERF | Elanoretl Property | -2 | 5 | 7 | 8 | 1.12 | $ 143,038,252.00 |
| URF | US Masters Res Fund | -4 | 3 | 29 | 5 | 0.335 | $ 132,638,033.72 |
| MEA | McGrath | -2 | 9 | 3 | 58 | 0.63 | $ 98,441,461.65 |
| SSL | Sietel | 3 | 6 | 25 | 26 | 8.45 | $ 67,663,197.55 |
| UUL | Ultima Utd | -24 | 12 | -10 | 34 | 0.715 | $ 52,781,417.28 |
| APW | Aims Pror Sec Fund | 0 | -6 | 6 | -18 | 1.17 | $ 52,185,607.11 |
| DGH | Desane Group Hldings | 0 | 3 | 2 | -2 | 1.22 | $ 49,091,988.00 |
| AXI | Axiom Properties | 2 | 6 | 48 | 85 | 0.095 | $ 41,107,797.51 |
| MPX | Mustera Property Grp | 0 | 0 | 0 | -6 | 0.27 | $ 38,943,485.64 |
| BHL | Boyuan Holdings | 0 | 0 | 0 | 38 | 0.11 | $ 37,744,311.00 |
| ACU | Acumentis Group | 16 | 3 | 50 | 38 | 0.18 | $ 31,282,648.56 |
| TIA | Tian An Aust | 0 | 2 | -11 | 19 | 0.31 | $ 26,848,737.30 |
| VOL | Victory Offices | -10 | -26 | -30 | -56 | 0.14 | $ 22,098,722.24 |
| AU1 | The Agency Group Aus | 2 | -8 | 7 | 4 | 0.049 | $ 21,000,252.62 |
| HGL | Hudson Investment | 0 | 2 | 19 | -11 | 0.31 | $ 18,401,579.85 |
| LHM | Land Homes Grp | 0 | 6 | 113 | 113 | 0.017 | $ 17,839,617.88 |
| CAQ | CAQ Holdings | 0 | 0 | -16 | -70 | 0.016 | $ 11,484,580.50 |
| KLO | Kingsland Global | 0 | 0 | -39 | -67 | 0.023 | $ 9,315,000.00 |
| FE8 | Faster Enterprises | 0 | 0 | 0 | 0 | 0.049 | $ 5,433,385.14 |
| GPS | GPS Alliance | 0 | 0 | 3 | -25 | 0.041 | $ 5,348,806.25 |
| IEQ | International Equiti | 0 | 0 | 0 | 0 | 0.035 | $ 4,487,825.20 |
| AGJ | Agricultural Land | 0 | 0 | 0 | 0 | 0.03 | $ 2,744,175.63 |
| RPG | Raptis Group | 0 | 0 | 10 | 10 | 0.033 | $ 2,095,049.81 |
What do ASX large cap property stocks think?
The big boys of ASX property all agree there is plenty of upside in 2022, and beyond.
Industrial
The ASX’s biggest industrial property group has fingers in Australia, New Zealand, Asia, Europe, the United Kingdom, North America and Brazil.
Focused on the “retail revolution” (aka online shopping), it expects earnings per share growth of more than 15% year-on-year in FY22.
This is on what was already a solid result in FY21 where GMG achieved operating profit of $1.2 billion — up 15% on the prior year — and statutory profit of $2.3 billion.
“The world is changing. The way we live, shop and work, has evolved. Industrial real estate is now recognised as essential infrastructure to support people’s changing lifestyles in the digital economy,” GMG chief exec Greg Goodman said last week.
“These are structural changes that Goodman has spent the last decade preparing for.
“We’ve positioned our portfolio to leverage the ongoing e-commerce and retail evolution – and the increased consumer expectations that go with it. Demand for high-quality locations close to consumers has never been greater.
“This is reflected in the strong results we saw in FY21, and is continuing into this financial year, where we expect our assets under management to grow to over $70 billion.”
The $45.64bn market cap stock is up 8.3% over the past month, and 26% year-to-date. The share price is currently at its highest point since the GFC in 2007-2008.
Retail
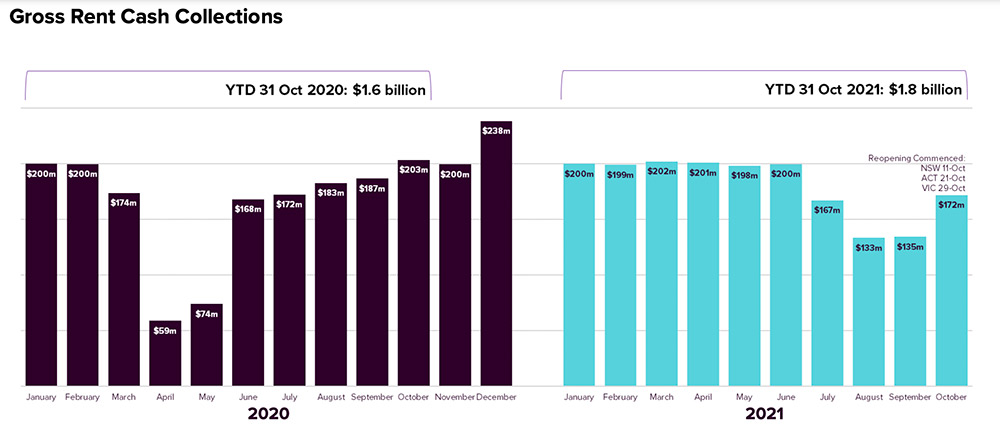
The shopping centre behemoth owns and operates 42 Westfield centres across Australia and New Zealand encompassing more than 12,000 outlets.
Extensive lockdowns have hit brick and mortar retail over the past few months.
Despite this, gross rent collections for the 10-month period to 31 October 2021 are $187 million more than the same period in 2020, SCG says.
Portfolio occupancy remains high at 98.5% at the end of September 2021.
“Our QLD, WA and SA centres continued to trade well during this quarter, consistent with the first half of the year,” SCG CEO Peter Allen said November 9.
“Customers are again rapidly returning to our Westfield Living Centres in NSW, VIC and ACT now that restrictions have eased. We are also looking forward to welcoming back more businesses and customers to our Auckland centres from tomorrow.
“Over 95% of stores in our Australian portfolio are open and trading, with more stores to reopen over the coming weeks.”
The $16.5bn market cap stock is up 2.9% over the past month, and 14.75% year-to-date.
SCG, which had traded in a tight range for ~5 years prior to the March 2020 selloff, is yet to return to pre-pandemic levels of ~$4 per share.
Office
DXS’ diversified Australian property portfolio and investments are heavily skewed towards office space, which it reckons is due a resurgence as ‘return to work’ gains momentum from early CY22.
Despite the disruption caused by the lockdowns in Sydney and Melbourne, leasing activity continued across its portfolio and occupancy remains above 95%, Darren Steinberg, Dexus CEO said in the September quarterly report.
The lockdowns have extended for longer than anticipated back in early August, however enquiry volumes have remained buoyant, predominantly driven by the finance, government, IT and business services sectors, DXS says.
“The path to recovery is clearer, with the return to work expected to gain momentum from early CY22,” the company says.
“In addition, during the quarter a number of customers were secured from lower quality buildings, a continuation of the trend observed in FY21.
“While companies will continue to experiment with different workplace models, the majority see the office as a very important part of their organisational strategy.”
The $12bn market cap stock is up 0.18% over the past month, and 18.28% year-to-date. Its share price still sits well shy of pre-pandemic highs (~$13.90/share).
Residential
The diversified property play plans to bolster its residential portfolio and reduce its exposure to retail and retirement living going forward.
The underlying contribution from its red-hot residential business increased by 20.5% year-on-year in FY21.
In the first quarter of FY22 its residential arm recorded net sales of 1,947; in-line with expectations and 8% above 1Q21. It expects these number to keep growing going forward.
This result reflects consistent sales momentum following completion of HomeBuilder in March 2021, despite significant lockdown restrictions over 1Q22, SGP says.
“We continue to see very strong levels of enquiry for our residential product,” CEO Tarum Gupta says.
In a November update the company said the Australian residential sector was supported by strong fundamentals.
Population growth is expected to return to pre-COVID levels beyond FY23, driven by Net Overseas Migration (NOM) it says, with major cities continuing to attract most of the population growth.
And while increased interest rates are likely to impact demand at the margin, it will take time for full effects to be realised.
The $10.65bn market cap stock is down 6% over the past month, and up 5% year-to-date.
Related Topics
Related Stories


UNLOCK INSIGHTS
Discover the untold stories of emerging ASX stocks.
Daily news and expert analysis, it's free to subscribe.
By proceeding, you confirm you understand that we handle personal information in accordance with our Privacy Policy.


