Property: There’s no more homes left to sell in Perth, Adelaide or Brisbane.

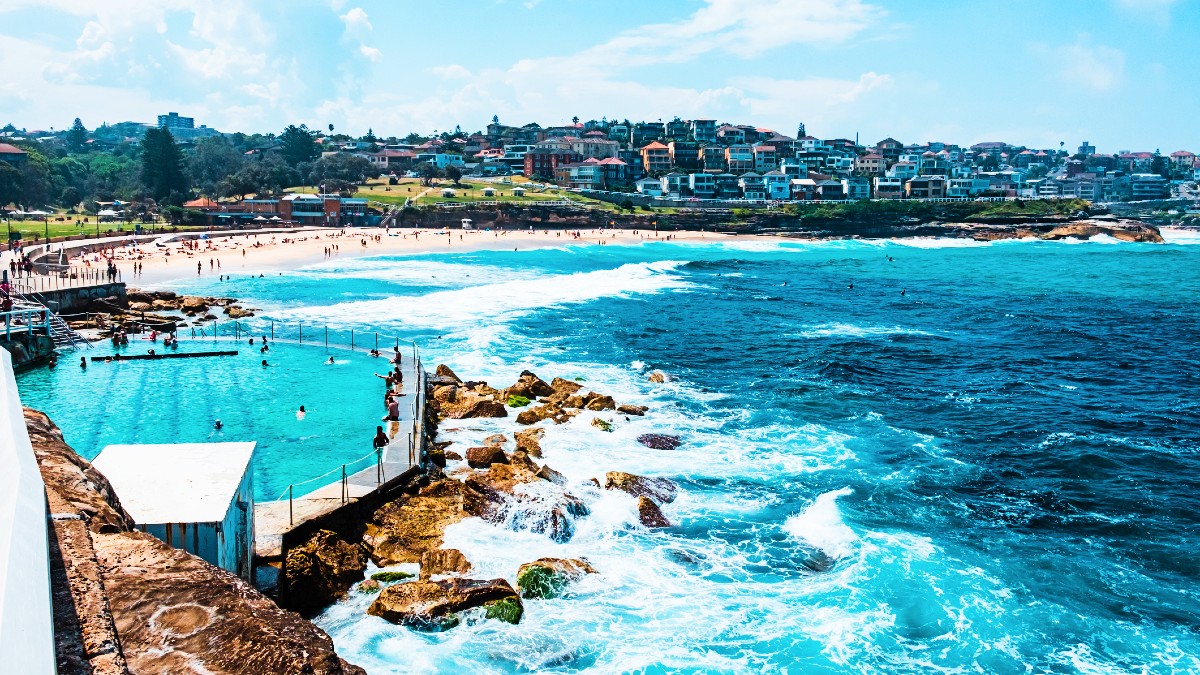
Bondi. Before the joy was stolen. Via Getty
Homeowners are winning again, after winning constantly for many decades and especially over the last year and a half CoreLogic reports its monthly measure of Australian house prices rose 0.8% in May, the 16th consecutive month of growth and the largest monthly gain since October last year.
The Home Value Index for May shows a Sydney market in recovery, Brisbane leapfrogging Canberra as the 2nd-most expensive capital city in the country. while Perth and Adelaide remain way out in front on the pace of rising home values.
Hobart is where the prices are falling fastest. There are no records for Launceston.

The mid-sized capitals continued to lead the pace of growth, with Perth home values up 2.0% in May, Adelaide rising 1.8% and Brisbane up 1.4%.
In dollar terms, it’s the equivalent of the median dwelling value rising by more than $12,000 month-to-month in each city.

The remaining capital cities recorded milder conditions, ranging from a 0.6% lift in Sydney values to a monthly decline of -0.5% in Hobart and a -0.3% fall in Darwin.
Brisbane listings are -34% below the 5-year average

With Brisbane housing values consistently posting solid capital gains while ACT values remain relatively stable, we saw a changing of the guard in May.
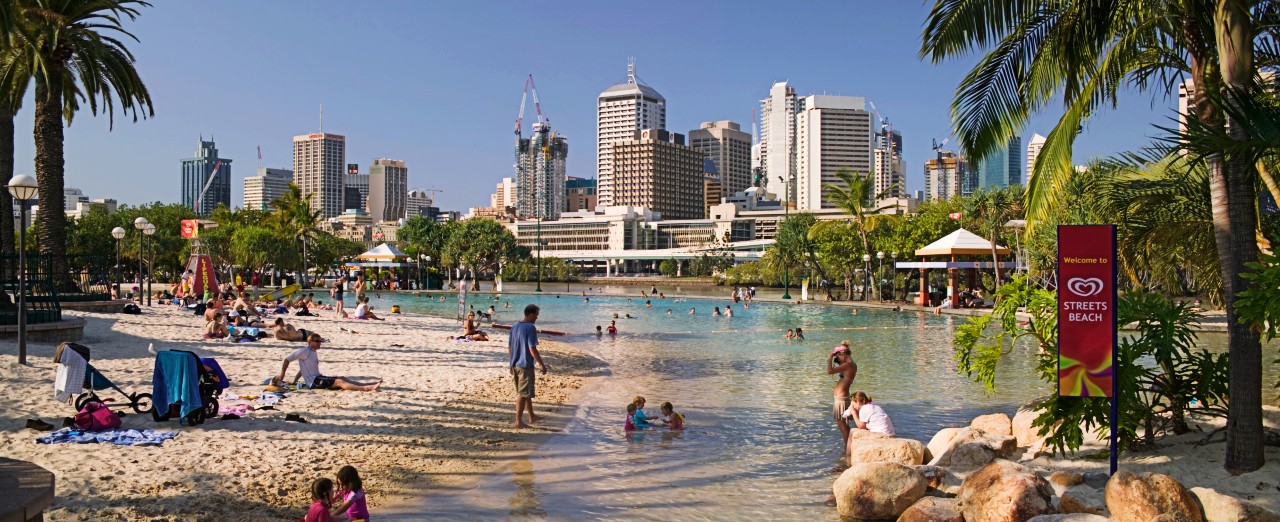
Brisbane overtook Canberra as having the second-highest median dwelling value across the capitals in May, a position Brisbane hasn’t recorded since 1997.
In January CoreLogic research director, Tim Lawless also highlighted Brisbane dwelling values overtaking the Melbourne median.
“This was partly compositional, with the overall median dwelling value in Melbourne being weighed down by a high concentration of relatively cheap units.
“However, Brisbane house values are now also higher than the median house value across Melbourne, for the first time since June 2008,” says Mr Lawless.
The median house value in Brisbane is currently $937,479, $190 above the Melbourne median. The median unit value in
Brisbane, at $615,429, is also now higher than the median unit value in Melbourne, which is $614,299.
Strangled supply
The property market remains caught between the extreme housing shortage and high interest rates, with the former continuing to dominate
The chronic housing shortage got the upper hand over high interest rates last year as immigration levels surged and continues to be the main driver of rising property prices.
“Put simply, the surge in population growth to a record 660,000 over the year to the September quarter last year driven by record immigration levels meant that around an extra 250,000 new homes needed to be built, but instead completions have been running around 170,000 as the home building industry struggles to keep up with rising costs and material & labour shortages and as approvals to build new homes fell,” says AMP’s Shane Oliver chief economist & head of investment strategy.
So, the shortfall of homes expanded by another 80,000 or so dwellings over the last year and is estimated to see the accumulated shortfall rise to around 200,000 dwellings by the end of this month.
See the green line below for that.

This is a conservative estimate, says Shane.
“If the decline in the average number of people per household seen in the last few years is sustained then the accumulated shortfall could be around 300,000 dwellings. Which would take us above where we were before the unit building boom got underway around 2015.”
CoreLogic’s research director says extremely low levels of available supply across the strongest markets provide the best explanation for the difference in growth rates.
“The number of properties available for sale in Perth and Adelaide remain more than -40% below the five-year average for this time of the year while Brisbane listings are -34% below average,” Mr Lawless said.
“Inventory levels in these markets remain well below average despite vendor activity lifting relative to this time last year. Fresh listings are being absorbed rapidly by market demand, keeping stock levels low and upwards pressure on prices.”
Conversely, listings across Hobart are tracking 41% above the five-year average, a consequence of lower demand, with home sales -6.4% below the previous five-year average over the rolling quarter.
Coming into the pandemic Melbourne’s median dwelling value held around a 37% premium over Brisbane’s, and ACT’s median was approximately 24% higher. However, Brisbane values have increased at more than five times the pace of Melbourne values since the onset of COVID, with growth of 59.8% and 11.2% respectively.

Sydney values recover:

The Sydney market also reached a new milestone in May, posting a nominal recovery, equaling the earlier record high set in January 2022. Sydney dwelling values dropped by -12.4% following the January 2022 peak, finding a floor a year later. The market has since posted a 14.1% rise through the cycle to-date.

Upper quartile home values have generally shown the lowest rate of growth over the past year. This trend is apparent across every capital city except Darwin, demonstrating stronger conditions across the more affordable price points of the market.
“After recording a higher rate of gain through the early months of the growth cycle, conditions have faded across the upper quartile as borrowing capacity reduced and affordability constraints deflected demand towards middle-and-lower-priced properties,” Mr Lawless said.
Across the combined capitals index, upper quartile dwelling values are up 6.7% over the past 12 months compared with a 13.4% gain across the lower quartile of the market.

RENT!
The pace of growth across Australian rental markets has eased over the past few months.
With rents rising at a faster pace than home values, gross rental yields have continued to trend higher, rising to 3.56% across the combined capitals, the highest gross yield since August 2019.

CoreLogic’s national rental index rising 0.7% in May, the lowest monthly change since December last year.
Most markets have seen a reduction in rental growth relative to the first quarter of the year, when rental demand tends to be seasonally higher.
However, the annual pace of rental growth has also eased across most cities, especially across the unit sector where rental growth has been more severe.
Nationally, rents are up 8.5% over the past 12 months, down from 8.9% a year ago and a 9.3% rise two years ago.

Supply vs demand:
Available housing supply, based on the number of homes advertised for sale over the past four weeks, remains well below average. Capital city listings are -16% below the previous five-year average and nearly -2% lower than a year ago. Demonstrated demand, based on the quarterly number of home sales, has tracked 7.2% above the previous five-year average and are 2.8% higher than a year ago.
Housing affordability:
Measures of housing affordability are clearly worsening across most markets, with the national dwelling value to income ratio rising to 7.7 in March, and the time it takes to save for a 20% deposit rising to 10.3 years, assuming households can save 15% of their gross income.
‘higher for longer’
Eventually housing demand and supply will converge, driven by slowing population growth and, eventually, a ramp up in residential construction activity. In the meantime, we can probably expect further upwards pressure on housing values alongside a further erosion in
housing affordability, even as interest rates stay ‘higher for longer’.
In their latest Statement on Monetary Policy, the RBA noted they expect affordability constraints and high construction costs to continue weighing on dwelling investment in 2025 and 2026, but dwelling investment growth should pick up around the middle of next year.
Related Topics
UNLOCK INSIGHTS
Discover the untold stories of emerging ASX stocks.
Daily news and expert analysis, it's free to subscribe.
By proceeding, you confirm you understand that we handle personal information in accordance with our Privacy Policy.


