Tesla, Alphabet and Amazon: Getting Mega-Tech before the ceiling comes down

Don't get this one in the back. Via Getty
A US government debt default seems like crazy talk, but we should remember this is America, where the very crazy is often more likely than merely possible.
It’s a country where – according to the Gun Violence Archive – as of today, there’s been 225 mass shootings across the country so far this year – that’s a total of 135 days.
The last US President – who has himself led businesses into bankruptcy no less than six times – actually advocated for the government to default, a moment previously toyed with, but never actually considered… mainly because it would ruin the country’s AA credit rating, cripple the USD, plunge the country headlong into recession and create unknown chaos in already chaotic global financial markets.
Talks, desperate and full of political hubris are beginning in Washington and if the Clint Eastwood style Mexican standoff isn’t worrying you, then it’s probably time to take a moment and consider your options.
There’s enough nonsense in the air in both Washington and New York for this one to go either way.
The advantage for an investor is not in picking the outcome, but recognising the binary nature of the issue. This will play out one of two ways, and looking at the entire mess through the lens of three mega tech stocks isn’t a bad vantage point, according to Matt Simpson over at City Index.
Matt says although Wall Street has mostly taken US debt-ceiling concerns within their stride, the issue could severely hamper the economy (and therefore sentiment) should the Americans and their ill-advised process of governing end up forcing the actual government to default on its debt.
“So we may find that sentiment sours as the week progresses, if heated talks between Democrats and Republicans remain in a deadlock,” Matt says.
On the flipside, happy-happy joy-joy could break out if the opposite happens.
Matt reckons it’d present an “excellent buying opportunity” if or when the debt ceiling is “inevitably raised” once more.
“And that leaves opportunities for both bulls and bears, depending on how this plays out,” he told Stockhead.
For fans of technical analysis, we bring you Matt’s feelings on the long or short side of a few companies which you may’ve come across in your idle time on the internet. Messrs Tesla (TSLA), Alphabet (GOOGL) and Amazon (AMZN).
Tesla (TSLA) daily chart:

Matt says the price action on Tesla has been relatively choppy, “with ill-defined trends” on the daily chart (above).
“However, several technical factors have come together to provide a potential swing-trade short for bears over the near-term.
“The recent rally effectively closed the gap at 177.65, and marked Friday’s high. A bearish engulfing / outside day formed on high volume to suggest a key reversal, and a bearish divergence formed on the RSI (2).”
Furthermore, Matt sees the key reversal forming around the monthly pivot point, 50-day EMA and just below the 100-day EMA.
Matt’s x 3 technical takeaways:
- The bias on the daily chart remains bearish whilst prices stay beneath Friday’s high
- Bears could seek to enter a break of last week’s low, or fade into minor rallies within Friday’s range
- Round numbers such as 160 and 150 make viable downside targets, but if risk-off prices markets it could potentially close the hap at 145.50 around the monthly S1 pivot
Alphabet (GOOG) daily chart:
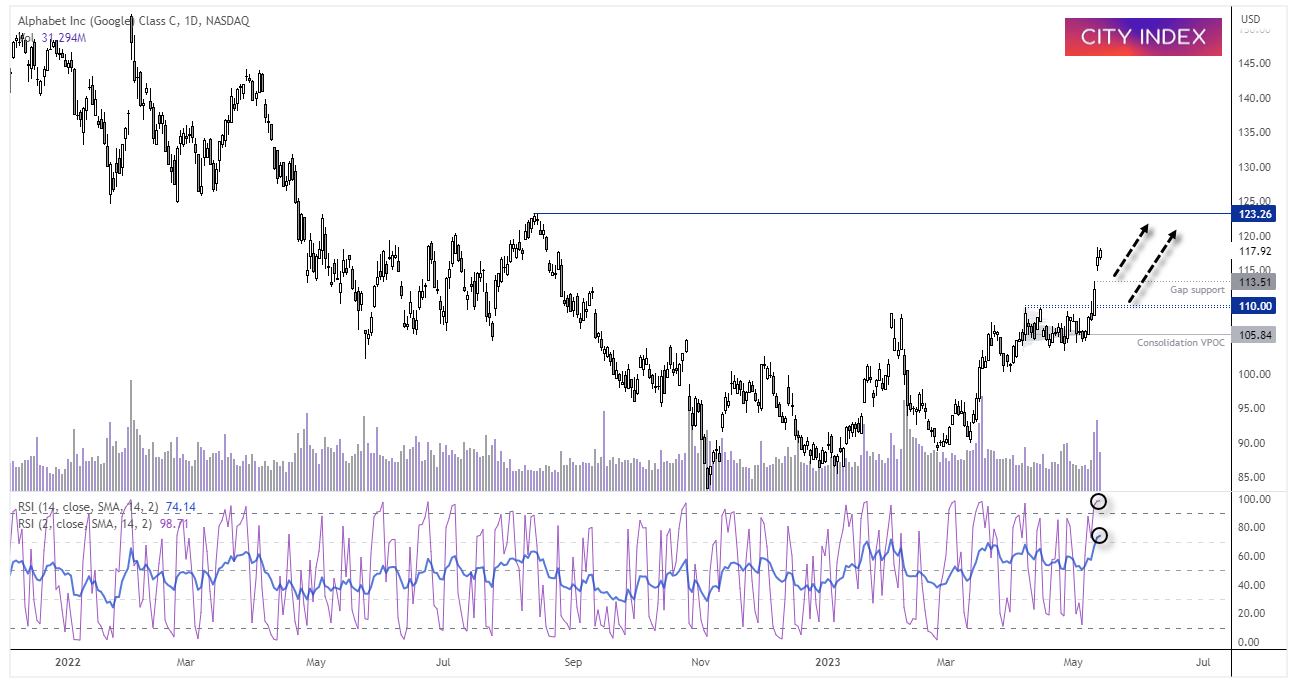
Alphabet posted a strong 11% rally last week, its second time this year to hit double digits.
“Wall Street clearly liked their announcement last week (that AI will be incorporated into Google) and helped the stock break convincingly out of a consolidation in the process.
“Most of the trading activity within the consolidation took place at 105.84 to suggest this is where institutions were buying ahead of the breakout, and it is a level which could be defended upon any retracement. The rally was also accompanied with strong trading volumes to show initiative buying as prices rose,” Matt says.
“However, RSI (2) and (14) have reached overbought levels, so we would prefer to wait for prices to consolidate or retrace against last week’s rally before seeking long opportunities.
Matt’s x 3 technical takeaways:
- Bulls could seek long opportunities around gap support (113.51) or the highs around 110
- Alternatively, bulls could wait for prices to consolidate further around these highs and seek a bullish breakout on a lower timeframe
- Initial upside targets for bulls to consider include 120 and the 123.23 high
Amazon (AMZN) monthly chart:
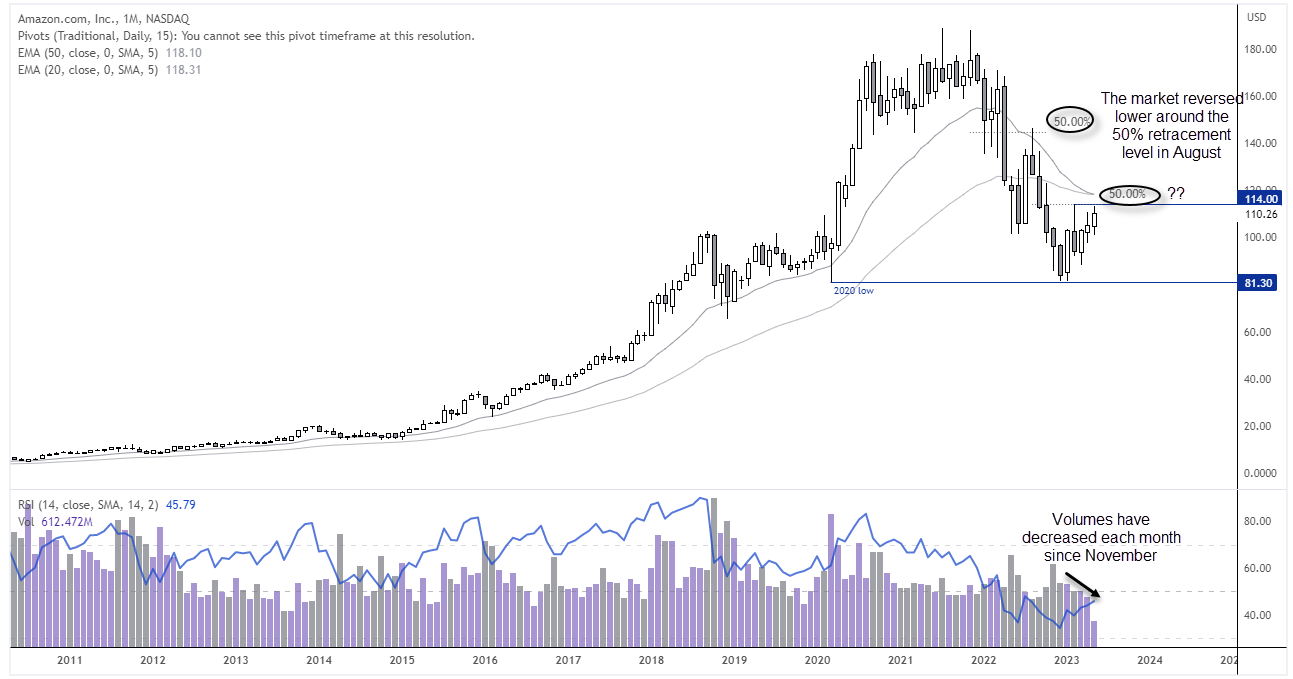
AMZN stock crashed and burned -56% from its all-time high to the 2022 low, according to City Index that was its worst drawdown since the Nasdaq bubble burst.
Yet Matt notes the stock found support just above the 2020 low and formed a bullish outside month to show demand above US$80.
“We do not yet know whether this is part of a multi-year correction against its multi-year bull trend, but we can see that prices have reached a likely pivot area around, near the February high and 50% retracement level.
“Notice that the market revered lower around a 50% retracement level back in August 2022, so will history repeat this time around?
“We’ve also noted that monthly trading volumes have diminished each month since the December low to suggest the current rally is losing steam, heading into these highs.”
The daily chart (below) shows prices are hesitant to immediately break above the February high, having pulled back on Friday.
Amazon (AMZN) daily chart:
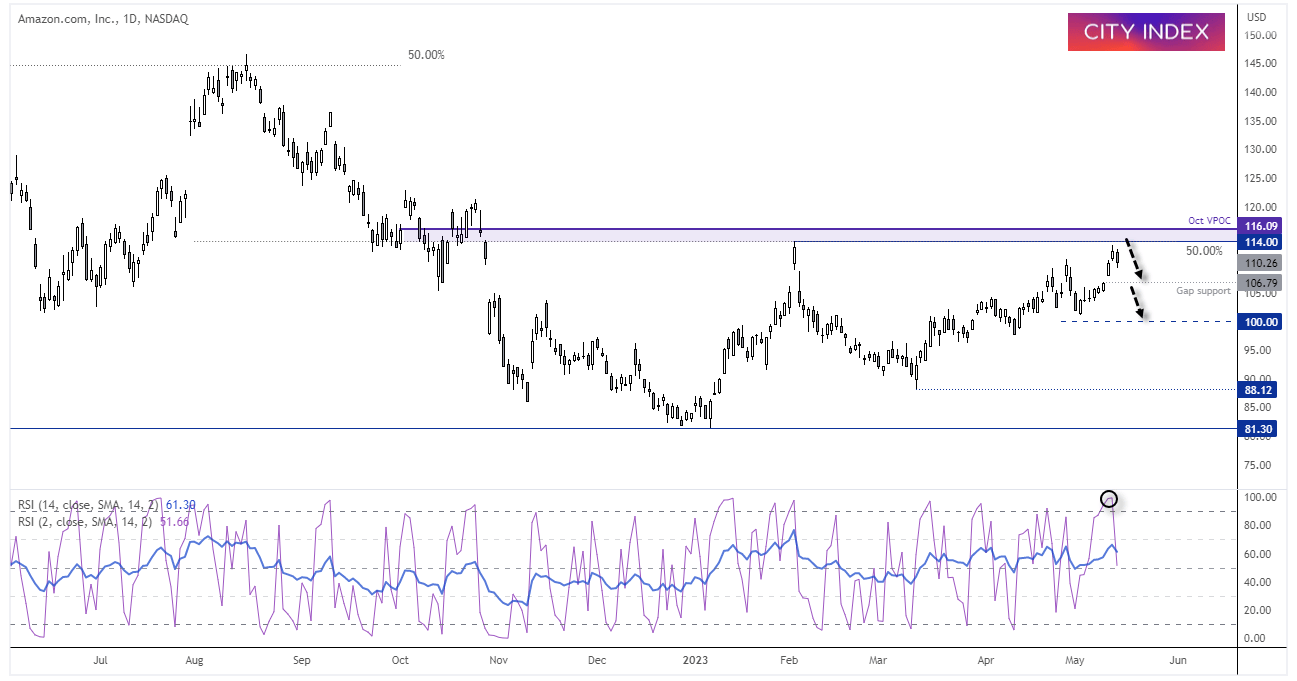
“But we also note that October’s VPOC (volume point of control) is also overhead at $116, and that is a level which may be defended by bears.
“Over the near-term, we’re looking for prices to close the gap at 106.79, so would consider fading into rallies below $116, a break beneath which brings the lows around $100 into focus. And if that level breaks, we’ll assume it is part of a much larger risk-off move which brings $90 into view.”
Related Topics
Related Stories


UNLOCK INSIGHTS
Discover the untold stories of emerging ASX stocks.
Daily news and expert analysis, it's free to subscribe.
By proceeding, you confirm you understand that we handle personal information in accordance with our Privacy Policy.


