Hot Money Monday: The Simple Moving Average chart, and how it’s used to profit from a stock’s upward trend

One popular technical chart used by momentum traders is the Simple Moving Average (SMA) chart. Picture Getty
Momentum investing involves taking advantage of, and making profits from, upward trends in a stock. The strategy makes a calculated bet that the stock market’s recent winners will remain winners.
Technical charts are some of the most valuable tools for momentum trading as they help traders to identify those trends.
One popular technical chart used is the Simple Moving Average (SMA) chart.
The SMA can indicate a potential buying opportunity for a stock – ie; when the stock price crosses above the SMA, it may suggest a bullish trend or the beginning of an uptrend.
Example of a Moving Average Chart
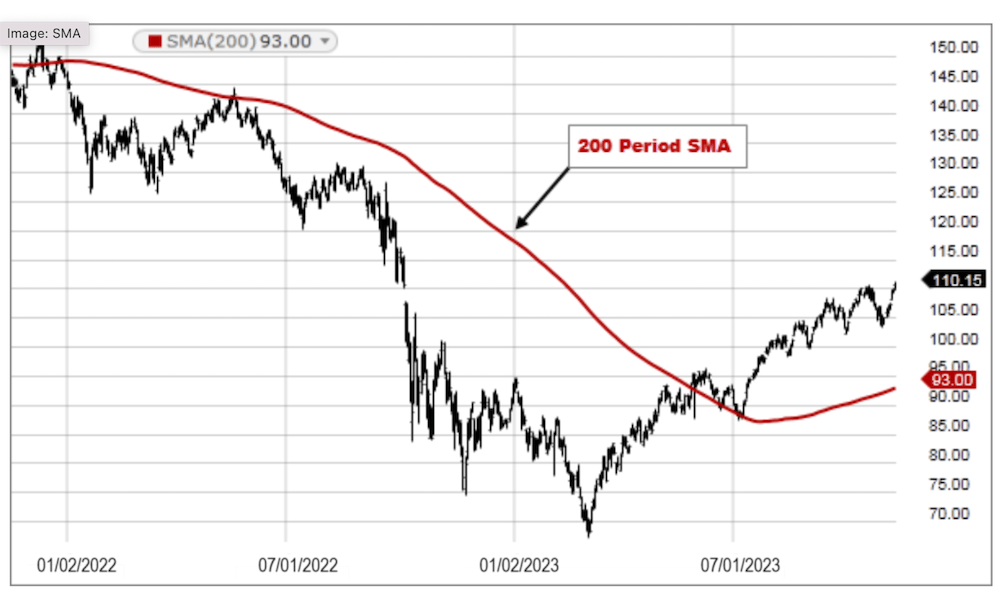
The SMA is calculated by taking the average closing price of a stock over a specified period, and comparing that with the current stock price.
For instance, if you want to know the SMA for a stock over the last five days, you would add up the closing prices of the stock for the past five days and then divide by five to get the average.
Then compare that average price with the stock’s current price.
As a general rule, if the current stock price is above the SMA, it tells you that the price trend is up, and that you should perhaps buy the stock; and vice versa if the price is below the SMA.
Other ways to use the SMA
Traders often use moving average crossovers to identify trend reversals.
When a short-term SMA (e.g., 20-day SMA) crosses above a longer-term moving average (e.g., 200-day SMA), it’s known as a “golden cross” and may signal the start of a bullish trend.
Moving averages can also help traders identify breakouts from periods of low volatility.
For instance, if a stock price breaks decisively above its SMA after a period of sideways trading, traders may interpret this as a bullish signal to buy the stock in anticipation of further upside.
“The simple moving average acts as a guide, offering traders a road map through the ups and downs of market volatility,” said technical chart expert, Mark Johnson.
“It’s a trusted tool for navigating trends and identifying potential buying or selling opportunities.”
10 ASX small caps at prices above SMA
(data from Commsec)
| Code | Name | Last Price Value | Price vs. Simple Moving Average | Price vs. 20 day SMA | Price vs. 50 day SMA | Price vs. 200 day SMA |
|---|---|---|---|---|---|---|
| AEI | Aeris Environmental | $0.07 | >5% Above SMA | 1 to 5% Above SMA | >5% Above SMA | >5% Above SMA |
| AJL | AJ Lucas Group | $0.01 | >5% Above SMA | >5% Above SMA | >5% Above SMA | 1 to 5% Above SMA |
| AMC | Amcor Plc | $15.05 | >5% Above SMA | 1 to 5% Above SMA | 1 to 5% Above SMA | 1 to 5% Above SMA |
| PER | Percheron Therapeutics | $0.08 | >5% Above SMA | 0 to -1% Below SMA | -1 to -5% Below SMA | >5% Above SMA |
| ANX | Anax Metals | $0.03 | >5% Above SMA | 1 to 5% Above SMA | >5% Above SMA | < -5% Below SMA |
| CYM | Cyprium Metals | $0.04 | >5% Above SMA | >5% Above SMA | >5% Above SMA | -1 to -5% Below SMA |
| MYG | Mayfield Group Holdings | $0.87 | >5% Above SMA | >5% Above SMA | >5% Above SMA | >5% Above SMA |
| AXI | Axiom Properties | $0.06 | >5% Above SMA | >5% Above SMA | >5% Above SMA | -- |
| BNL | Blue Star Helium | $0.01 | >5% Above SMA | 1 to 5% Above SMA | -1 to -5% Below SMA | < -5% Below SMA |
| WNR | Wingara Ag | $0.02 | >5% Above SMA | 1 to 5% Above SMA | < -5% Below SMA | -- |
Studies have commenced on a 20,000 tonne per annum copper equivalent production hub at Whim Creek.
Anax says it wants to establish a Pilbara Base Metal Alliance for several regional base metal projects to potentially participate in near term production planned for Whim Creek.
Whim Creek will become a centralised processing hub capable of treating a range of base metal ores within the Pilbara region, producing battery metal and agricultural products.
Barry FitzGerald did a deep dive into Anax Metals just this weekend past.
BNL says the maiden helium development well at Blue Star’s Galactica/Pegasus project is on track for drilling in Q2 2024
The Project’s potential has already been proved by four successful exploration wells, with neighbouring third-party helium producer further de-risking the development.
The wells returned strong helium concentrations of 2-6.1% and flowed gas at rates of between 125,000 and 412,000 cubic feet per day.
Other momentum signals
Apart from the SMA, there are a couple of other indicators used by the market to signal momentum of any given stock, including:
- 52-week High
- Relative Strength Index
The 52-week highs
Traders often view the 52-week highs as entry signals.
This is due what’s called the “52-week high effect” – where if a price has broken out above its 52-week range, there must be some factor that generated enough momentum to further continue the price movement in the same direction.
On the other hand, if a stock is far away from its 52-week high, chartists believe the momentum will continue going that way.
10 ASX small caps at 52-week high
(data from Commsec)
| Code | Name | Price | How far from 52-Week High? | 1 mth return | 6 mth return | 12 mth return |
|---|---|---|---|---|---|---|
| AEI | Aeris Environmental | $0.07 | 0.00% | 18.33% | 184.00% | 108.82% |
| MYG | Mayfield Group | $0.87 | 0.00% | 30.83% | 81.25% | 180.65% |
| AXI | Axiom Properties | $0.06 | 0.00% | 37.21% | 47.50% | 31.11% |
| BOT | Botanix Pharma | $0.25 | 0.00% | 4.26% | 81.48% | 184.88% |
| M4M | Macro Metals | $0.02 | 0.00% | 185.71% | 566.67% | 400.00% |
| SW1 | Swift Networks | $0.02 | 0.00% | 50.00% | 60.00% | 84.62% |
| TRM | Truscott Mining | $0.07 | 0.00% | 34.62% | 16.67% | 75.00% |
| CYP | Cynata Therapeutics | $0.24 | 0.00% | 27.03% | 95.83% | 46.88% |
| BSE | Base Resources | $0.25 | 0.00% | 127.27% | 117.39% | 35.14% |
| PSQ | Pacific Smiles | $1.90 | 0.00% | 17.65% | 57.02% | 41.79% |
Macro announced that as part of the strategic review of the company’s assets it was determined that the Aurora Lithium transaction, as announced on November 2023, is no longer aligned with the re-focused investment and development strategy of the company.
As such, Macro has elected not to exercise the option to acquire an 85% interest in the lithium rights of the Aurora Lithium Project from Aurora Energy Metals Ltd (ASX: 1AE).
Macro says its Cane Bore, Catho Well and Goldsworthy Projects already have the potential to deliver significant shareholder value.
Cynata announced the completion of patient enrolment in its Phase 1 clinical trial of CYP-006TK in diabetic foot ulcers (DFU).
CYP-006TK is Cynata’s topical wound dressing product candidate, which comprises MSCs (mesenchymal stem cells) seeded onto a novel silicon dressing.
Cynata says DFU poses a significant risk of infection, and if therapy is unsuccessful, amputation may be necessary. In this trial, CYP-006TK is being investigated as a potential treatment to promote wound healing in patients with DFU.
The Relative Strength Index
Here’s another momentum signal used by the market – the Relative Strength Index (RSI).
RSI is a measure of the strength of a stock’s momentum, either in the upward or the downward direction, and is used to indicate whether a stock is oversold or undersold.
Generally speaking, an RSI above 70 means a stock is strongly bought; and an RSI below 30 indicates that it’s strongly sold.
An RSI above 80 meanwhile is extremely bought, and an RSI below 20 is extremely oversold.
10 ASX small caps with RSI over 70:
(data from Commsec)
| Code | Name | 2 Day RSI | 9 Day RSI | 14 Day RSI |
|---|---|---|---|---|
| AMC | Amcor Plc | -- | Overbought | Overbought |
| BKY | Berkeley Energia | -- | Overbought | -- |
| BOT | Botanix Pharmaceuticals | -- | Overbought | -- |
| BPH | BPH Energy | Overbought | Overbought | -- |
| M4M | Macro Metals | Overbought | Overbought | Overbought |
| SW1 | Swift Networks Group | -- | Overbought | Overbought |
| DYL | Deep Yellow | -- | Overbought | -- |
| RHK | Red Hawk Mining | -- | Overbought | Overbought |
| OMH | OM Holdings | Overbought | Overbought | -- |
| ODA | Orcoda | -- | Overbought | -- |
Swift reported a solid quarter ending 31 March.
Cash position was above $2.0m, with cash from operations, excluding interest, remaining positive for the quarter.
Swift announced $2.0m subscription extension and network infrastructure upgrades to Pilbara Minerals, Shell, AngloGold Ashanti, Iluka Resources, Northern Rise and Genesis Minerals.
Related Topics
Related Stories


UNLOCK INSIGHTS
Discover the untold stories of emerging ASX stocks.
Daily news and expert analysis, it's free to subscribe.
By proceeding, you confirm you understand that we handle personal information in accordance with our Privacy Policy.


