Hot Money Monday: Gold smashed $2,700 last week; what do the charts predict next?

What's ahead in the charts after gold soars? Pic via Getty Images
- Gold prices surge past us$2,700 on market tensions
- Lower interest rates boost gold’s investment appeal
- Technical indicators show mixed signals for gold
Gold prices smashed through the US$2,700 per ounce barrier last week, driven by escalating tensions in the Middle East and the uncertain outcome of the US election.
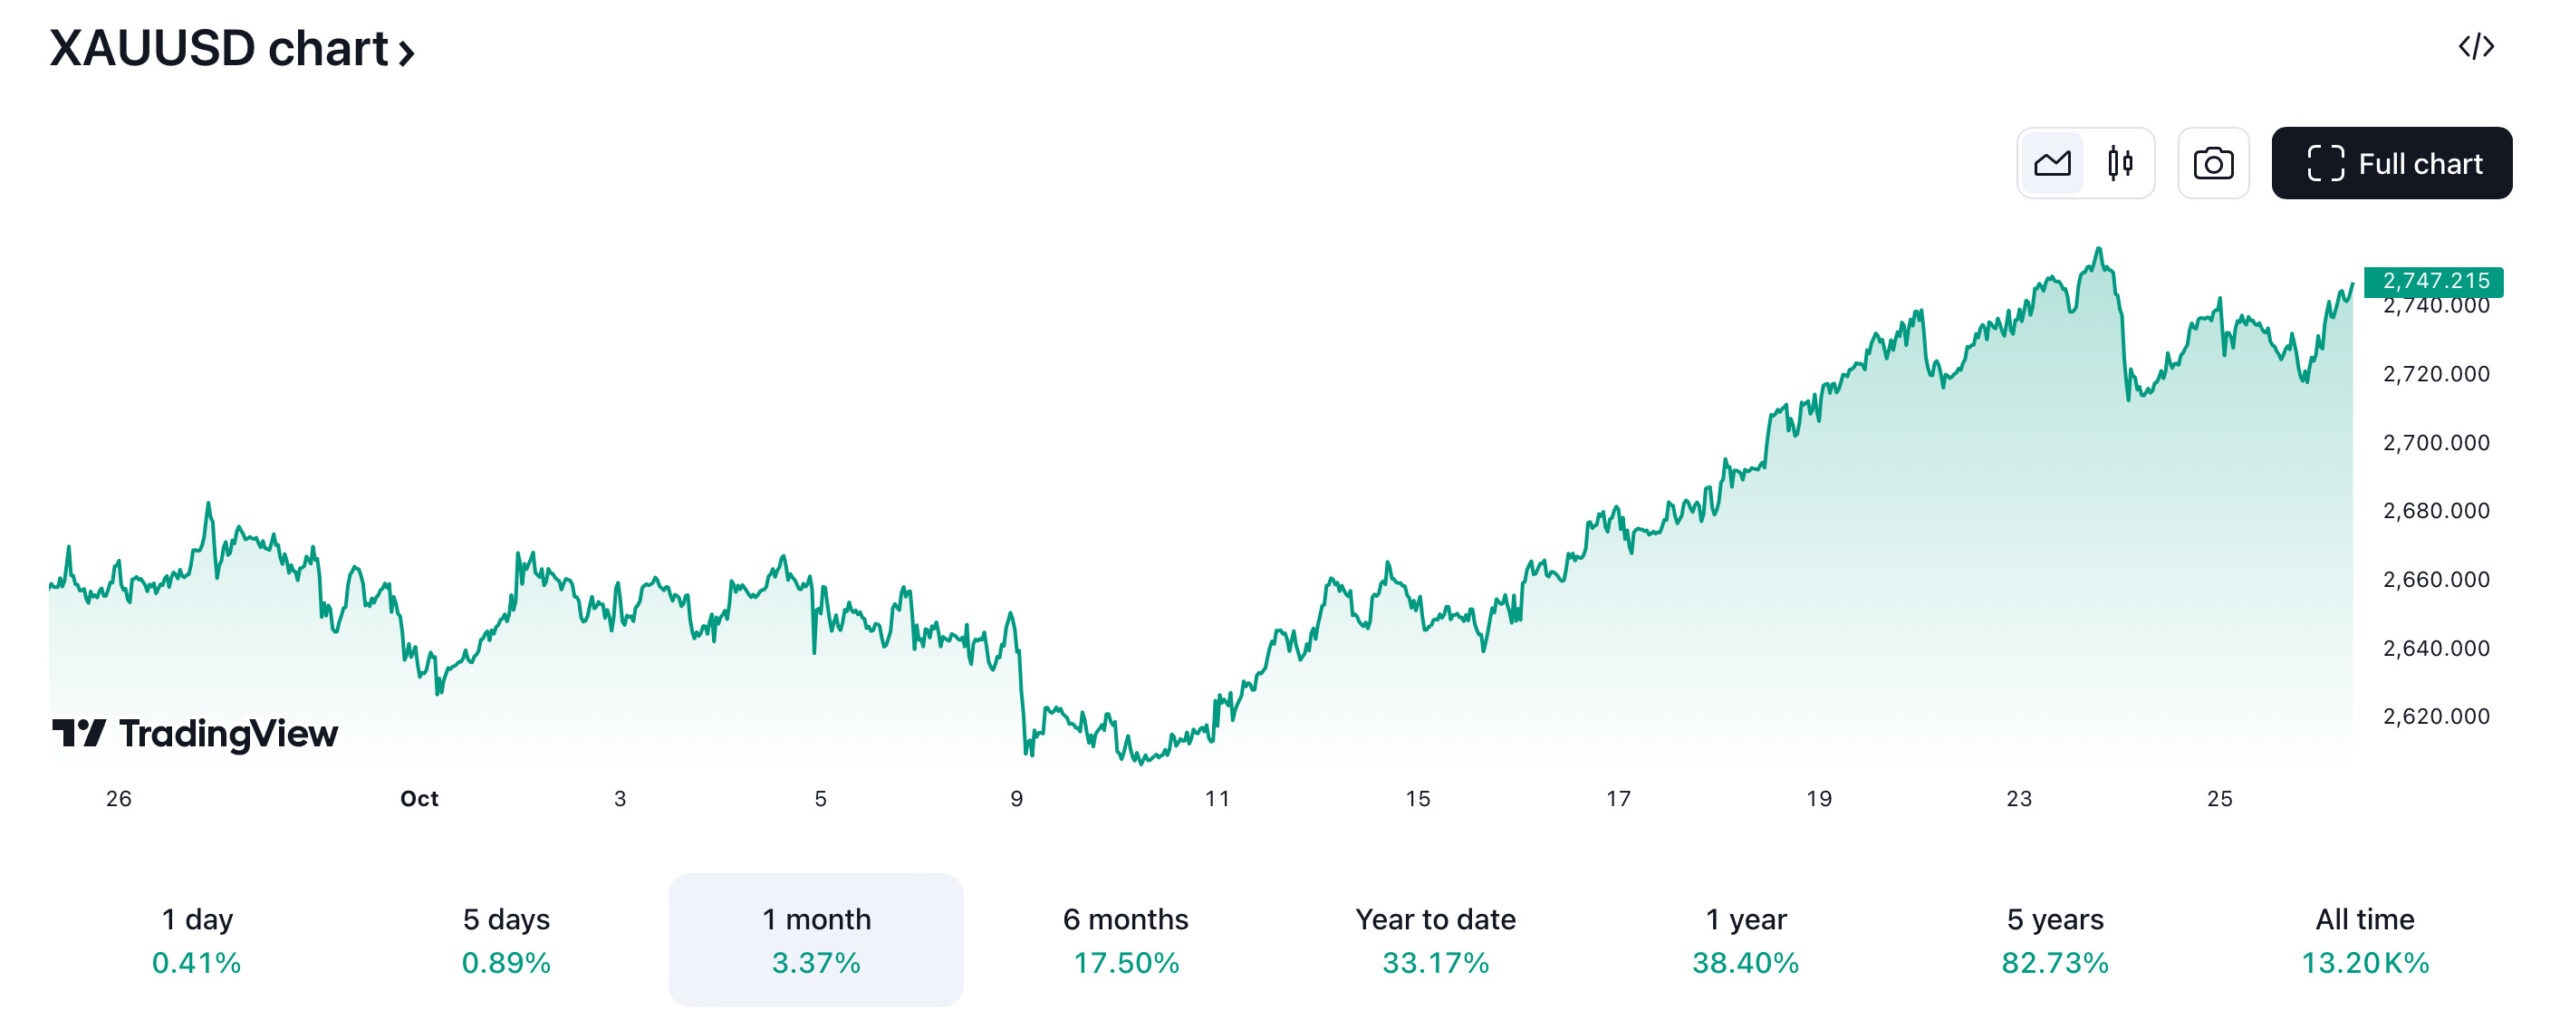
Supporting this bullish trend, a recent poll from the London Bullion Market Association suggests prices could reach US$2,940 per ounce within the next year.
Combined with expectations of lower global interest rates, this further enhances gold’s attractiveness as an investment.
Gold becomes more appealing when interest rates fall for a couple of major reasons.
First, lower rates reduce the opportunity cost of holding gold, which doesn’t earn interest or dividends.
And second, lower rates can weaken the US dollar, the currency gold is priced in, making gold cheaper for investors using other currencies and boosting its demand.
What the charts say
Let’s take a closer look at the current technical signals and charts for Gold (XAU/USD)…
Relative Strength Index (RSI)
From a technical analysis standpoint, the concern for bulls lies in the fact that the RSI is now in overbought territory.
The RSI is a popular momentum oscillator that’s used extensively by traders.
It measures the speed and change of price movements, and is primarily used to identify overbought or oversold conditions in the market, helping to determine potential reversal points or trend strength.
Momentum traders use RSI to help them identify potential entry and exit points.
Generally speaking, an RSI number above 70 means an asset is overbought; and an RSI below 30 indicates that it is oversold.
An RSI above 80 meanwhile indicates it is extremely overbought, and an RSI below 20 is an extremely oversold asset.
The latest charts indicate that the RSI for XAU/USD sits at 74.97, indicating that it’s been overbought and that investors should sell gold.
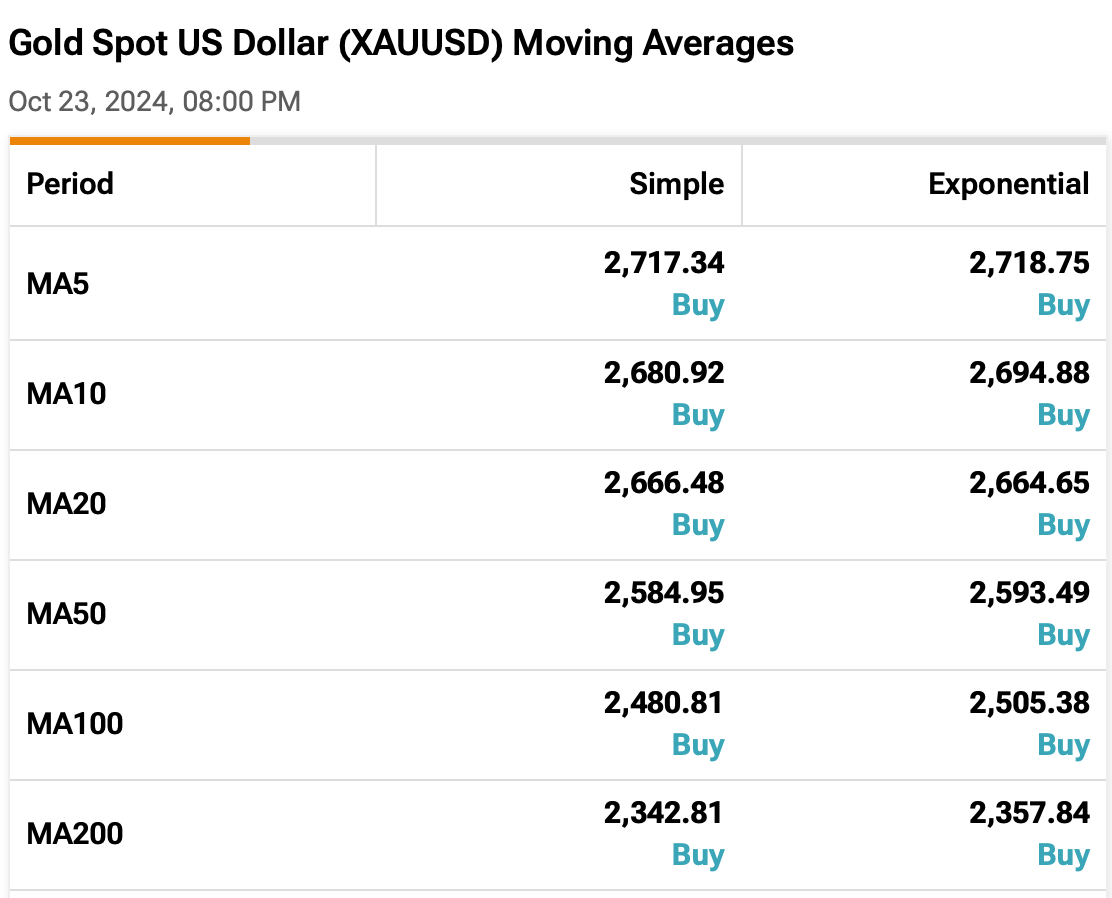
Moving Average (MA)
The Moving Average chart, meanwhile, indicates that gold should be bought.
The MA is calculated by taking the average closing price of the asset over a specified period, and comparing that with the current price.
For instance, if you want to know the MA for gold over the last 10 days, you would add up the closing prices of the stock for the past 10 days and then divide by 10 to get the average.
Then compare that average price with the stock’s current price.
As a general rule, if the current price is above the MA, it tells you that the price trend is up, and that you should perhaps buy the stock; and vice versa if the price is below the MA.
In the current charts, gold spot’s 10-Day moving average is $2694.88, while the current price is $2,719.92, making it a Buy.
The 100-Day moving average is 2505.38, also making it a Buy.
Can two signals give two different recommendations?
The RSI and MA, or any two technical signals, can indeed send conflicting signals about an asset.
When this happens, investors often look for confirmation from multiple other indicators before making trading decisions.
Traders can use a combination of indicators to gain a more comprehensive view.
Some common ones include:
Bollinger Bands: This tool consists of a middle band (a moving average) and two outer bands that are standard deviations away from the middle. When the price touches the upper band, it may be overbought; when it touches the lower band, it may be oversold.
Read more here: Using Bollinger Bands to identify buying opportunities on the ASX
Volume: Analysing trading volume can provide insights into the strength of a price movement. High volume during a price increase can confirm a bullish trend, while high volume during a price decrease can confirm bearish momentum.
Fibonacci Retracement: This tool uses horizontal lines to indicate support and resistance levels at key Fibonacci levels. Traders often use these levels to identify potential reversal points in a asset’s price.
Related Topics

Related Stories


UNLOCK INSIGHTS
Discover the untold stories of emerging ASX stocks.
Daily news and expert analysis, it's free to subscribe.
By proceeding, you confirm you understand that we handle personal information in accordance with our Privacy Policy.


