Bitcoin down 77pc in the past month; alt-coins follow

Pic: DKosig / iStock / Getty Images Plus via Getty Images
Bitcoin’s (BTC) price has dropped 77 per cent over the past 30-days as the market responds to sharp falls in the global financial markets.
Alt-coins (digital assets launched after BTC) XRP and Ethereum (ETH) have followed suit, with 103 per cent and 113 per cent drops respectively.
For example, the price drop on March 12 was tied to global financial markets reacting to the US 30-day travel ban to and from the European Union.
Prior to the drop, BTC, ETH and XRP had been trading at their highest value in seven months.
Volume
BTC Markets data shows that the volume of all three major coins has been at their peak since late Autumn 2019.
Last week saw trading volumes of 4,000 BTC and 37,600 ETH. XRP has experienced a significant increase since the start of 2020.
Last week 114.25 million XRP were traded on BTC Markets — their third highest weekly volume on the exchange.
Digital asset markets have shown resilience after the US Federal Reserve announced interest rates of 0 per cent. This announcement triggered the S&P ASX Small Ordinaries (XSO) to sink further downwards. Since mid-February, the XSO has moved down 982.6 points.
Seven-day and 30-day changes
Below is a table showing the seven-day and 30-day price changes. It highlights the extents of the recent bear market.
| 7-day change 4th Mar - 15th Mar | 30-day change 14th Feb - 15th Mar | |
|---|---|---|
| BTC | -0.3908 | -0.7689 |
| XRP | -0.2412 | -1.0295 |
| ETH | -0.5029 | -1.1271 |
| XSO | -0.1528 | -0.2531 |
Conventionally, digital asset prices move independently of stocks, bonds or commodities. During the past few weeks, we have seen — for the first time — a stronger correlation between the trends of digital assets and traditional financial markets.
The below chart shows the percentage gain of BTC (lavender), XRP (blue) and ETH (green) compared to the XSO (red) since December 2019. The chart indicates correlation, as the XSO index value moved down along with digital assets.
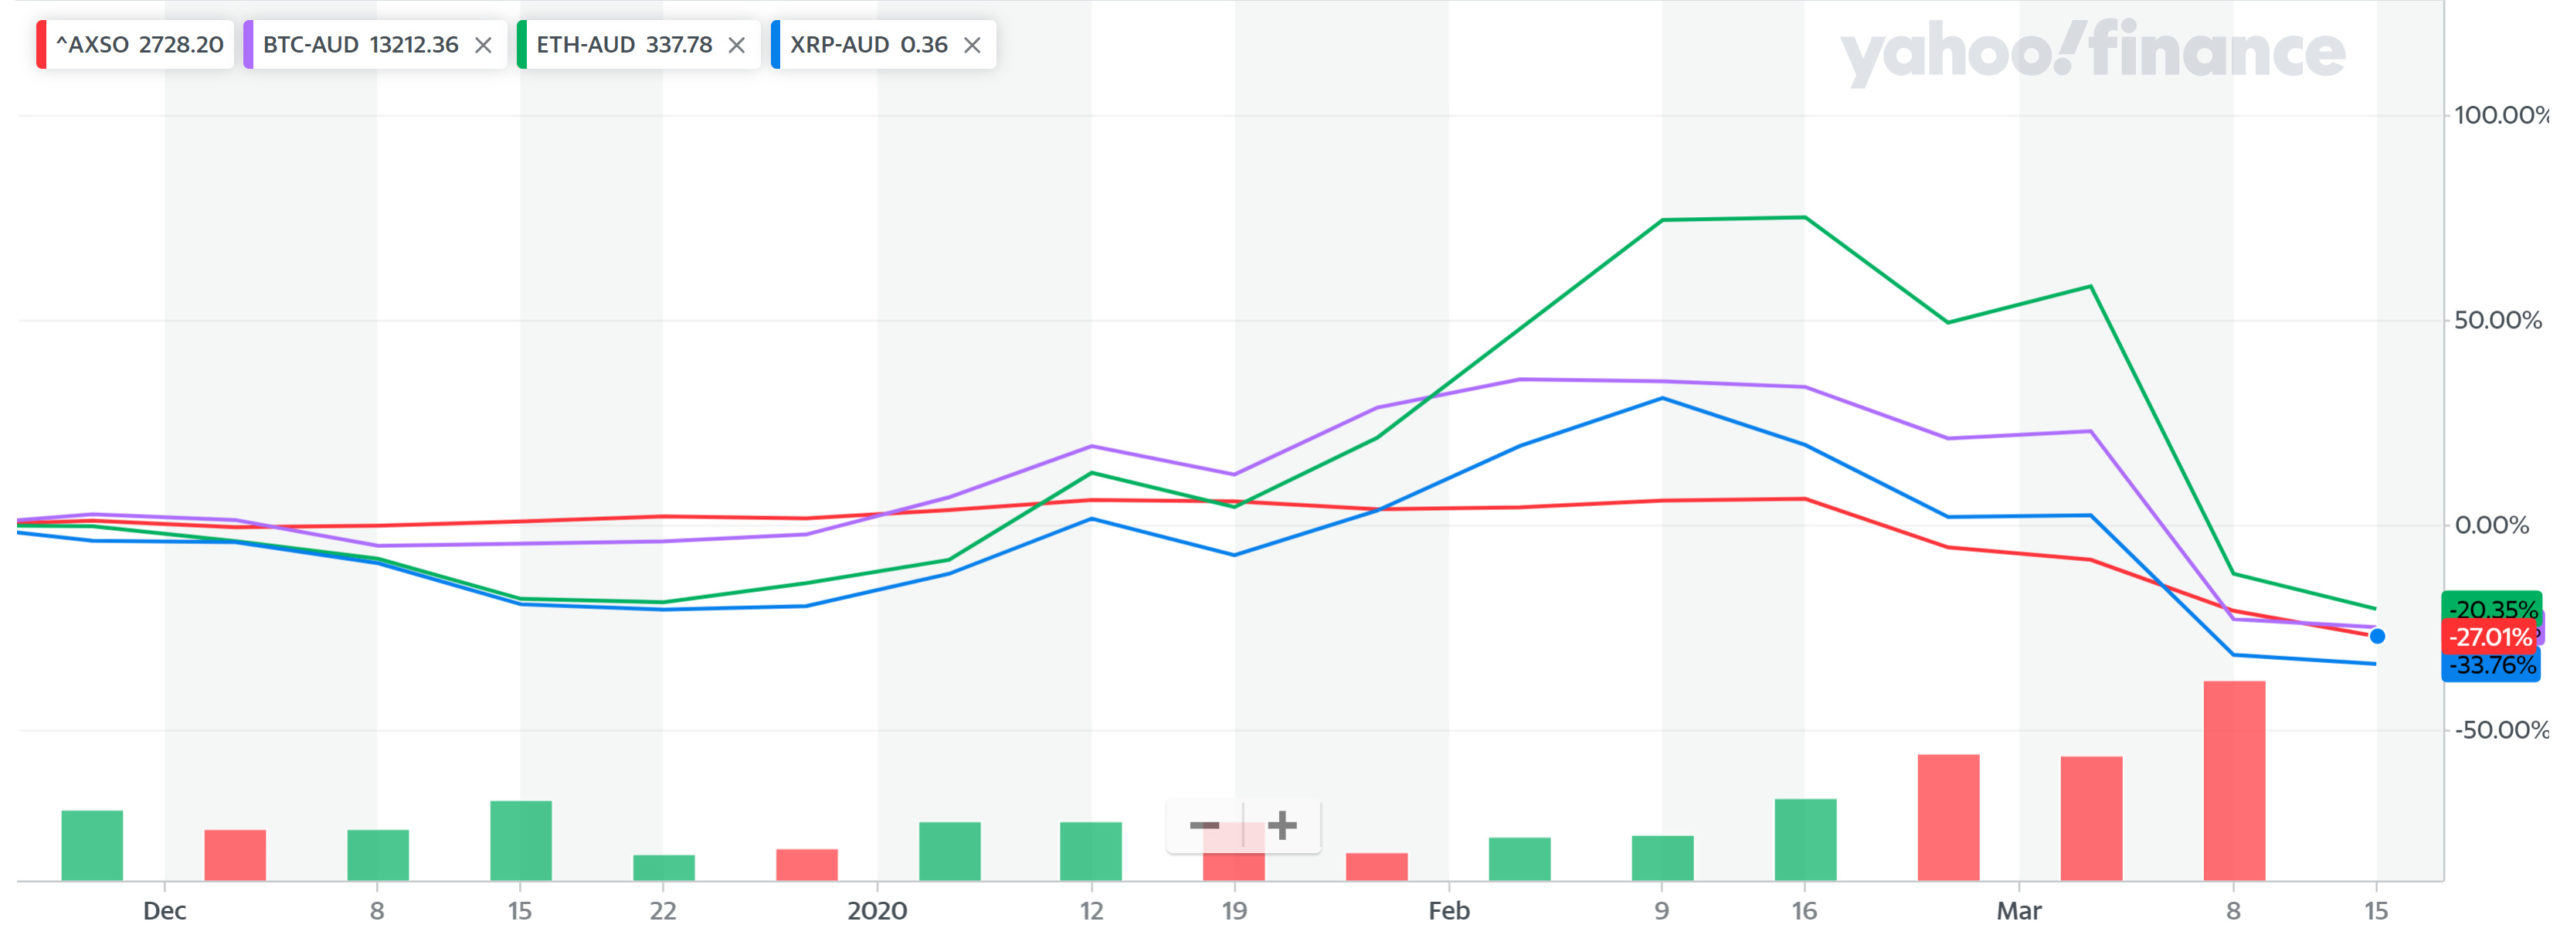
Since February 24, the XSO index has dropped over 31 per cent. During the last week of February, the index moved from 3068.7 to 2728.2 points, one of the largest weekly drops since the 2008 financial crisis.
Digital assets have correlated price movements, especially in bear markets. When BTC falls in price, most major coins will move down with it. However, during bull markets the correlated price movement decreases.
BTC, ETH and XRP are the three largest digital assets by market capitalisation.
BTC is the better-known form of digital currency which runs over a decentralised network.
Ethereum with its native token ETH is a similar distributed computing ledger. It differs to BTC by being a platform for anyone to build applications that run over Ethereum network.
Ripple uses blockchain technology to operate a cross-border payment system. Their XRP token is used as a liquidity source by exchanges around the world to send funds in a matter of seconds.
Collectively, BTC, ETH and XRP account for approximately 78 per cent of the total digital asset market cap. BTC alone accounts for 60 per cent. For this reason, the industry regularly references these coins.
Volatility
The chart below shows BTC’s implied volatility.
Implied volatility represents the markets expectations for prices to move, over a given period. On March 9, one-month volatility (blue) shot up from 55 per cent to 65 per cent, revealing that traders expect the price of BTC to have large swings in the coming weeks.
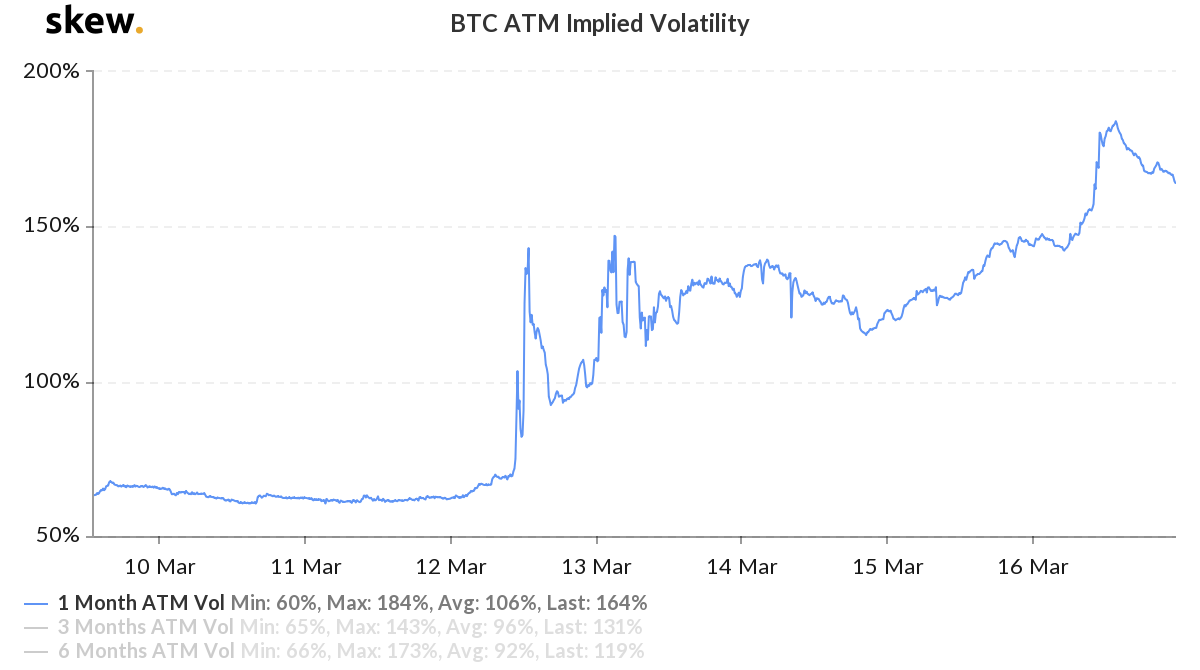
On March 12, the one-month volatility showed a sharp spike up to 182 per cent. It since moved back down but has trended upwards and currently sits at 144 per cent. This shows that we can expect some further large swings in price in the coming month.
Related Stories


UNLOCK INSIGHTS
Discover the untold stories of emerging ASX stocks.
Daily news and expert analysis, it's free to subscribe.
By proceeding, you confirm you understand that we handle personal information in accordance with our Privacy Policy.


