Aussie property: 30 years of fake news about how often prices double

Back to you in the studio apartment. Via Getty
Sydney’s emotionally fragile housing market declined by a nailbiting -2.2% in July — the single biggest monthly loss since January 1990.
But what’s the drama really all about?
I mean, don’t house prices double every few bloody years or something? Turns out, no. And also like love or life or flat batts, it’s not that simple.
Only last week new research out of Domain suggests that, at least historically, house values don’t do the usual boom and bust cycles.
More research is emerging which seems to show property in Oz is less about buying the dip and selling the peak, but something much simpler and less grandiose.
As CoreLogic’s Head of Research and Everything Else, Tim Lawless says in a moment:
Time in the market is more important than timing the market.
– Tim Lawless, CoreLogic August 2022, in about a few pars (below)
Lookit Sydney for heaven’s sake – house prices here have way more than doubled in the past decade – up around 150% for the decade till around Xmas last.
And after last year’s panic-fuelled, pandemic-pushed, record-breaking price pirouette, where the cost of a piece of the Harbour City jetéd some 30% – or by about $1000 for every working day minus a few Sundays – suddenly the punters from Parramatta to Petersham have been treated to a price retreat of about -3.5% over the last three months or so.
The CoreLogic home value index (HVI) fell -1.3% nationally in July — a third straight month of falls, and Sydney’s sixth.
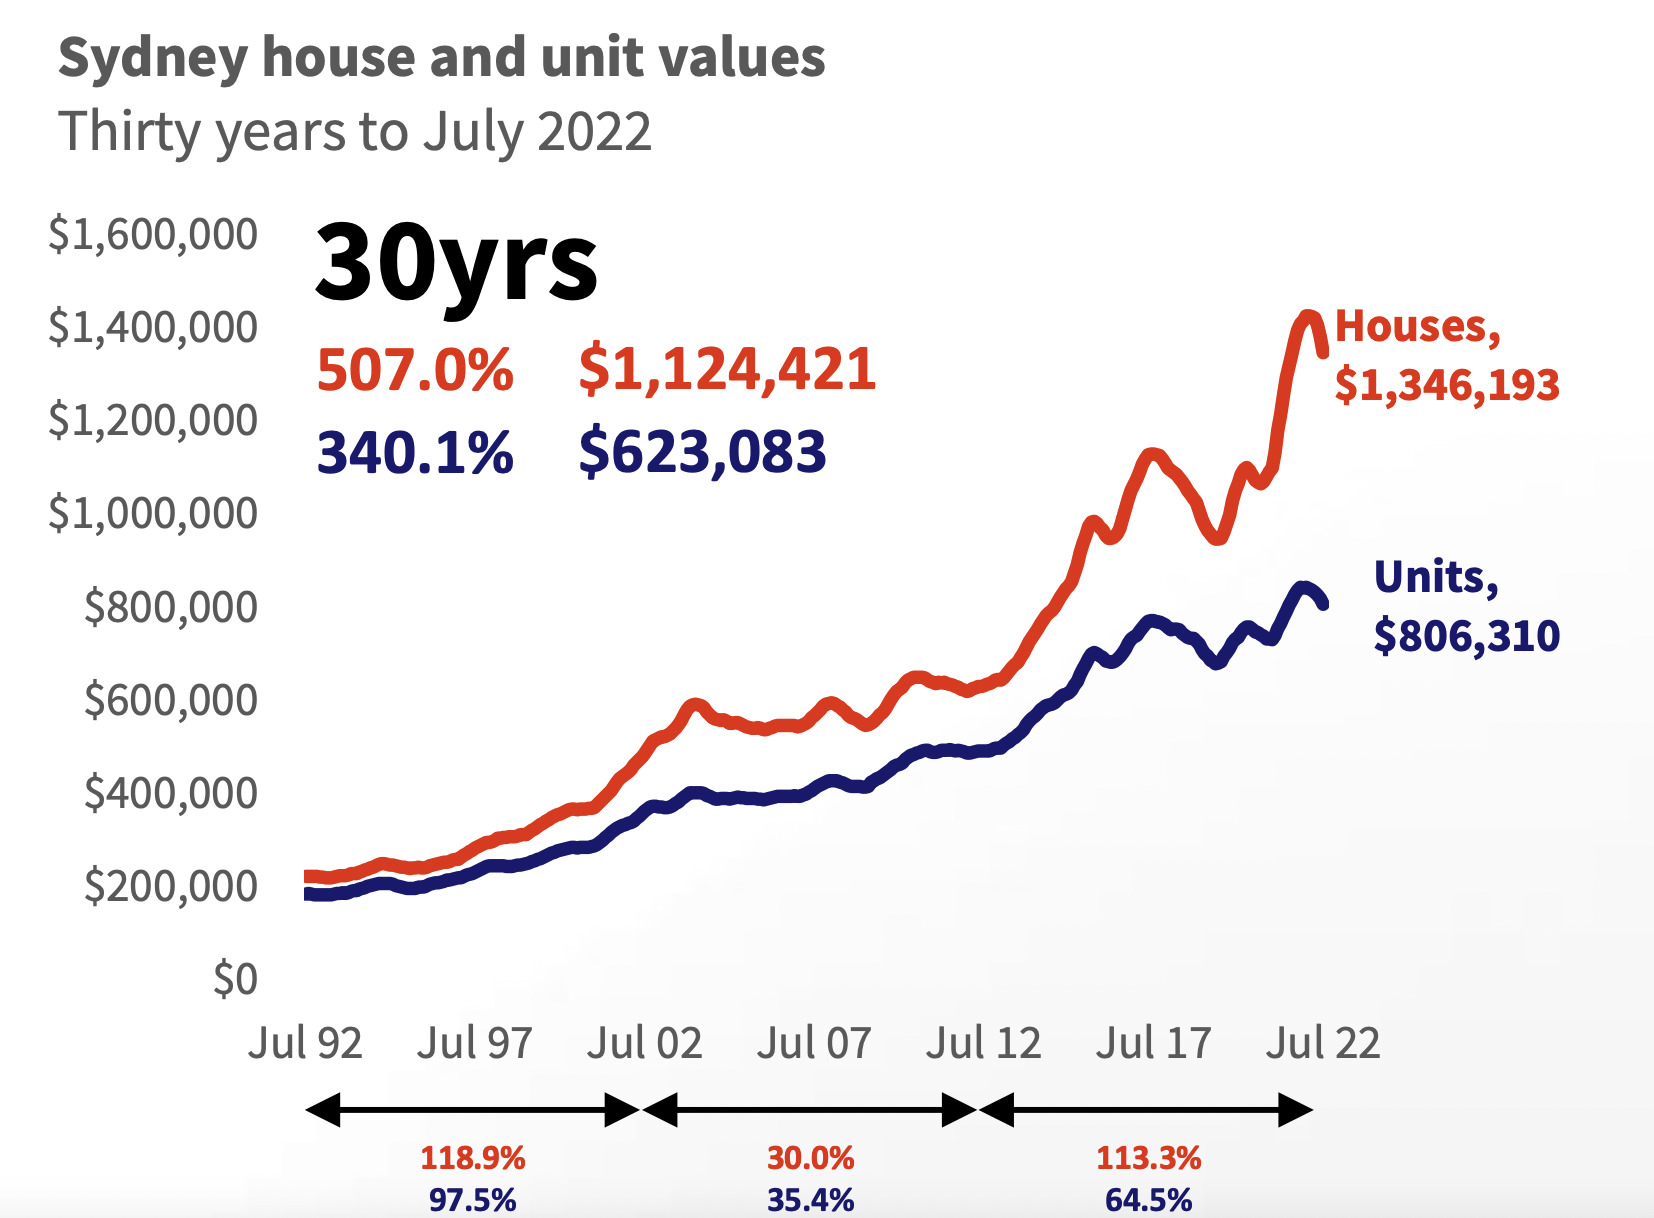
Over the past 30 years Sydney dwelling values have increased by 449% (5.8% per annum), with the 10 years ending July 2022 recording the highest rate of growth over the past three decades. The 30-year growth rate was the second highest of any capital city, after the cold wet city, Melbourne (459%).

Sydney’s median house value has increased from approximately $221,770 in July 1992 to $1,346,190 in July 2022; an increase of circa $1,124,420.
Unit values are approximately $623,080 higher over the past 30 years, rising from $183,230 in 1992 to $806,310.
The best performing sub-region of Sydney has been houses within the Marrickville-Sydenham–Petersham (hang on, that’s where the author lives), where values have risen by 660.1%, equating to an approximate dollar value gain of $1,539,280. Bitchin.
Lawless talk
But when it comes to this kind of stuff, Corelogic’s man outside the everyday legal structures that bind the rest of us – Tim Lawless – says don’t panic, don’t fall for the hype and also that patience is a virtue.
I’m not sure about that last one, but according to Lawless it does so happen that the average hangs onto their place a lot longer than the average market cycle.
What we need, CoreLogic reckons is some old school context. Sort out the pub talk from the proof. And we agree.
So, courtesy of The Lawless One, here’s some important red flags to consider when getting too excited about how significantly housing values have changed over the last 30 years.
Check it out:
For homes sold over the past 12 months, median hold period (ie: the number of years between individual home sales) was 9 years.
Through the peak of the latest growth cycle, approximately 617,300 homes were sold across , the largest number of sales since 2003, but that equates to only 6.3% of dwellings turning over in a year, highlighting that most home owners aren’t directly impacted by changing values.
Over the last three decades has seen six distinct cycles of growth and an equal number of cycles of decline (including the current downswing) and these have been differently characterised, ie: tax policy, monetary policy, economic whizzbang shocks, fiscal stimmy and different broader garden variety economic conditions.
While housing values move through cycles of growth as well as declines, the long-term trend is undeniably upwards.
Nationally, dwelling values have increased 382% over the past 30 years.
Or in annual compounding terms, up by 5.4% on average since July 1992.
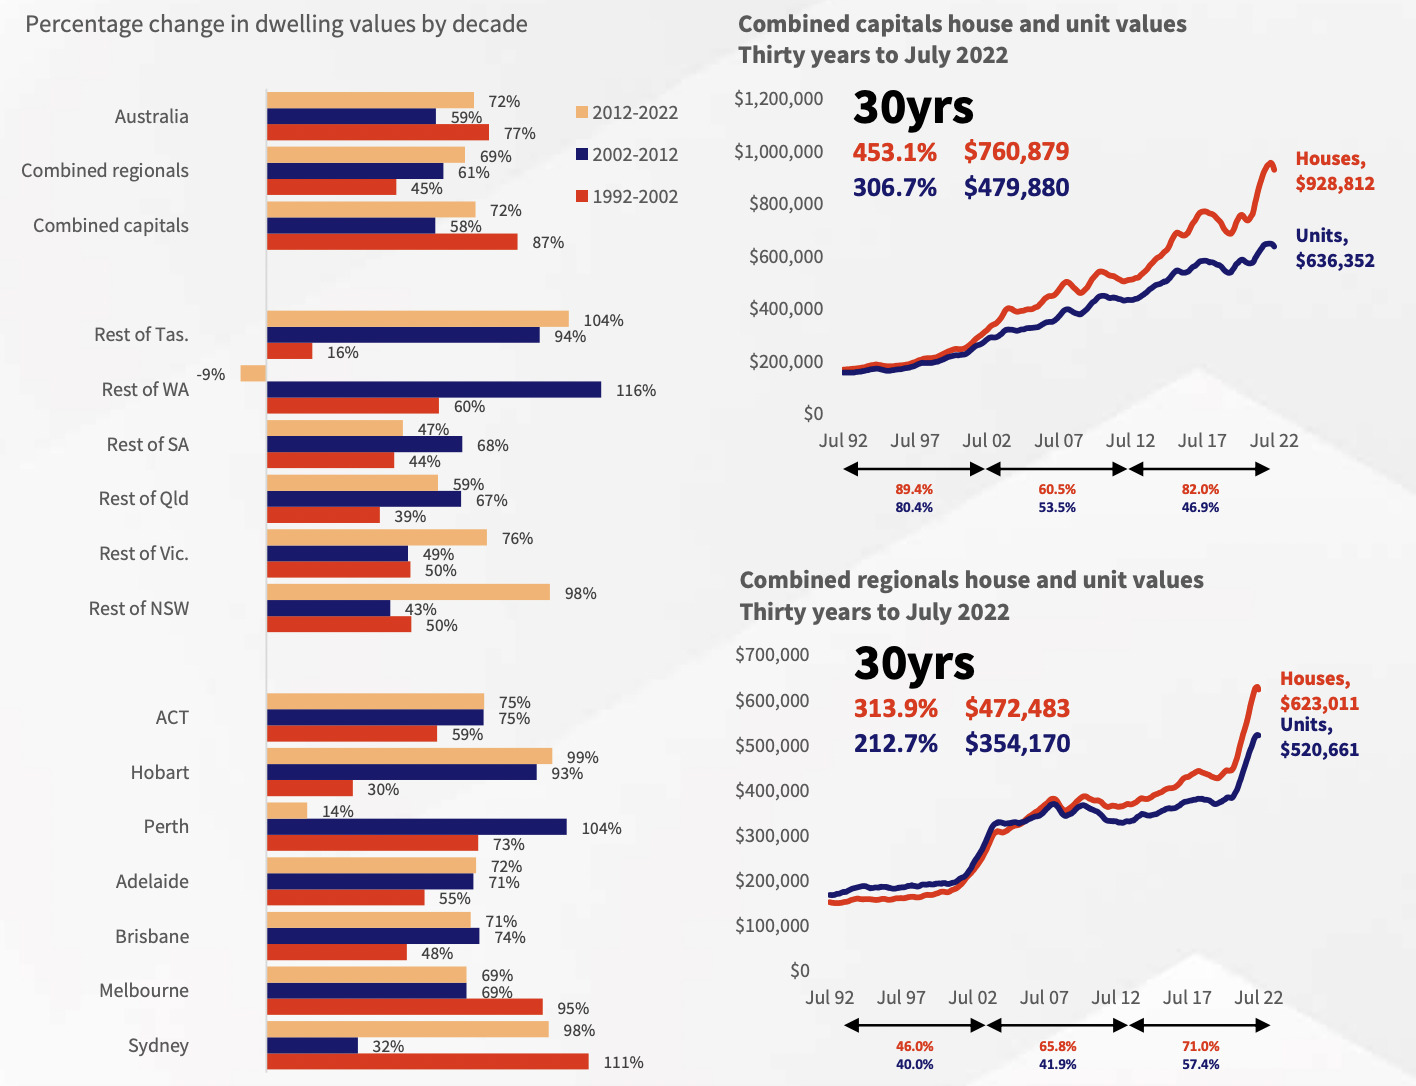
Across each of the past three decades, at a macro level, it was the 1992-2002 decade which provided the largest capital gains, with CoreLogic’s Home Value Index (HVI) rising by 77%.
The middle decade (2002-2012) saw ‘s HVI rise by 59%.
The last 10 years has seen dwelling values increase by 72%.
All about your postcode
For example, Mr Lawless points out – the mining boom and bust over in Western saw Perth housing values rise by 104% between 2002 and 2012, but today’s values are only 14% higher over the current decade (2012-2022).
In ‘s largest village, Hobart, the 1992-2002 period was the weakest of the three decades CoreLogic analysed, with values up 30%.
The last 10 years has seen Hobart’s housing values surge 99% thanks to stronger migration and an ongoing undersupply of housing.
“Overall, the long-term trends highlight the cyclical nature of housing markets, Lawless says. “Changes in housing values over decades are a clear reminder that time in the market is more important than timing the market.”
That’s just a myth
Fake news: it’s common for housing values to double in 10 years. It’s not.
Over the past decade, none of the capitals and only one regional market (take a bow Regional Tassie) recorded a doubling in value – or what maths people call a growth rate of 100% or higher.
Twixt 2002-2012 it was only Perth and Darwin where housing values doubled.
“Most regions have seen house values rise substantially more than unit values over the past 30 years, which is likely a reflection of the scarcity value of land driving a faster rate of appreciation,” Lawless says.
“Conversely, the unit sector tends to show higher yields relative to houses. Across the combined capital cities, house values are up 453% over the past 30 years, substantially higher relative to the unit sector where values are 307% higher.”
Not such a big discrepency in the regions though – house values are up 314% since 1992 compared with a 213% rise in unit values.
The smaller long-term rate of capital gain might be attributable to lower unit supply levels across regional , along with higher demand for holiday style units or retirement options.
Capital cities have recorded a higher growth rate than the regional areas of over the past 30 years, with dwelling values rising by 409% and 294% respectively across each of the combined capital city and rest of state regions.
“The higher growth rate across the capital cities probably reflects a combination of higher demand and greater scarcity of supply compared with regional markets, along with more diversified economic conditions within the capital cities,” Lawless reckons.
Highest 30-year growth rate
Capitals: Melbourne +459% (5.9% per annum)
Regionals: Regional Tasmania +361% (5.2% per annum)
Lowest 30-year growth rate
Capitals: Perth +303% (4.8% per annum)
Regionals: Regional WA +214% (3.9% per annum)
The long game… 30 years of housing values:

Best City performers last 30 years:

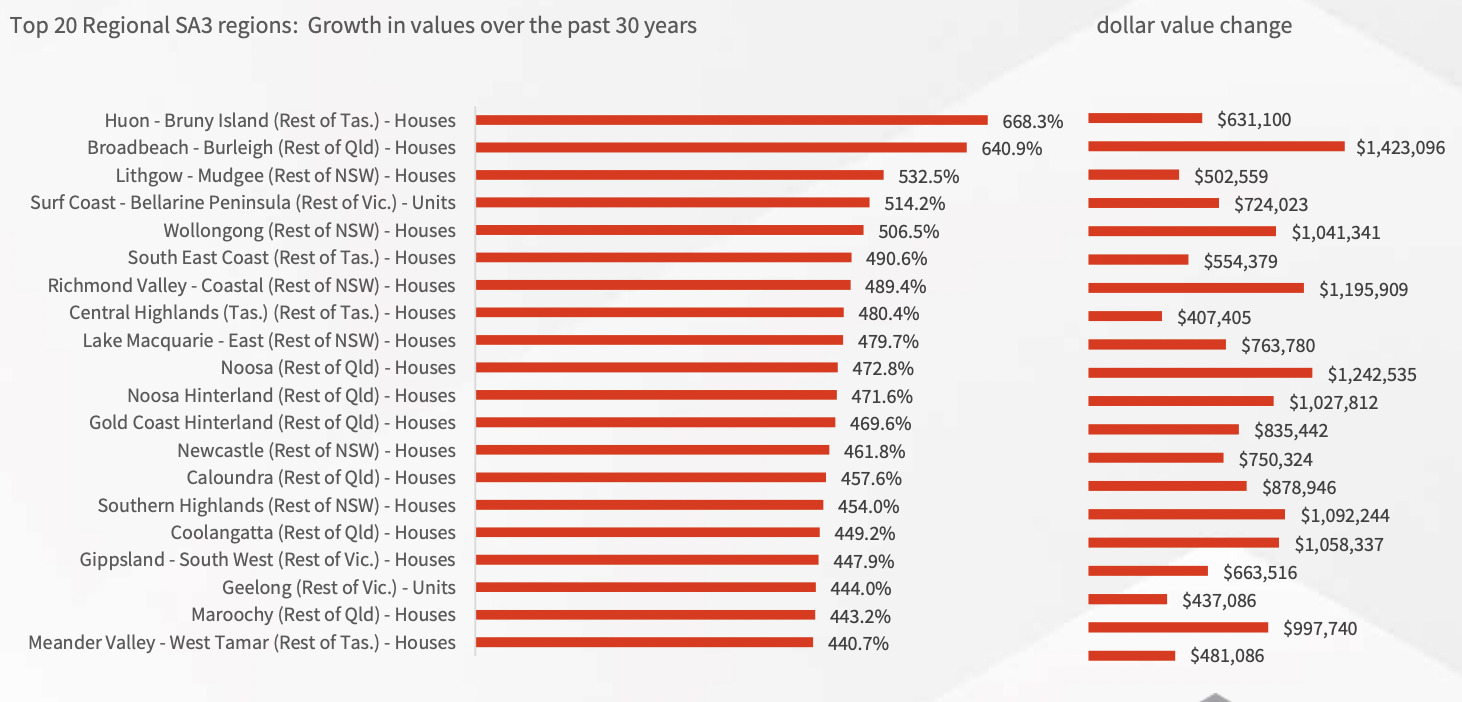
Best Regional performers last 30 years:

Related Topics
UNLOCK INSIGHTS
Discover the untold stories of emerging ASX stocks.
Daily news and expert analysis, it's free to subscribe.
By proceeding, you confirm you understand that we handle personal information in accordance with our Privacy Policy.


