Aussie property lost half a trillion in value from Easter to Halloween
Lost property. Via Getty
Properdy in Oztober… jeepers. I don’t even know where to start.
So much fuss, so little internet.
I guess: Gidday and welcome back to Stockhead’s How Much Is Your House No Longer Worth?
Thanks for joining us again. I don’t know why you do.
Sigh.
Let me set the scene for you again:
Also…
So… where were we?
Ah yes. Now is absolutely the time to get out and buy that overpriced Aussie house.
Having said that, borrowing money, getting in debt, or – by Jesus, Joseph and Mary – getting a new mortgage is something I would not wish on anyone except perhaps Satan or the sharks from Jaws 1 and 3. (I found No. 2 a far more sympathetic villain).
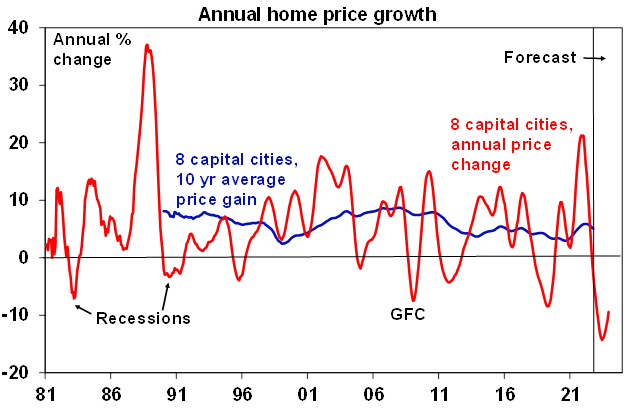
In less than 10 months, AMP Capital expects Australian home prices to fall 15-20% – top to bottom.
While that’s disturbing in itself, it won’t help homebuyers too much, because prices on average jumped a lot more than that during the pandemic property splurge.
AMPs chief economist Shane Oliver reckons this’ll happen if the official cash rate (OCR) tops out around 3% by the September quarter of next year, citing both our wonderfully poor affordability and the impact of rising mortgage rates which continue to play cat among pigeons with values.
Dr Shane then says, but – and, by the Power of Greyskull, there’s always a but – if the cash rate should rise to say, 4% (as the money market is assuming) then all bets are off.
“Home prices will likely fall 30%,” he says, producing a graph:
Alone, alone. All, all alone;
Alone on a wide wide sea
Loan growth’s not good.
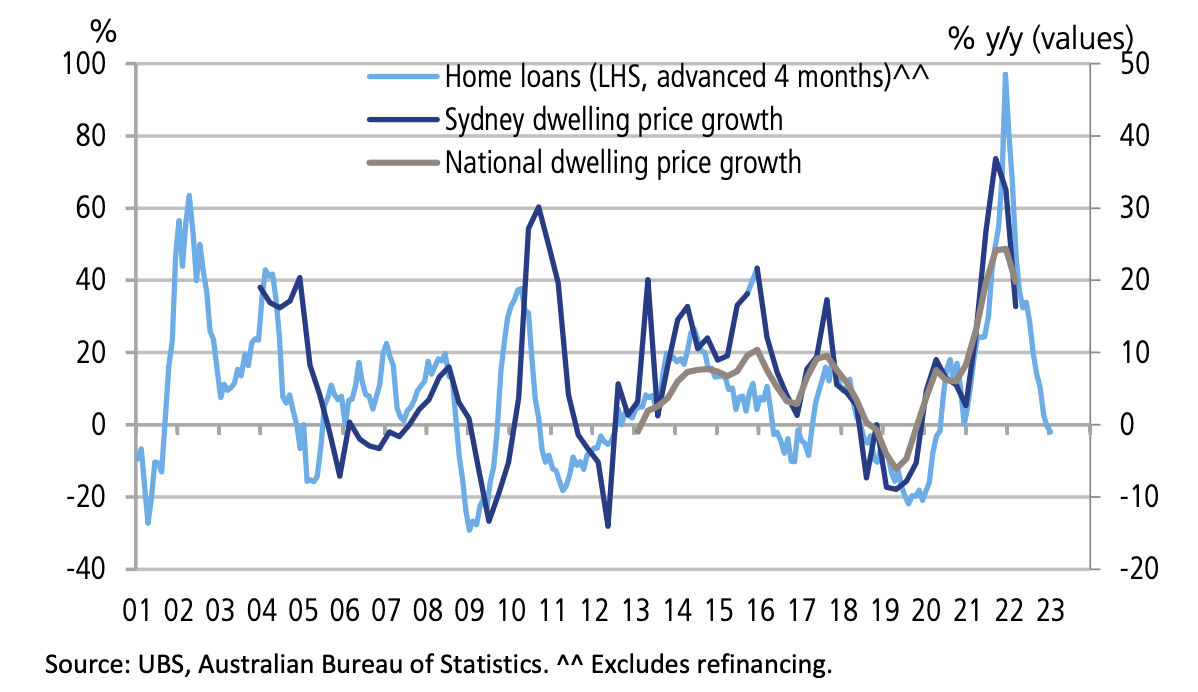
According to Crestone LGT, one of the key leading indicators for prices — home loan growth — suggests more weakness in the post over at least the next six months.
Crestone LGT‘s Scott Haslem says Sydney’s and Melbourne’s annual price growth has slowed from around 30% earlier in the year to 10-15% now.
“The slowing in loan growth suggests a further deceleration to at least zero, with the likelihood this will extend to about a 10% fall in prices (moderately worse than the national 7-8% decline in both 2009 and 2019). This is consistent with our expectations for loan growth to fall 20% over the coming year.”
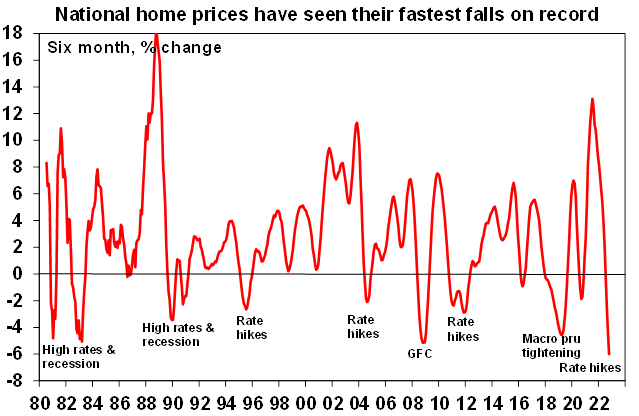
Since their highs of just six months ago, national average property prices are down 6%.
Coincidence? Or something more sinister…
(Ed: Sighs. It’s a coincidence)
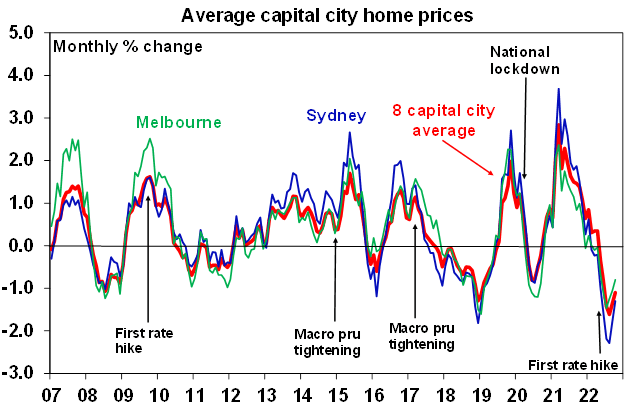
“The rapidity of the decline in home prices this time around likely reflects the de facto tightening that started with rising fixed mortgage rates a year ago, the speed of RBA cash rate hikes and heightened household sensitivity to rising interest rates flowing from much higher debt levels now along with the extent of the prior boom,” Dr Oliver said in a note earlier this month.
And now CoreLogic says the apparently brief, COVID-shaped rocket under the regional property market has reportedly broken into pieces somewhere in the ionosphere and is expected to re-enter orbit above several important, unsuspecting regional markets.
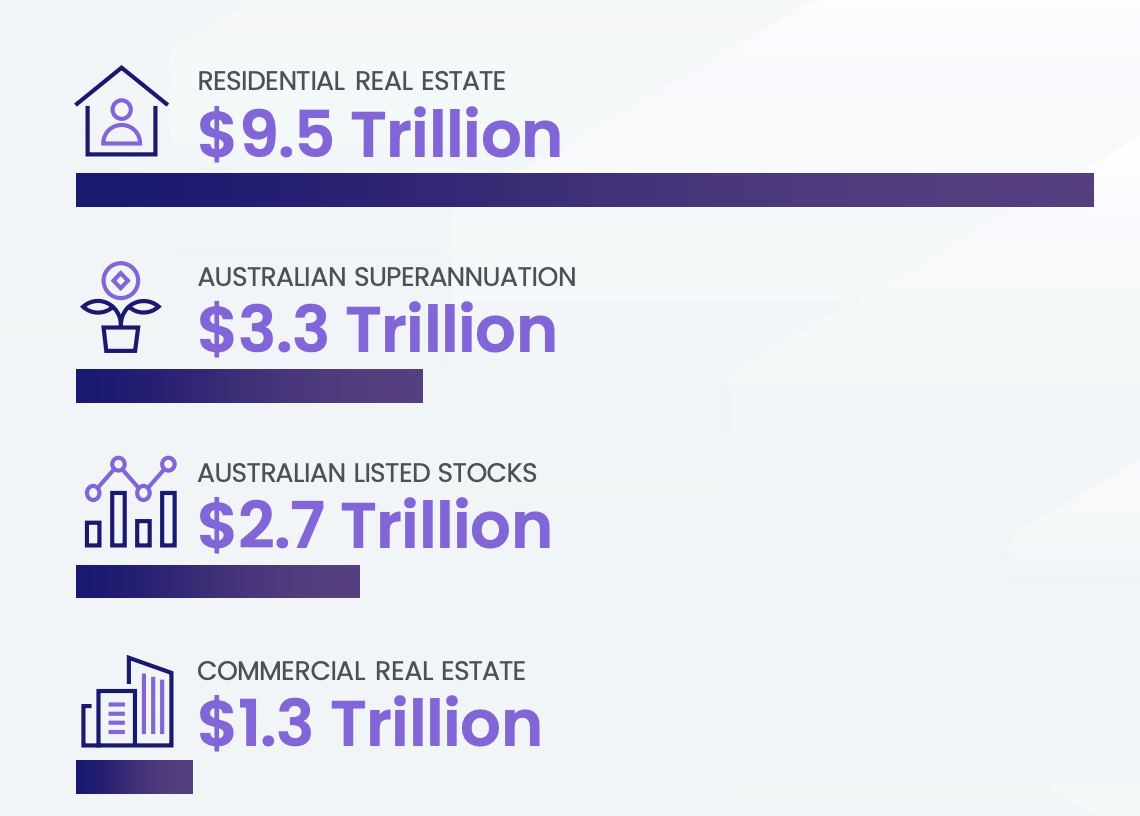
With that in mind, by the final weekend of October – let’s call it Halloween, like everyone else in Australia under 11 years old – the combined value of this country’s residential real estate was worth $9.5 trillion.
A billion dollars less than September and half a trillion bucks below CoreLogic’s estimated April peak (of around $10 trillion).
It’s a lot of money, most of it from Darling Point which is just about the only good news I can offer.
Let’s tour the facility
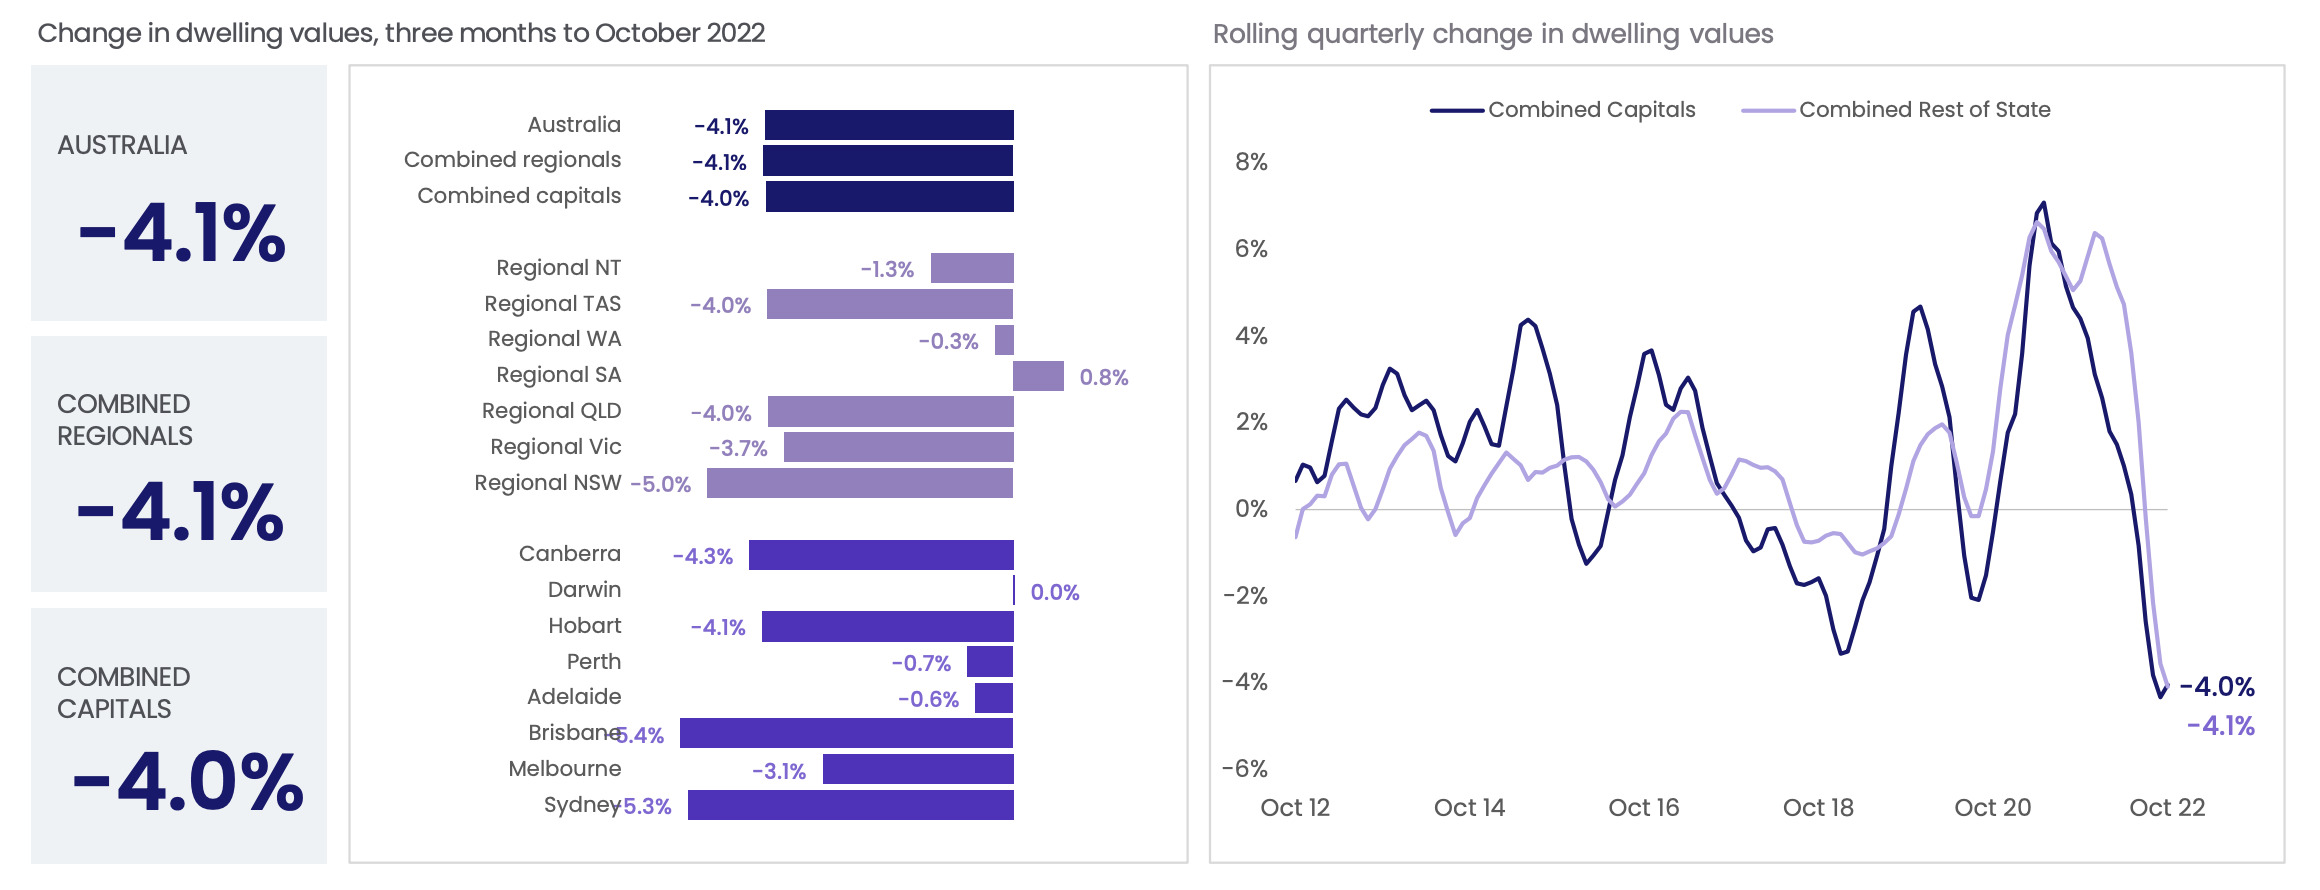
In this stunning compilation of words AND pictures, I thought we could tour the property of a nation (Ed: it’s okay, it’s this one) where dwelling values – down 0.9% over the past 12 months – have seen their first annual decline since October 2019. Where price falls have ‘become more geographically broad-based’, and where the good news is the monthly pace of falling home values might have eased a little from -1.4% in September, to -1.2% through October, but the bad news is it’s still the fastest pace of decline on CoreLogic records going back to 1980.
Look closely, and you could be lucky enough to see CoreLogic’s first ever recorded year-on-year decline in Aussie property values, driven by the -3.1% annual drop in the combined capital cities.
The highest annual growth rate in dwelling values among the regional and capital city markets was across Regional SA, at 20.4%. The lowest rate of change in values was across Sydney, down 8.6% over the year.
Across Australia’s 25 largest regional markets, home prices in six of the most cracking ‘lifestyle markets’ recorded falls of -6% or more last quarter.
(We haven’t told them yet, but what the hell. Bums on seats, I say.)
In order of disappearance:
-
Richmond-Tweed (-11.7%)
-
Southern Highlands and Shoalhaven (-7.1%)
-
Sunshine Coast (-7.1%)
-
Gold Coast (-6.4%)
-
Illawarra (-6.1%)
-
Newcastle and Lake Macquarie (-6.0%)
All the rat race markets CoreLogic looks at recorded a quarterly decline, but for three standout performers who managed to grow by an entire 0.1% between them.
They are: Central Queensland (0.1%), SA’s South East (0.0%) and WA’s Bunbury (0.0%). Take a bow.
House values in Richmond-Tweed (-7.8%), Illawarra (-1.9%), and Ballarat (-0.5%) are also below the levels recorded this time last year, while values across Newcastle and Lake Macquarie are flat year-on-year (0.0%).
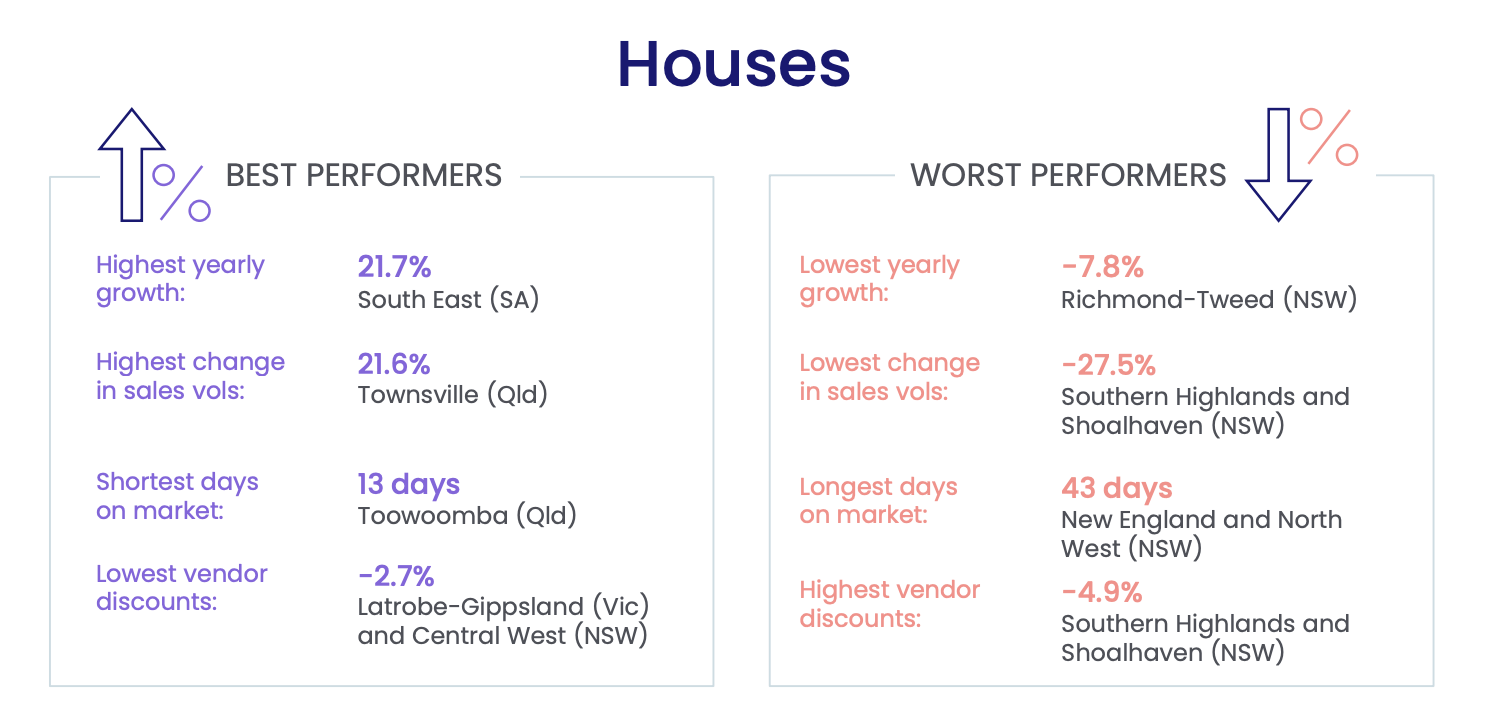
Regional NSW also dominated the worst performing house markets across a range of different metrics.
Southern Highlands and Shoalhaven recorded the largest decline in sales volumes (-27.5%) and the highest vendor discounting rate (-4.9%), while the New England and North West region clocked up the longest time on market at 43 days.
CoreLogic economist Kaytlin Ezzy said falling value first seen in the more expensive capital city and regional markets were “more geographically broad-based over the three months to October.”
“87.8% of the regional house and unit markets recorded a quarterly decline in values.”
“Consecutive interest rate rises, persistently high inflation, and waning consumer sentiment saw the pace of value declines accelerate across regional Australian property markets,” Ms Ezzy said.
That about covers it
No, wait.
Nationally, sales volumes are trending lower as demand wanes:

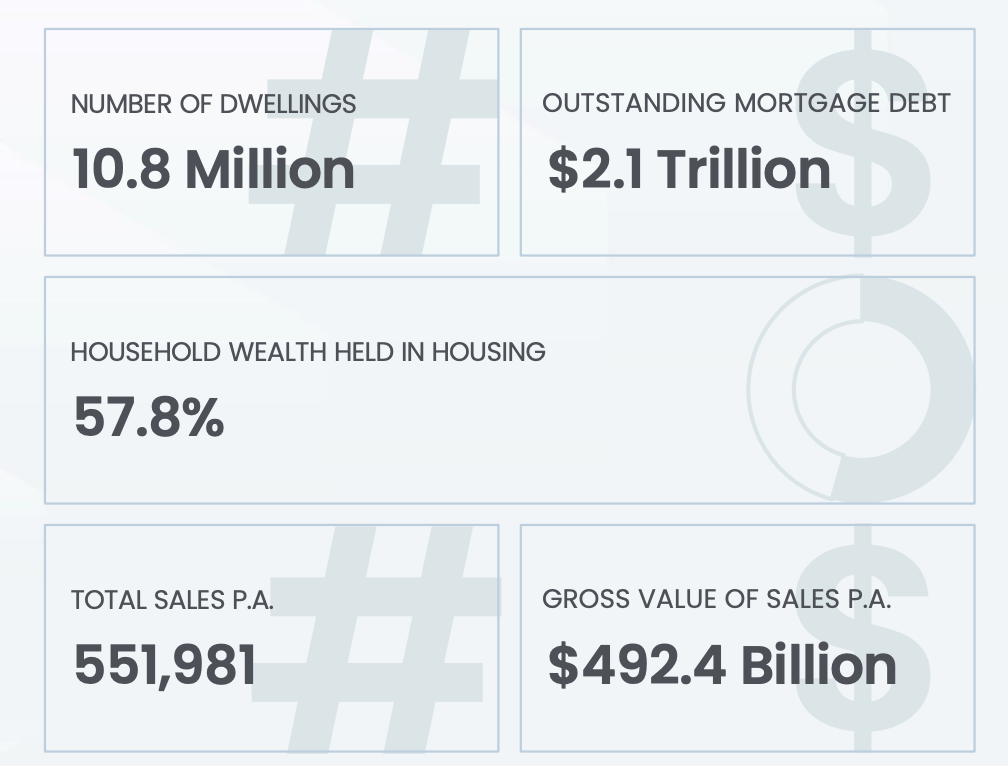
CoreLogic says in the year to October, there were 551,981 sales nationally, down 9.3% on last year.
At the national level, properties are also taking longer to sell. Over the same time, median days on market was 36, up from a low of 20 days over the three months to November 2021.
The combined capital cities clearance rate steadied through October, averaging 59.5% in the four weeks ending November 6. This is pretty awful against the 78.5% in the same period of 2021.
Rental value growth remains high across Australian dwellings, but the annual growth in house rents has shown signs of moderating. Unit rent values have seen increased momentum, rising 12.4% in the past 12 months. Across all dwellings, this resulted in an annual rental growth rate of 10.0%.
Housing finance secured totalled $25.1 billion in September.
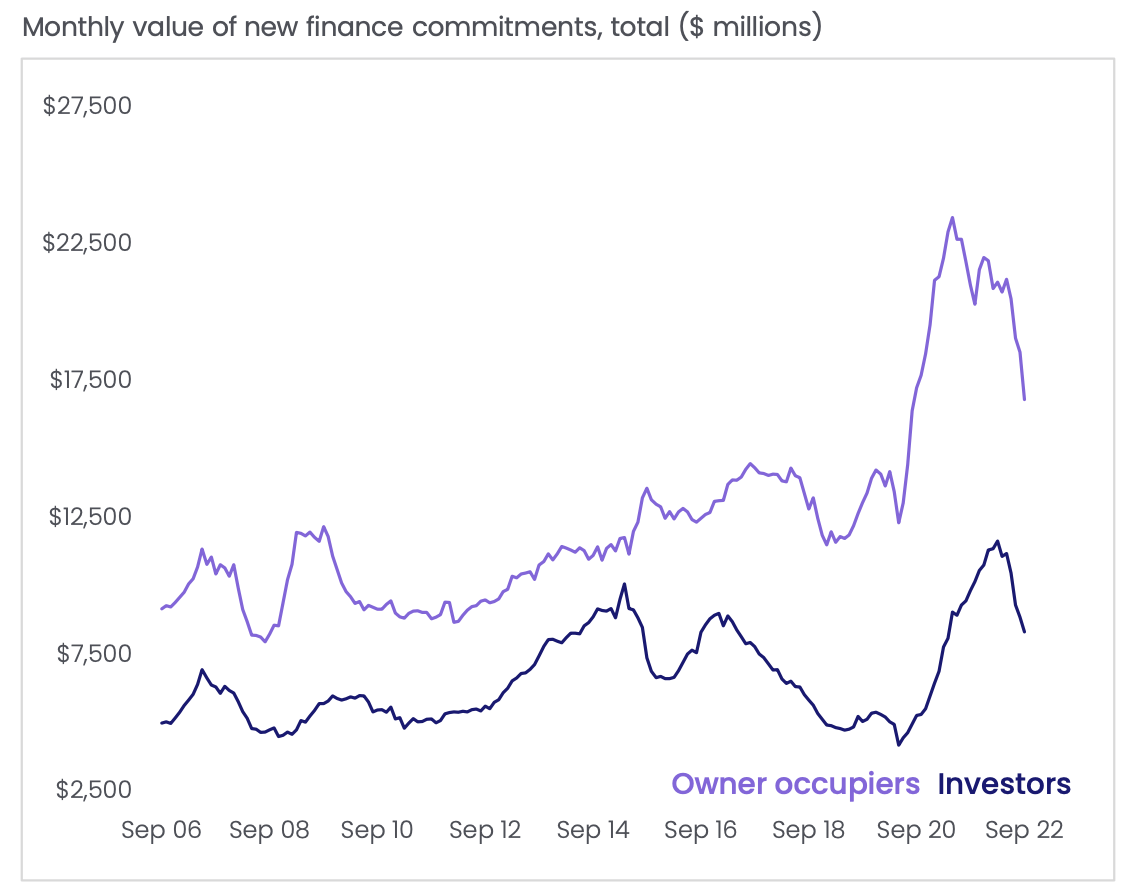
The value of secured housing finance fell 8.2% in the month, taking new housing finance 22.4% lower than a recent peak in May. Investor finance fell 6.0%, compared with a 9.3% fall in owner occupied lending in September.
The RBA increased the underlying cash rate target a further 25 basis points through November, but you knew that.
The RBA Governor Dr P Lowe reiterated further increases in the cash rate ahead, as the Board remain ‘resolute’ in returning inflation to target.
Related Stories


UNLOCK INSIGHTS
Discover the untold stories of emerging ASX stocks.
Daily news and expert analysis, it's free to subscribe.
By proceeding, you confirm you understand that we handle personal information in accordance with our Privacy Policy.


