Trading with Focus – Don’t order the limo til you’re out

Pic: Stevica Mrdja / EyeEm / EyeEm via Getty Images
So you bought in. But how do you know when to get out – at the right time?
Poor Joe. Such a story for the ages. He went all-in on Carol Baskin and overplayed his hand, then he ended up losing it all. He was still so convinced that he would be proven right, and finally, that he would be freed under a Presidential pardon. He was so sure of his release that he had a limo waiting for him at the prison on Trump’s last day in office.
A large part of successful trading requires going against your emotions and understanding the psychology of money. The stockmarket doesn’t respect hope, sometimes it doesn’t respect logic, and no-one should expect to be bailed out just because they ‘did the research’.
When you feel generally sick to the stomach, and you think that we are about to enter the beginning of the end of the world, as foretold by some old gypsy woman, that has often proven to be the most lucrative time to buy. Like at the bottom of the GFC in early 2009, or after the share market has collapsed once a global pandemic has been declared.
In an overall market sense, maximum fear usually means maximum opportunity – but individual companies can go broke…
When you are slapping yourself on the back, thinking about quitting your job to become a share trader, posting your gains on social media and buying excessive presents for people around you, its often a sign you should sell it all up.
There’ll always be another stock opportunity, there’ll always be another sell-off. FOMO is a made-up acronym to describe the feeling that you should be sitting this one out, not chasing stocks at all time highs.
Some of it is about understanding how this psychology is displayed in the charts, and the different emotions and forces that drive stock prices. Once you understand these forces, and trends, you still need to protect yourself. Because the trend is your friend, until the bend in the end…
Obviously, first, you’ll need good charts. TradingView is great but it’s pretty high-level for the average user and their live pricing is expensive .
Comparatively, it costs about the same as Marketech Focus on a per-month basis, and it doesn’t get you brokerage rates on your own individual HIN at $5 (or 0.02%) per trade.
You’d still need a broker to place your trades, and then you’re flicking all over the place to get the info you need. Aint nobody got time for that!
At Marketech, we have nine different chart types. The one chartists commonly use is a candlestick, or Open/High/Low/Close (OHLC).
This shows in a glance whether the stock rallied or fell during the day from where it opened. If I see a bunch of days in a row where it fell during the day, it might mean that people are starting the day a little over-optimistic.
Often, it’s the retail buyer loading up on the open (because of FOMO they are in a rush to get in). Then it can fade during the day, showing that the positivity might not be as widespread. But unless you are an intraday trader, you need to look at the bigger picture.
So, that is when the chart ‘timeframes’ matter. We run ours from 1-minute intraday charts, out to 1-month charts, with many increments in between. Flick between the different timeframes quickly and easily, even on your mobile.
Mostly, people watch the market regularly, even if they are ‘long term investors’, and getting caught in the day-to-day volatility can cause sea sickness. Move the chart out to ‘weekly’ or even ‘monthly’ to see the longer-term trends, in the same way you look past the waves for the horizon if you are feeling queasy on a boat.
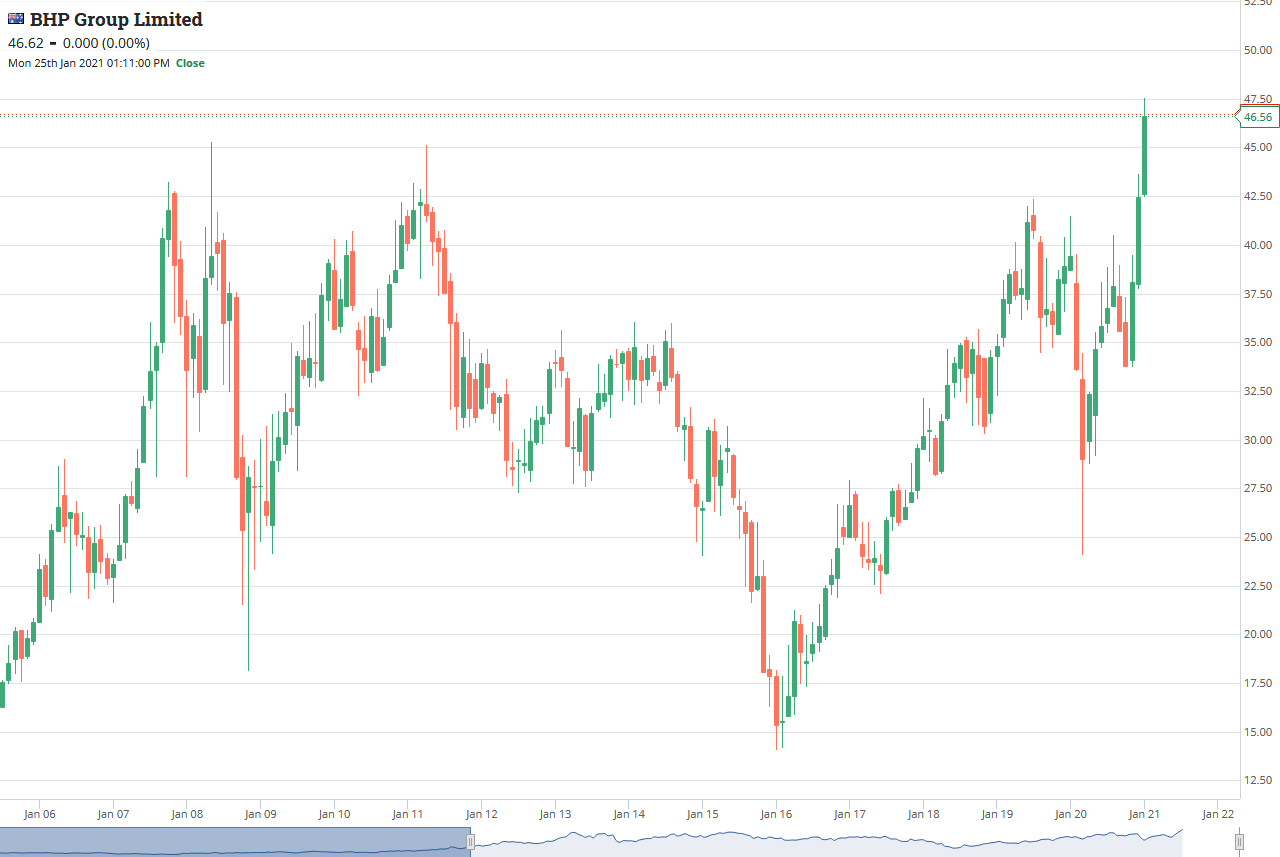
BHP Daily chart – looks like a longterm buy and hold?

BHP Monthly chart – still look like a buy and hold?
Then, there’s a few easy ways to lock in your profits (or to minimize your losses) using simple charting tools. Share trading isn’t like a horse race – you can pull your horse out of any race at any time, and reenter it in another race. Don’t keep racing if the conditions change, and don’t believe your confidence or research is enough to win.
Just lay down, learn from it and wait for the right race – don’t just keep racing all day every day hoping to win back your losses. There are thousands of companies on the ASX, and the conditions change every day. If I was to guess, there is at least one decent sell-off in the general market each year, so don’t be afraid to wait. Nothing just goes up in a straight line.
With that in mind, at Marketech Focus we also have 24 technical indicators and a bunch of drawing tools, such as trendlines and the like. You can learn about each one just by googling it online, but I’ll mention a couple to give you a feel of what they can do to help you maximise your profits (and minimise your losses).
First, if you have a stock that is trending up, the simple trendline is pretty handy. Join the dots. It doesn’t have to be overly scientific.
Just using a simple trendline on the All Ordinaries weekly chart as an example, you could have established the catalysts to sell out at 6,100 points, re-enter at 5,750 (6 per cent lower), sell out again at 6,900 (20pc higher) and re-enter at 49,00 (30pc lower). Since then it’s another 45pc higher. You can do this with ETF’s and sleep well at night with only a cursory glance at the markets every now and then.

This is a long-term total market strategy, but for the gambler looking for the life changing share market trade, the weekly chart on the All Ords might not cut it.
They might want to choose which stocks to buy, rather than assess whether the whole market is going up over a number of years.
So, something like the Average True Range might help you decide where to put in a stop loss. Stop losses are hard to respect once the stock has started falling, you really want to make a promise to yourself that you are going to deal with your emotions well before you start having the emotions!
In theory, the Average True Range (ATR) takes the normal volatility and indicates the difference between a tsunami and when a stock is just bobbing around in the normal waves. So the more ‘normally volatile’ a stock is, the deeper the stop loss needs to be. Therefore, a big ATR means a lot of ups and downs to accept.
So, the Afterpay weekly chart shows a fairly decent trend. Earlier on, when it was just going up normally, the ATR is lower because the volatility was also lower.
Then when it spiked higher and faster over the last year you need to accept that for this trend to actually change, as opposed to a normal period of profit taking within a longer trend, there needs to be a much bigger selloff.
Conventional wisdom says the ATR should be doubled, and that is the amount below the share price that a stop loss will indicate a change in direction. At the moment, the ATR on APT is nearly 12, so you would need to set the stop-loss at $24 below the current share price if you use that logic.

Therefore, if you are buying APT now, you need to accept that a selloff of up to 17% could just be ‘normal volatility’ and if being down 17% makes you feel sick to the stomach, then this is not the stock for you!
These are just a couple of the Marketech tools you can use to minimize your losses. Next week I might tell you about a few more, but they’re all there at the click of a button. They’re also displayed live (in real time) on your PC and your mobile, with all of your settings saved across your separate devices. So if you’re on the move, you can still see all of your charts set up on your mobile, and get the alerts that you’ve set pinged to your mobile as they hit.
In conclusion, don’t let your emotions rule your trading. Don’t think that some guy on Facebook or Reddit knows ‘for sure’ that this is going back up. And don’t order the limo until you’re out.

At Marketech our platform is about technology, providing you the tools and technology to trade. We encourage our high-function trading platform to get you live pricing, live charts, live market depth to ensure you have the tools and trading capability at your fingertips, and on your mobile phone or PC.
You trade your own stock on your individual HIN. It is your cash in your own Macquarie account where you keep the competitive interest you earn.
Our subscribers get access to brokerage starting at $5, and then 0.02 per cent for trades over $25k. If you want to trade the market you need immediate access wherever you are and the seamless Marketech mobile app means you are live anywhere anytime.
For more information, visit www.marketech.com.au. Any queries regarding Marketech should be directed to Marketech and not to Stockhead.
This article was developed in collaboration with Marketech Stockbroking Pty Ltd (AFSL 486148), a Stockhead advertiser at the time of publishing. This article does not constitute financial product advice. You should consider obtaining independent advice before making any financial decisions.
Related Stories


UNLOCK INSIGHTS
Discover the untold stories of emerging ASX stocks.
Daily news and expert analysis, it's free to subscribe.
By proceeding, you confirm you understand that we handle personal information in accordance with our Privacy Policy.


