The Candlestick: This won’t be an easy bottom to pick

Via Getty
Carl Capolingua is total human technical analysis.
The man works below candlelight at ThinkMarkets and lives with the little candelabrums not far in the western state that does what it wants, where they admire his unique brand of price action-based naked trend tracking.
Capo has been honing this art over some 30 years of investing, advising, and managing funds.
Every week in The Candlestick, he plots the unknowable iterations of markets global, local and the very stocks within them.
Today we have a family shot:

The Candlestick – Iteration X – Reapplying cash at new heights
At least I picked one thing right!
Talking about picking, this market is harder to pick than the proverbial broken nose!
But, if I’ve correctly tipped anything right over the last few weeks, it is the likelihood I’ll be wrong at the bottom – that is, once conventional wisdom looks back in 20-20 hindsight at the price action and says, “Um, I think that was it…”
As a trend follower, I know I’ll miss the bottom. In a practical sense, this means having a far greater cash balance than required through a period where bargains were to be had by the brave. It means I didn’t buy the low on all those stocks which one face palms after the fact and says, “Geez that was cheap!”
Respecting a bear trend doesn’t mean being out of the market completely, however. Even in the worst bear markets there are always stocks whose business models are killing it.
They’re the ones whose share prices continued to rise despite the broader market carnage.
Coal stocks come to mind as we’ve discussed previously, like Whitehaven Coal (ASX:WHC), New Hope Coal (ASX:NHC), Terracom (ASX:TER) and Yancoal (ASX:YAL).
The point I’m trying to make is, during a bear market, the trend follower increases cash levels, focusses only on those stocks still in solid uptrends or those showing sufficient signs they are emerging from downtrends, and refrains from trying to pick the bottom on stuff which might temptingly look “too cheap”.
By default, this means missing bargains.
But! Missing bargains is not something to dread for a trend follower who continues to anticipate the resumption of the long-term downtrend. Rather, it is something to look forward to – after all bull markets are about 1000% easier to navigate!
By reapplying cash at higher levels – not lower levels – in essence, the trend follower trades some reward for a decreased risk of buying in what proves to be just another bear market rally.
Let’s look at some charts and try and figure out if the recent market strength is just that… or if it’s the real deal!
Nasdaq Composite (COMP): Hasta la vista, baby!
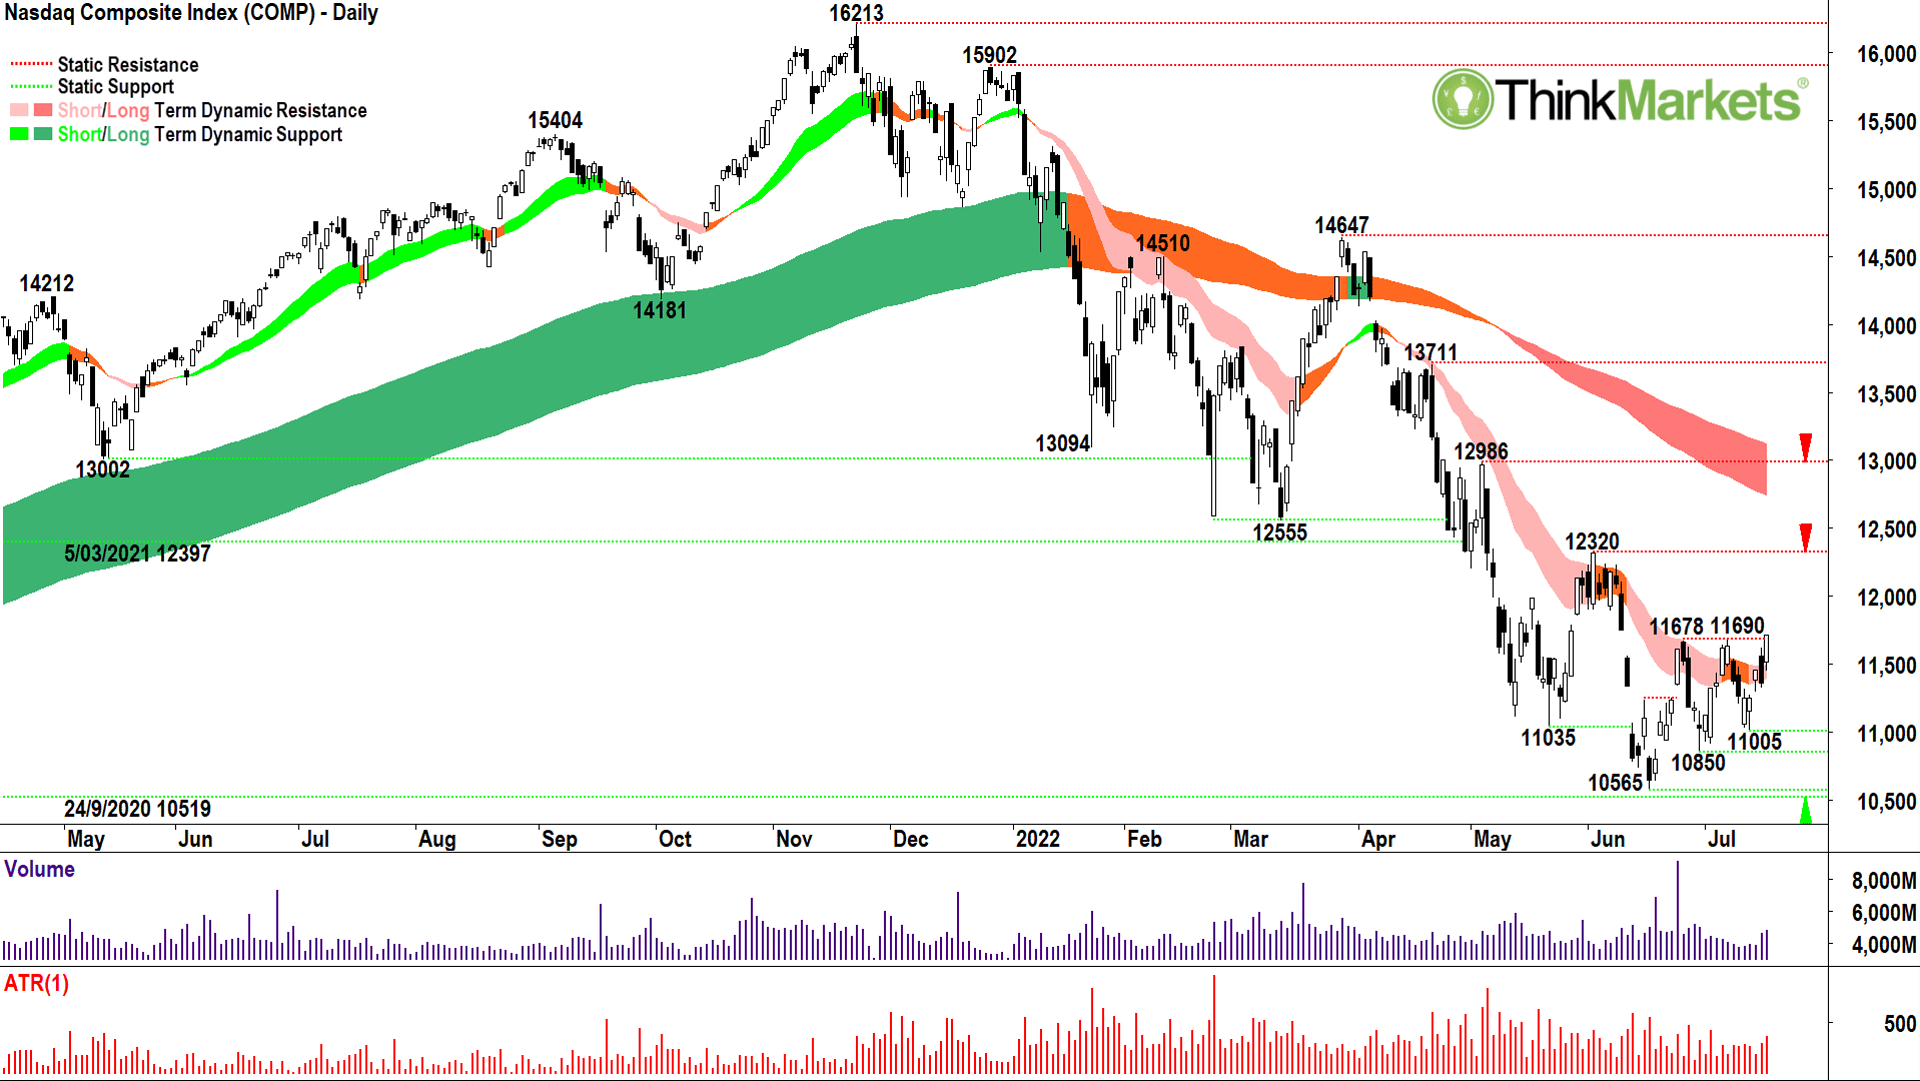
The COMP bear has been all about that pesky short-term downtrend ribbon (light-pink zone). Like a muscle-bound monosyllabic Austrian in an 80s sci-fi classic, it has terminated rally after rally. Until now? Perhaps!
Looking at the demand-side nature of the July 19 candle, I feel it has decisively closed above the short-term downtrend ribbon. As a bonus, it’s also closed decisively above the key static supply point at 11690. Further, it solidifies the price action as higher peaks (two now with the eventual peak to form in this run, plus 11690 > 11678) and higher troughs (two now with 11005 > 10850 > 10565).
We’re tracking at 16 out of the last 21 candles since the June 16 low as white, and many of those qualify as bona fide demand-side candles (i.e., large white bodies and or large lower shadows). Read as “accumulation”, and “a vacuum of motivated supply”.
The COMP is not out of the woods yet, however. (Think Arnie…”I’ll be back…“)
The long-term downtrend ribbon (dark-pink zone) needs to be dealt with in exactly the same way the short-term downtrend ribbon was. It’s going to kick in around 12500, and quite possibly (depending on the timing of a continued rally) around the key static supply zone topped by 12320.
In summary, as far as possible bear market lows go, this one is certainly growing in stature. I’m going to switch my bias to Neutral for now and watch for candles and price action around 12320-12500.
If I see a wall of white candles and continued solid price action there, I’d be inclined to switch to Bullish. If I see the opposite, i.e., black candles and lower peaks and troughs, it will be back to Bearish for me!
View: Neutral, bullish after a close above long-term downtrend ribbon, bearish after a close below 10565.
Apple (NASDAQ: AAPL): The tree didn’t grow far from the Apple
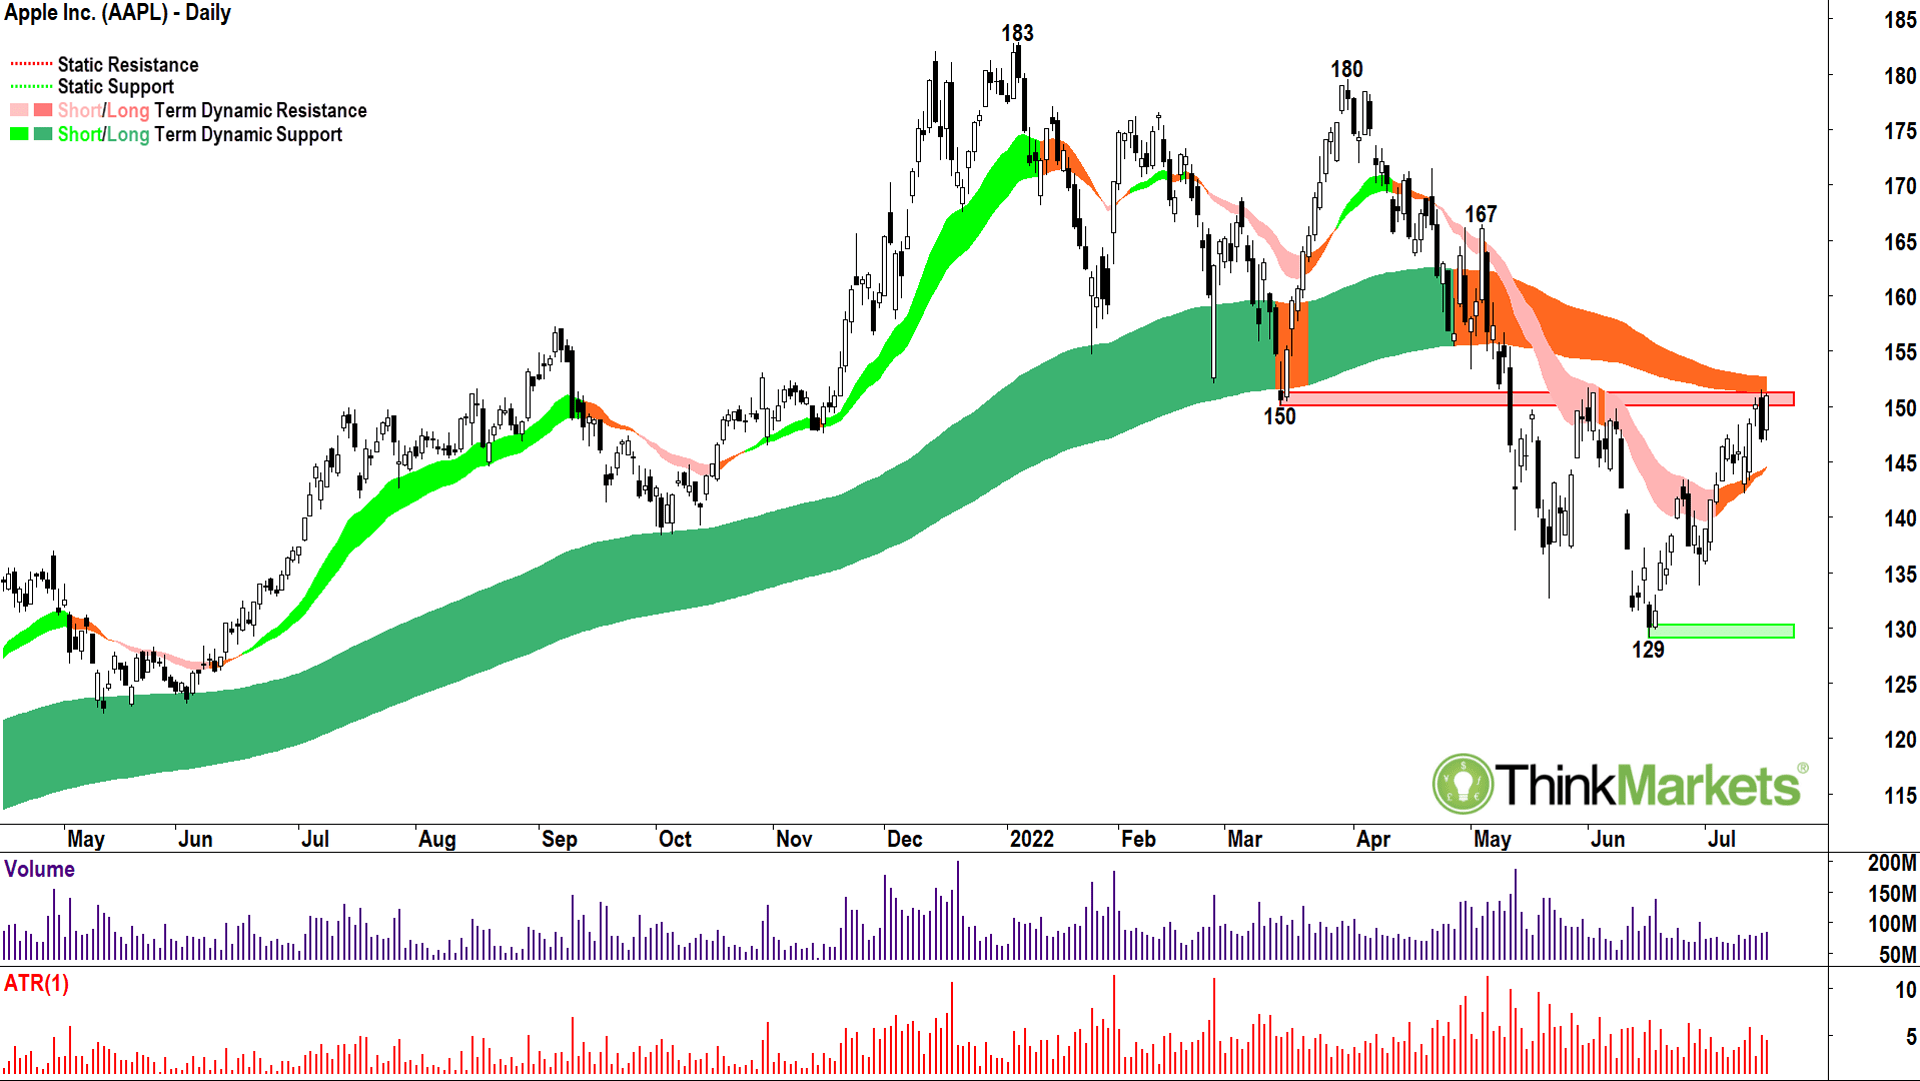
Apple is the largest component of both the Nasdaq (around 14%) and the S&P500 (around 7%). It therefore has a big impact on each of these major global indices. Indeed, any discussion of the COMP should include a view on its often most important constituent.
Remember those 16 out of 21 white candles on the COMP I talked about?
Well looking at the AAPL chart it’s clear where they came from. Ditto.
Even more impressive, AAPL’s stock price is up over 17% since the June 16 low of $129.04.
Compare this to the broader COMP’s 8.3% gain, and it is clear AAPL is bench-pressing the world’s key gauge of risk-on. By this I mean, AAPL’s rally via the COMP’s influence on global markets, is spurring a worldwide relief rally in stocks!
But will it be a case of live by the Apple, die by the Apple?
Amazon (AMZN) is also a major chunk of change in terms of COMP weighting, and it too has traded solidly since June 16 (up around 16%), but the other majors are notably lagging. I’m talking Microsoft (MSFT), Alphabet (GOOGL), and Tesla (TSLA) here.
AAPL’s July 18-19 supply candle/demand candle “flip” is an outlier in terms of what you’d expect to see. As in, it’s relatively rare. It’s especially bullish because it occurred at the top of a supply zone (the red zone highlighted on the chart).
If AAPL can successfully dispense with the long-term trend ribbon (orange-zone), the next target supply point is the May 4 high of 166.48.
View: Neutral, bullish after a close above the long-term trend ribbon, bearish after a close below the short-term trend ribbon.
S&P ASX200 (XJO): Don’t mind if I do, (thank you global relief rally)
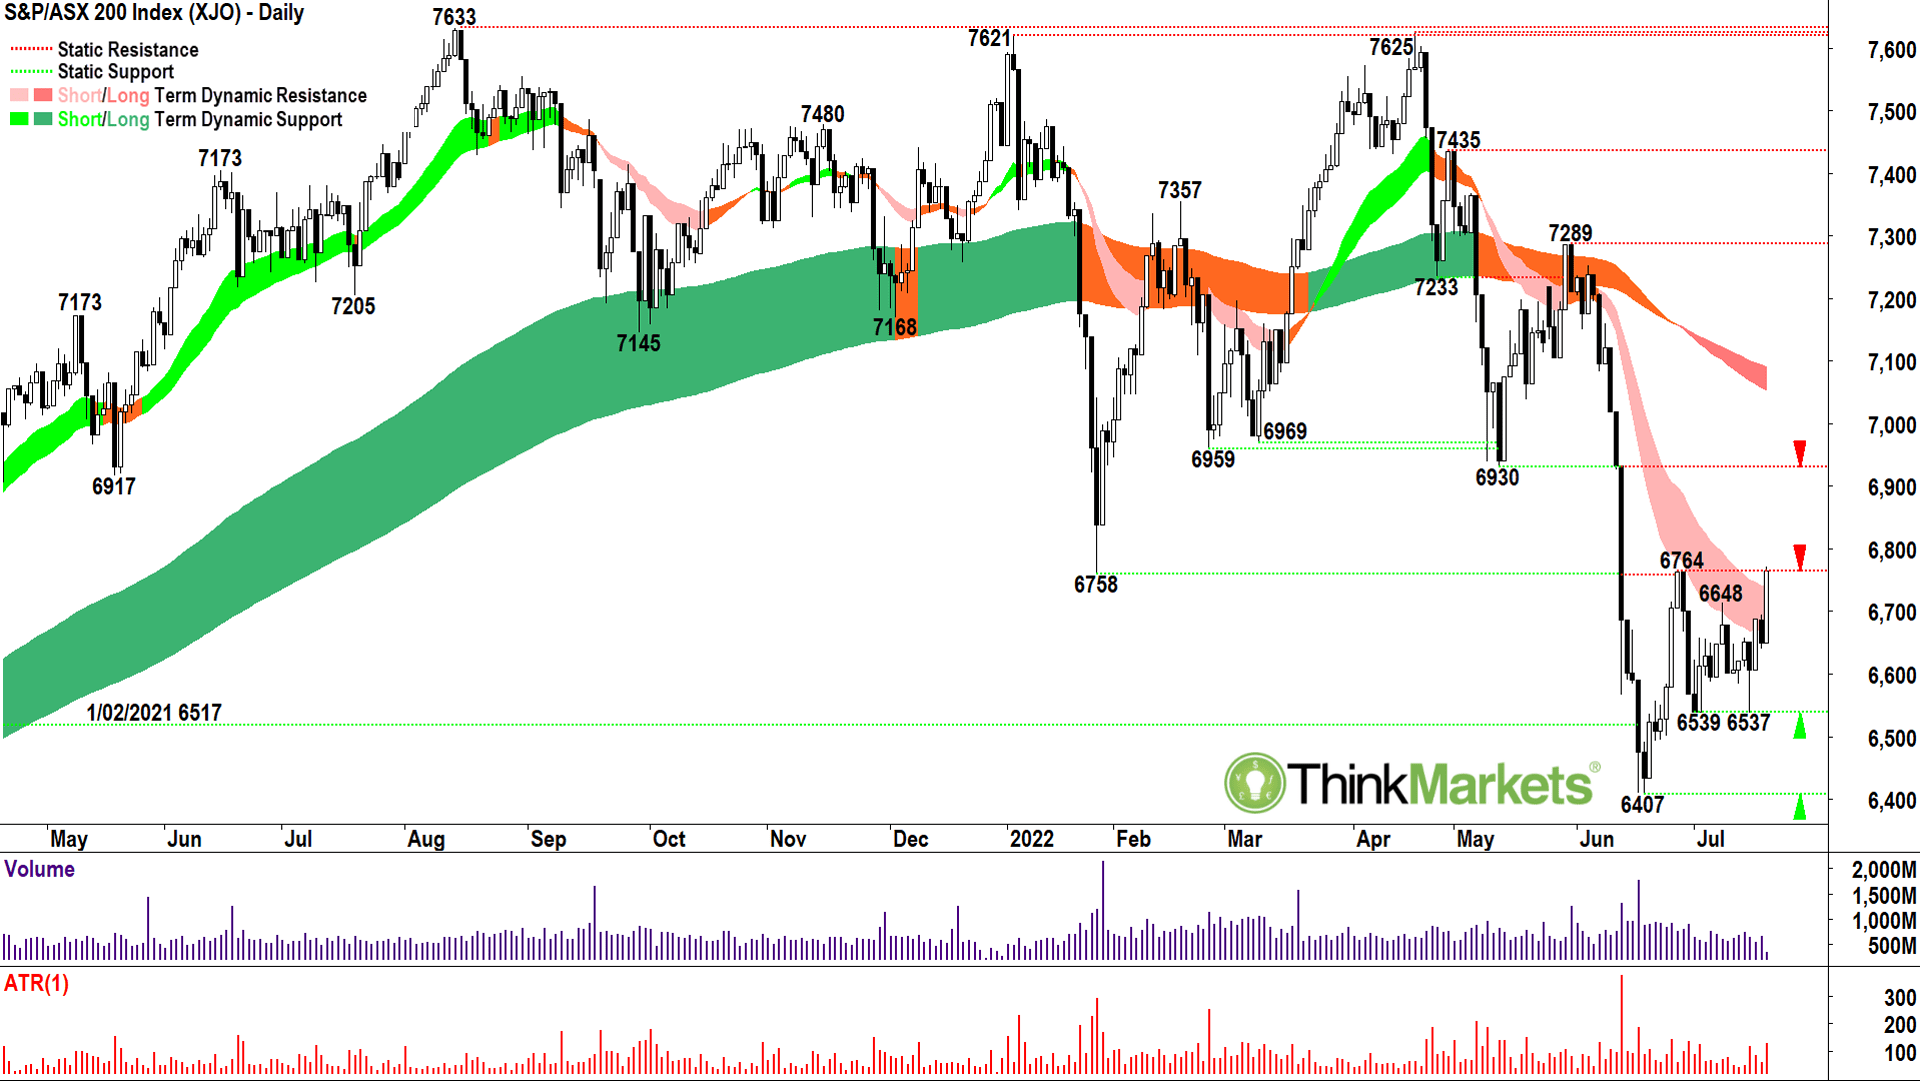
Bringing it back home, let’s take a quick look at how our local XJO is faring. Not too bad it seems! Thanks Apple!
As I write this, today’s candle July 20 is live.
Assuming it closes above 6764 it would have dispensed with two substantial supply barriers – one of those being the pesky short-term downtrend ribbon! Price action on the XJO is slightly more neutral than say, the COMP, as 6537 just pipped lower than 6539 to leave us with lower troughs. It’s a minor issue, and assuming the July 20 candle remains a demand-side behemoth eclipsing both of those key supply zones, it more than makes up for it.
Volume indicates little desire from the supply side to get in the way. A continued supply vacuum would facilitate a look at 6930. The supply might be more willing to feed the frenzy there. As a result, I will be watching closely for supply-side candles (i.e., long black bodies and or long upper shadows) on a volume influx around 6930. It looks like the long-term trend ribbon is also going to be lurking around that level depending on timing of a continued rally.
Until then, I’m going to play it safe and flip the bias back to Neutral and await further clues the bear market low is indeed in! This bias also facilitates dripping a little more cash back into the market on valid individual stock plays (see below!).
View: Neutral, bullish after a close above the long-term trend ribbon, bearish after a close below the short-term trend ribbon.
Intermission
And now we bring a you a bear fight from the Werner Herzog classic:
Now, for your sheer charting pleasure…
Carl Presents:
Two Charts I Have Loved
Welcome back. Here’s two quick charts which build on this idea of appropriately dealing with the long-term trend ribbon.
The first is Audinate Group (ASX:AD8), a follow up from this analysis , and an addition which just came up on the radar for long-term trend ribbon reversals, Wisetech Global (ASC:WTC).
Audinate Group (AD8)
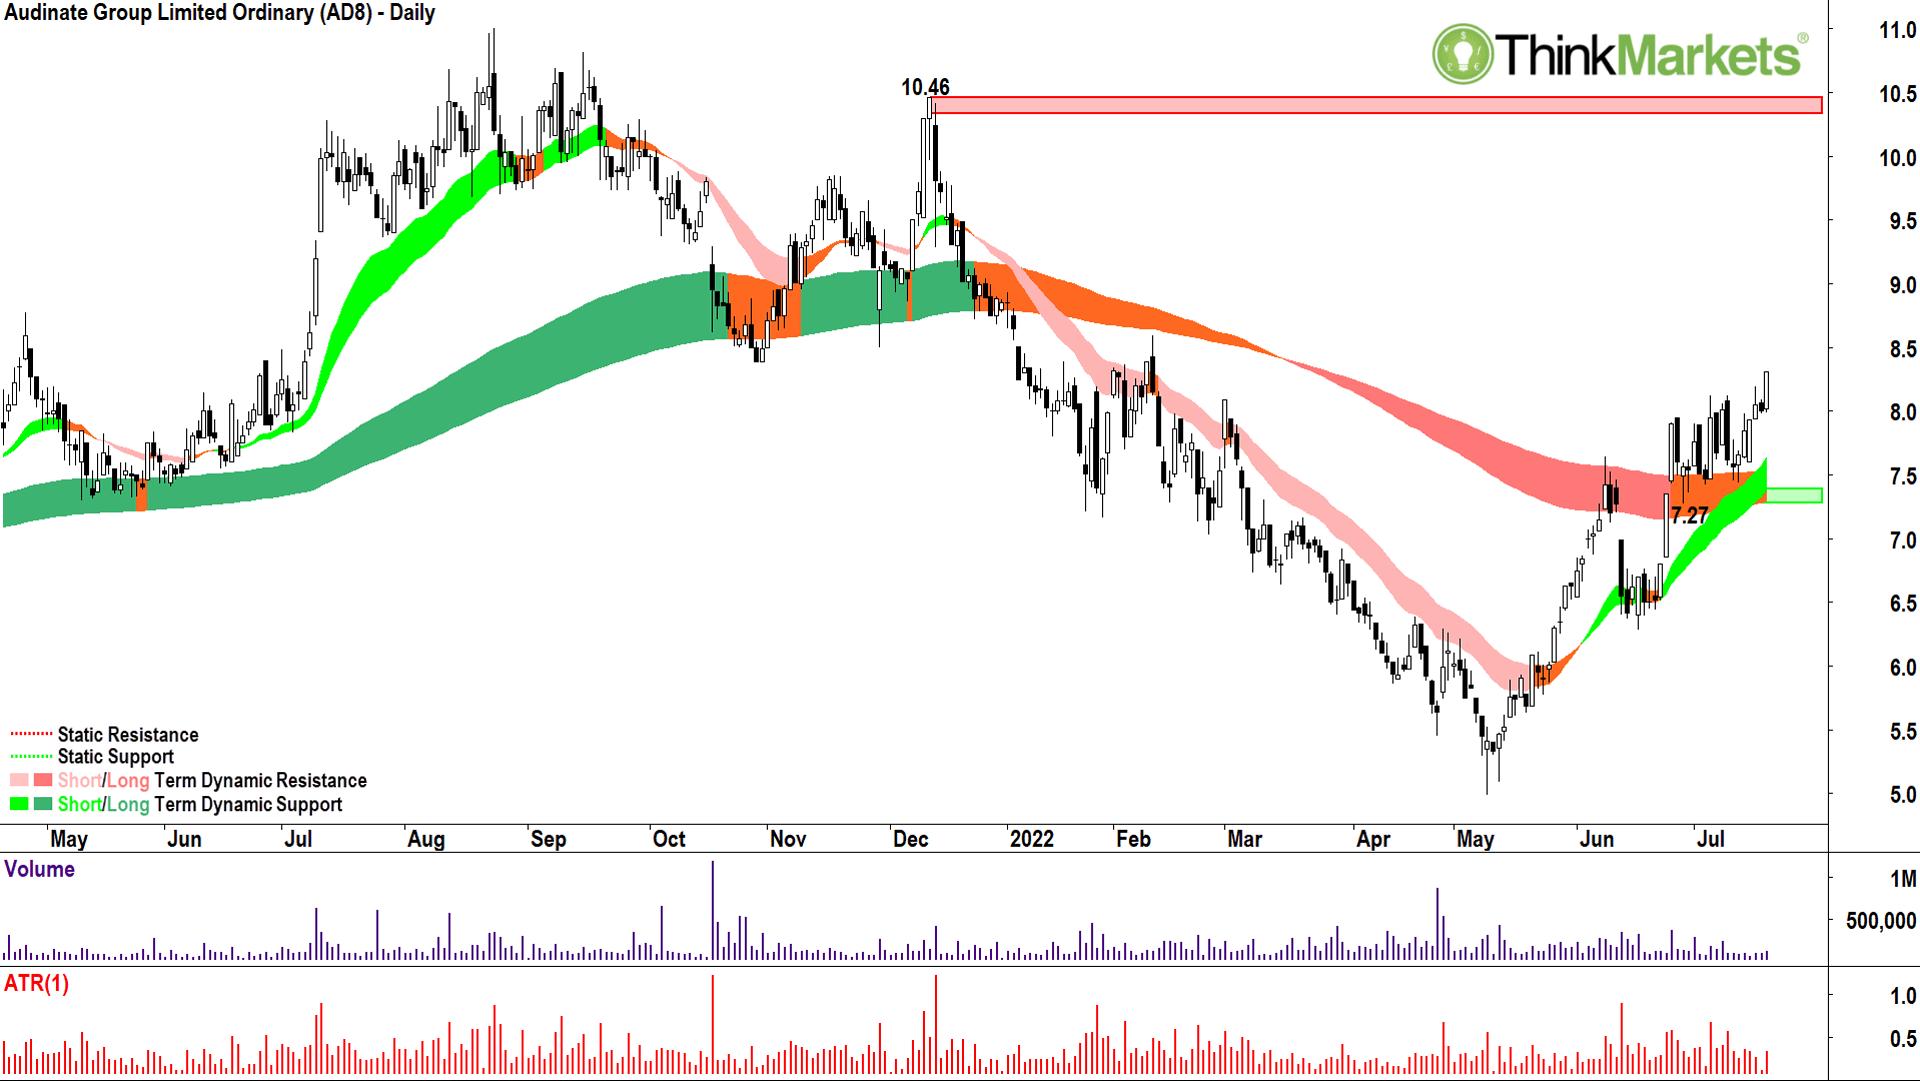
AD8 is a textbook case study for how a stock must deal with the long-term downtrend ribbon after a bear phase.
It is a process of testing, holding, and pushing off as the long-term downtrend ribbon transforms from an area of dynamic resistance to an area of dynamic support.
Obviously, before you get to the long-term downtrend ribbon, you need to deal with its short-term little buddy. You need to get above it, turn it, and then use it as support. Check, check, check.
Supply-side candles should switch demand-side candles, and price action should switch from lower peaks and lower troughs to higher peaks and higher troughs. Check, check.
Looking at the recent price action, AD8 is now using the long-term trend ribbon as dynamic support (note the transition from dynamic support at the June 8 high at 7.65). Clearly, $8 was a bit of an issue, perhaps a result of residual supply from the 28 October 2021 swing low at $8.39 and the February 10 high of $8.60.
But it appears the persistent supply around in this zone has given way in the face of some motivated demand (strong demand-side candles). As is often the case, the supply-side is content to wait for better prices when a decent rally is afoot (look at the lack of volume signalling demand is impacting a supply vacuum).
Candles since the last trough on July 13 are excellent, and the price action remains higher peaks and higher troughs despite the compression around $8. After that minor supply point at $8.60 officially goes, there is little holding this one back until the next major supply point at $10.46.
In terms of demand, I’d expect the work done between $7.44-$8.13 during that last consolidation phase pegs this area as a solid demand zone moving forward. This area is also bolstered by the short-term uptrend ribbon which is now offering dynamic support.
I expect dips into this zone will continue to be bought into.
View: Bullish, buy pullbacks until a close below the June 29 trough low of $7.27.
Wisetech Global (WTC)
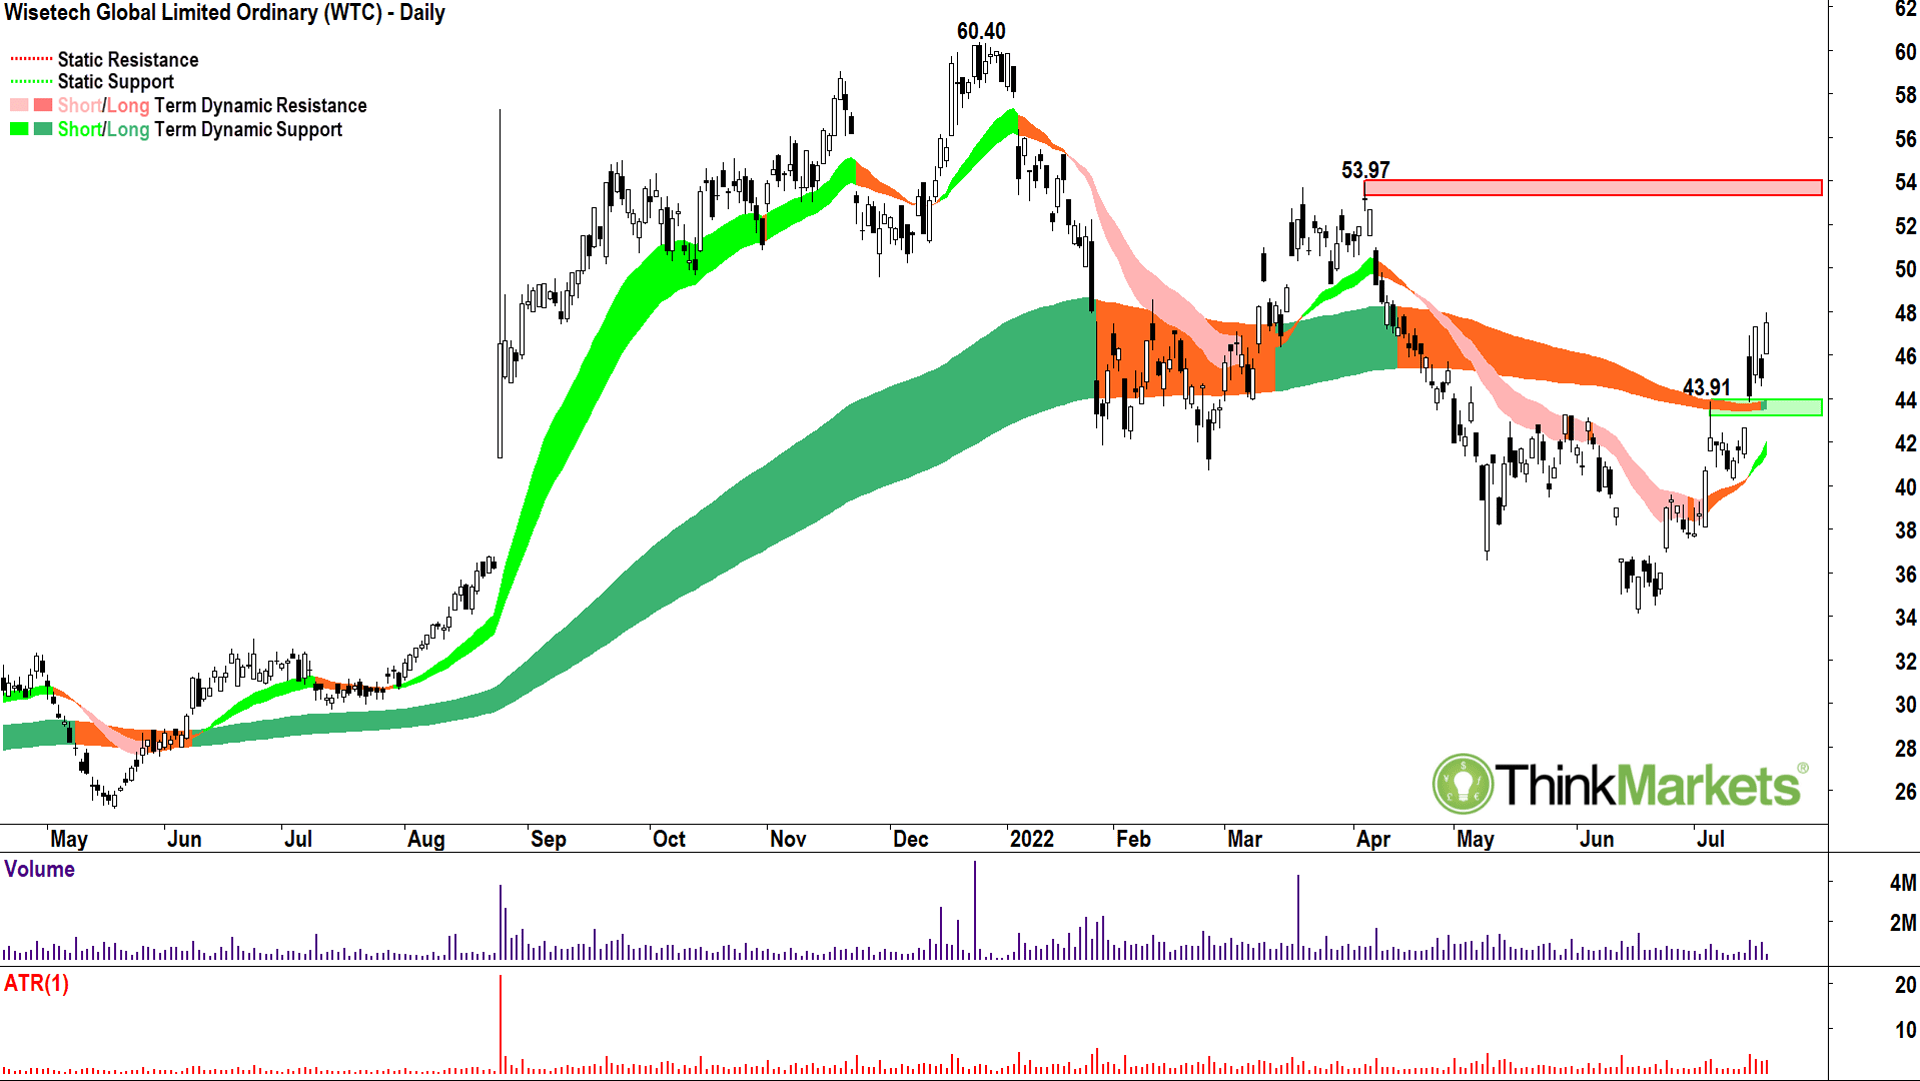
If anything, WTC has had an easier transition back to uptrend than AD8. That long-term trend ribbon didn’t appear to offer a great deal of dynamic resistance – just a minor peak logged at $43.91 demonstrating only scant conviction among the bears.
Importantly, the price action returned strongly from there. Candles are clearly skewed towards the demand-side and peaks and troughs are clearly skewed to the upside. Even better, each new trough held above its second from last peak. This phenomenon indicates healthy buy the dip/accumulation intent from by the demand-side.
Perhaps the next supply point is a little closer than for AD8, but I feel there’s a high probability of getting there ($53.97). Demand should persist around the July 6 peak of $43.91, but really until the short-term uptrend ribbon which should now offer dynamic support.
View: Bullish, buy pullbacks until a close below the short-term uptrend ribbon at $41.40.
Carl says…

Candle-out: see you next week!
The views, information, or opinions expressed in the interviews in this article are solely those of the interviewees and do not represent the views of Stockhead. Stockhead does not provide, endorse or otherwise assume responsibility for any financial product advice contained in this article.
Related Stories


UNLOCK INSIGHTS
Discover the untold stories of emerging ASX stocks.
Daily news and expert analysis, it's free to subscribe.
By proceeding, you confirm you understand that we handle personal information in accordance with our Privacy Policy.


