The Candlestick: The Top 5 NASDAQ stocks to buy right now according to Carl’s ‘sticks

Picture: Getty Images
Carl Capolingua thinks markets at ThinkMarkets. He is the writer, producer and star technical consultant for this magnificent series, now in its 17th season.
In The Candlestick, Carl journeys through some of the more unknowable iterations of global and local markets.
Come. Bring popcorn. And a slide rule.
Candlestick 17:
Groundhog Day for tech, or the dawning of the next big tech bull?
As I sit down to write this Edition of The Candlestick, I can see the hashtag #bullmarket trending on Twitter. Hmmm, this rally is getting serious!

Last time we chatted, I noted the unprecedentedness of 2022 with respect to its wild market gyrations (there was so much unprecedentedness I was forced to italicise the word). As far as a bunch of stuff going down all at once, 2022 was quite simply the Worst…Year…Ever. So, surely then, all this rash chatter about a #bullmarket is premature?
January was good. Real good. But perhaps the bulls have run their race for 2023?
I will investigate this below, as well as try to find a few potential gems in a sector which was perhaps the worst of the worst in 2022. I am of course referring to Tech.
I know, blah, Tech is so 2021. You have your lithium and copper stocks now. Well, my charts suggest it’s worth running a cautious but optimistic eye over this beaten down sector. It could be the next big thing… Um, again.
Yes, Bill Murray fans, I noticed it too.
Trending just below #bullmarket is Groundhog Day. All it takes is 24 hours and a bit of Fed chatter to see the world upside down and back to front. Ahhh the sweet, sweet irony!
Is the current rally in global stocks just another bear market rally? Will we wake up tomorrow and have to go through another 2022 fully of panicked selloffs and false dawns? Punxsutawney Phil says…
To the candlesticks we go!
Groundhog Play
This is the perfect place to start.
It brings together in one picture the answer to the two key questions I postulate in today’s Candlestick: 1. Is this the start of the next bull market or just another bear market rally? And: 2. Is now a good time to get back into Tech stocks?
NASDAQ Composite Index (COMP)

In the last iteration of Candlestick, I said that to officially end the bear market in US stocks, the COMP must close above, and then hold above the long-term trend ribbon.
This implied a move back to at least 11,500, but more likely to 12,000. Fast forward exactly one month, and the COMP has staged a super impressive rally.
It sits at 12,113 after peaking a few sessions ago at 12,270.
Even better, it sits atop a run of higher peaks and higher troughs, and a run of demand-side candles outnumbering supply-side candles by about 4 to 1. A couple of definitions here to illustrate why this is all good stuff.
Peaks represent excess supply.
When you think about it, they kind of have to. After all, you can only get higher peaks if there’s enough demand in the system to more than soak up the supply at each last supply point. It tells us supply is running away, and that’s a bullish sign.
Troughs represent excess demand, yep, they kind of have to. Higher troughs mean excess demand is building. So, putting the two together, we have building demand and receding supply. These are the basic ingredients of any bull market.
The demand side candles are the ones with white bodies (i.e., the box part of a candle) and/or lower shadows (i.e., the lines protruding top and bottom from the box).
You only get demand-side candles if demand is aggressive and consistent through the trading session to cause the price to close at or near the high.
So, the recent rally in the COMP possesses some pretty good credentials for it not to be just another bear market rally.
BUT! I know you were just waiting for the but! Groundhog Day is a real possibility also. Look at the last two interactions with the long-term downtrend ribbon (it’s the thick downward sloping ribbon alternating between dark pink and orange) in March and August 2022, and pretty much in December as well.
That ribbon has been an absolute Terminator of the last three fledgling rallies.
Certainly, the first two hit with some force, and with similar price action and candles to the current attempt.
So, why should this time be any different? It doesn’t have to be. As in, there’s every chance we do find some supply around here-and-up-to-say 12,656. This supply would manifest itself as supply-side candles (black bodies and/or upward pointing shadows), and/or lower peaks and lower troughs. If this occurs, you can forget about the COMP for a while again.
But the evidence is beginning to build for the “this time is different” theory. This time, we’ve broken above the long-term downtrend ribbon, come back, tested it, and bounced off it. For the first time in this bear market the long-term uptrend ribbon is acting as dynamic support.
This is kind of a big deal – it is exactly how long-term downtrends transition to long-term uptrends.
Further, my gut says this time we’ve hit the ribbon with just too many good candles, and from a solid base of support provided by the trading range between 10088 and 11614.
Basically, I feel if you really wanted to be out of your COMP stocks, you would have done it during all the negativity and uncertainty between October and December. It means everyone left over is hanging on for a rally, and everyone who is out is in painful, painful cash as prices are edging back up. If that cash gets put back to work, we’re going to turn this bear into a bull very quickly.
I’m happy to add some risk to COMP stocks, indeed, I’ve been purchasing a few for my own portfolio over the last few weeks. I’ll add more if the new bull is confirmed by a consolidation above the long-term trend ribbon – which has changed to amber as part of my traffic light system. Then, I’ll add some more risk again if that amber turns to green.
(Ed. If you’re interested in learning more about investing in COMP stocks, Capo’s running a few dedicated live market analysis sessions specifically on US stocks over the next few weeks. Find him on Twitter for more on the when and how.)
View: Bullish, happy to keep adding risk while the COMP continues to close above 11,388.
Top 5  charts to buy right now
Yep. In keeping with the theme, here are my Top 5 NASDAQ stocks based upon my technical analysis of the entire
COMP constituent list, in alphabetical order.
Baker Hughes Company (BKR)
Baker Hughes is no startup with a cool, catchy name missing a bunch of vowels. It’s a A$50-odd billion energy technology services company which as been around for over 100 years. As with each of the picks I have for you today, further investigation into a selection is left for your homework – I just like the chart!
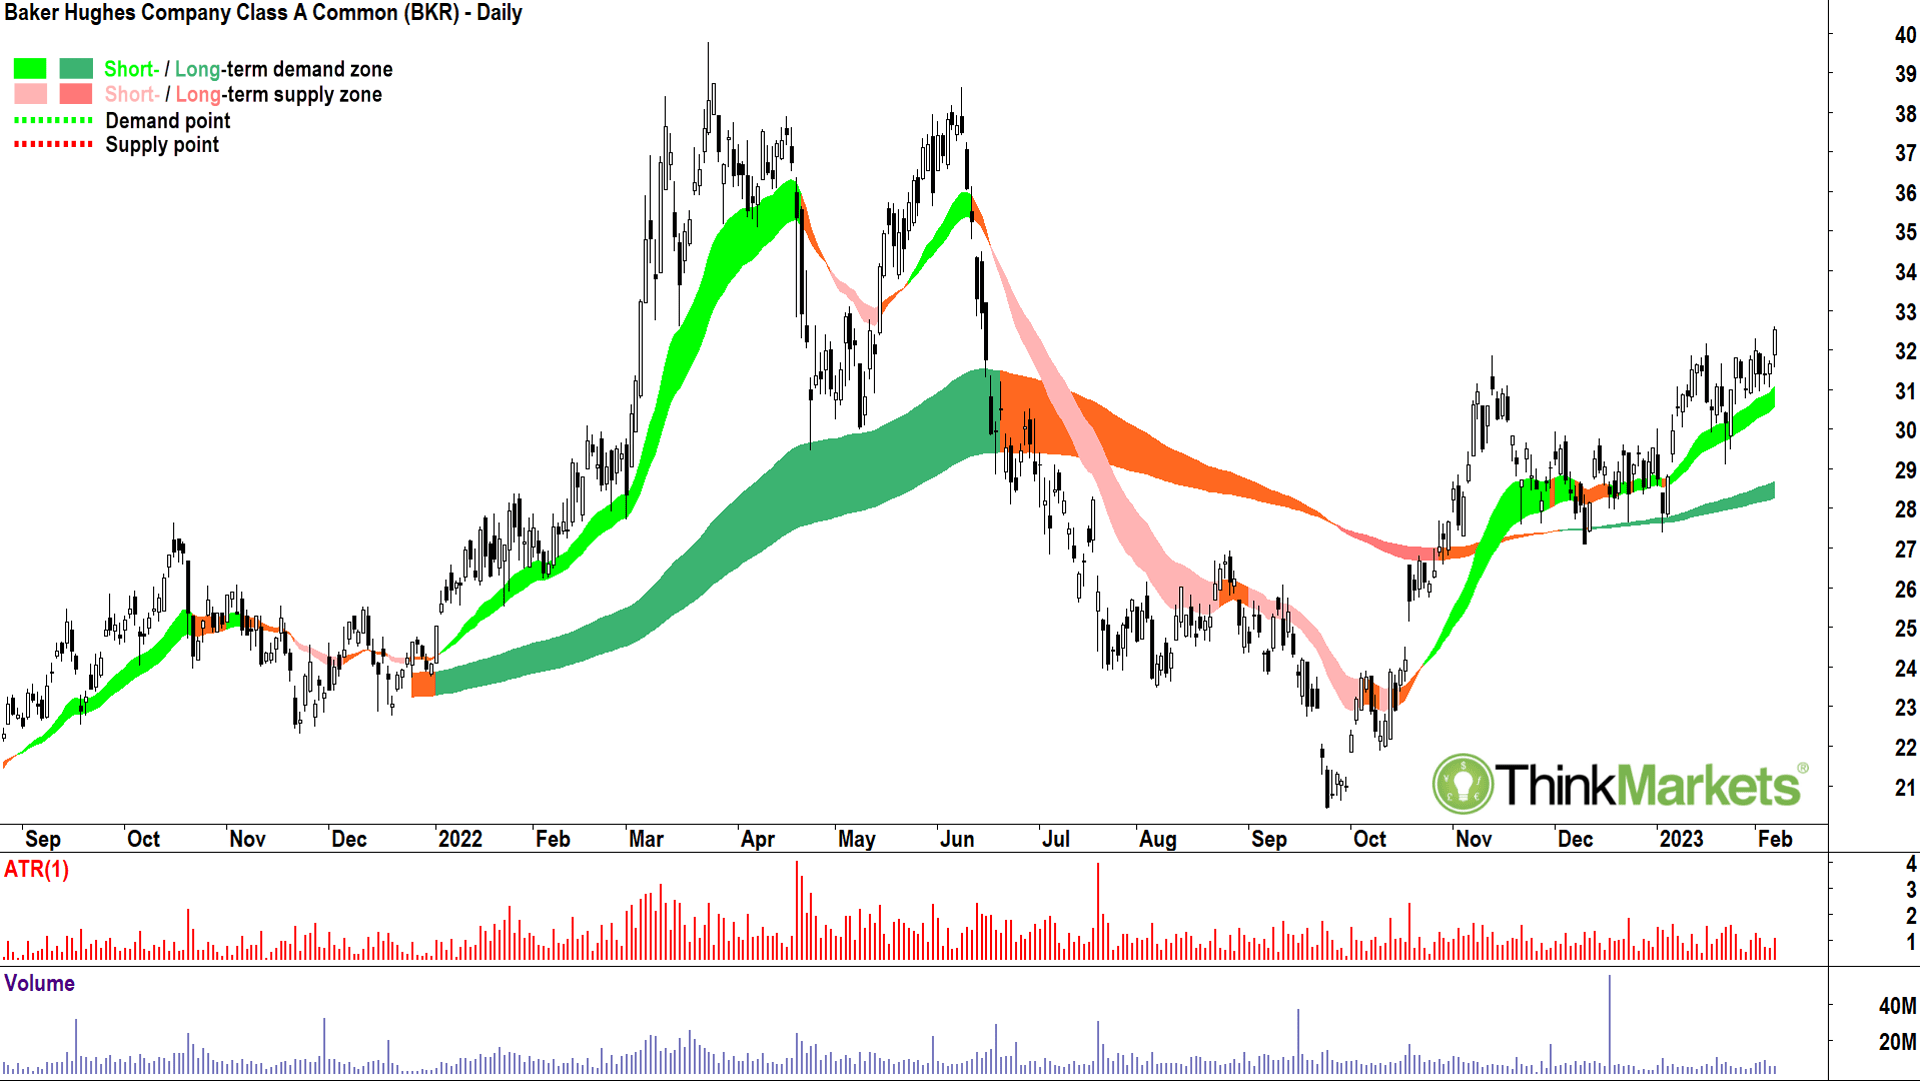
And there’s plenty to like here.
Since the September low and subsequent steep rally, BKR has consolidated in a tight and well-defined range between $27-$32. Consolidations are necessary and logical reactions to sharp advances in price. The human brain automatically believes an asset which has rapidly increased in price has become expensive. The natural instinct is to sell, and this creates supply. Supply meets the immense demand already in the system and prices stagnate.
Eventually, if the selling is finite, it dissipates, and only the prevailing demand remains. A great hint demand is regaining control of price is a compression towards the top of the consolidation range. Check. White candles also indicate building pent up demand. Check. It’s usually a good time to get involved when the price closes above the top of the consolidation range, signaling demand is back in control.
Note also the current breakout has occurred in what is developing as a robust long-term uptrend (dark green trend ribbon).
View: Bullish until a close below the 24 January low of $29.11.
IDEXX Laboratories Inc IDXX
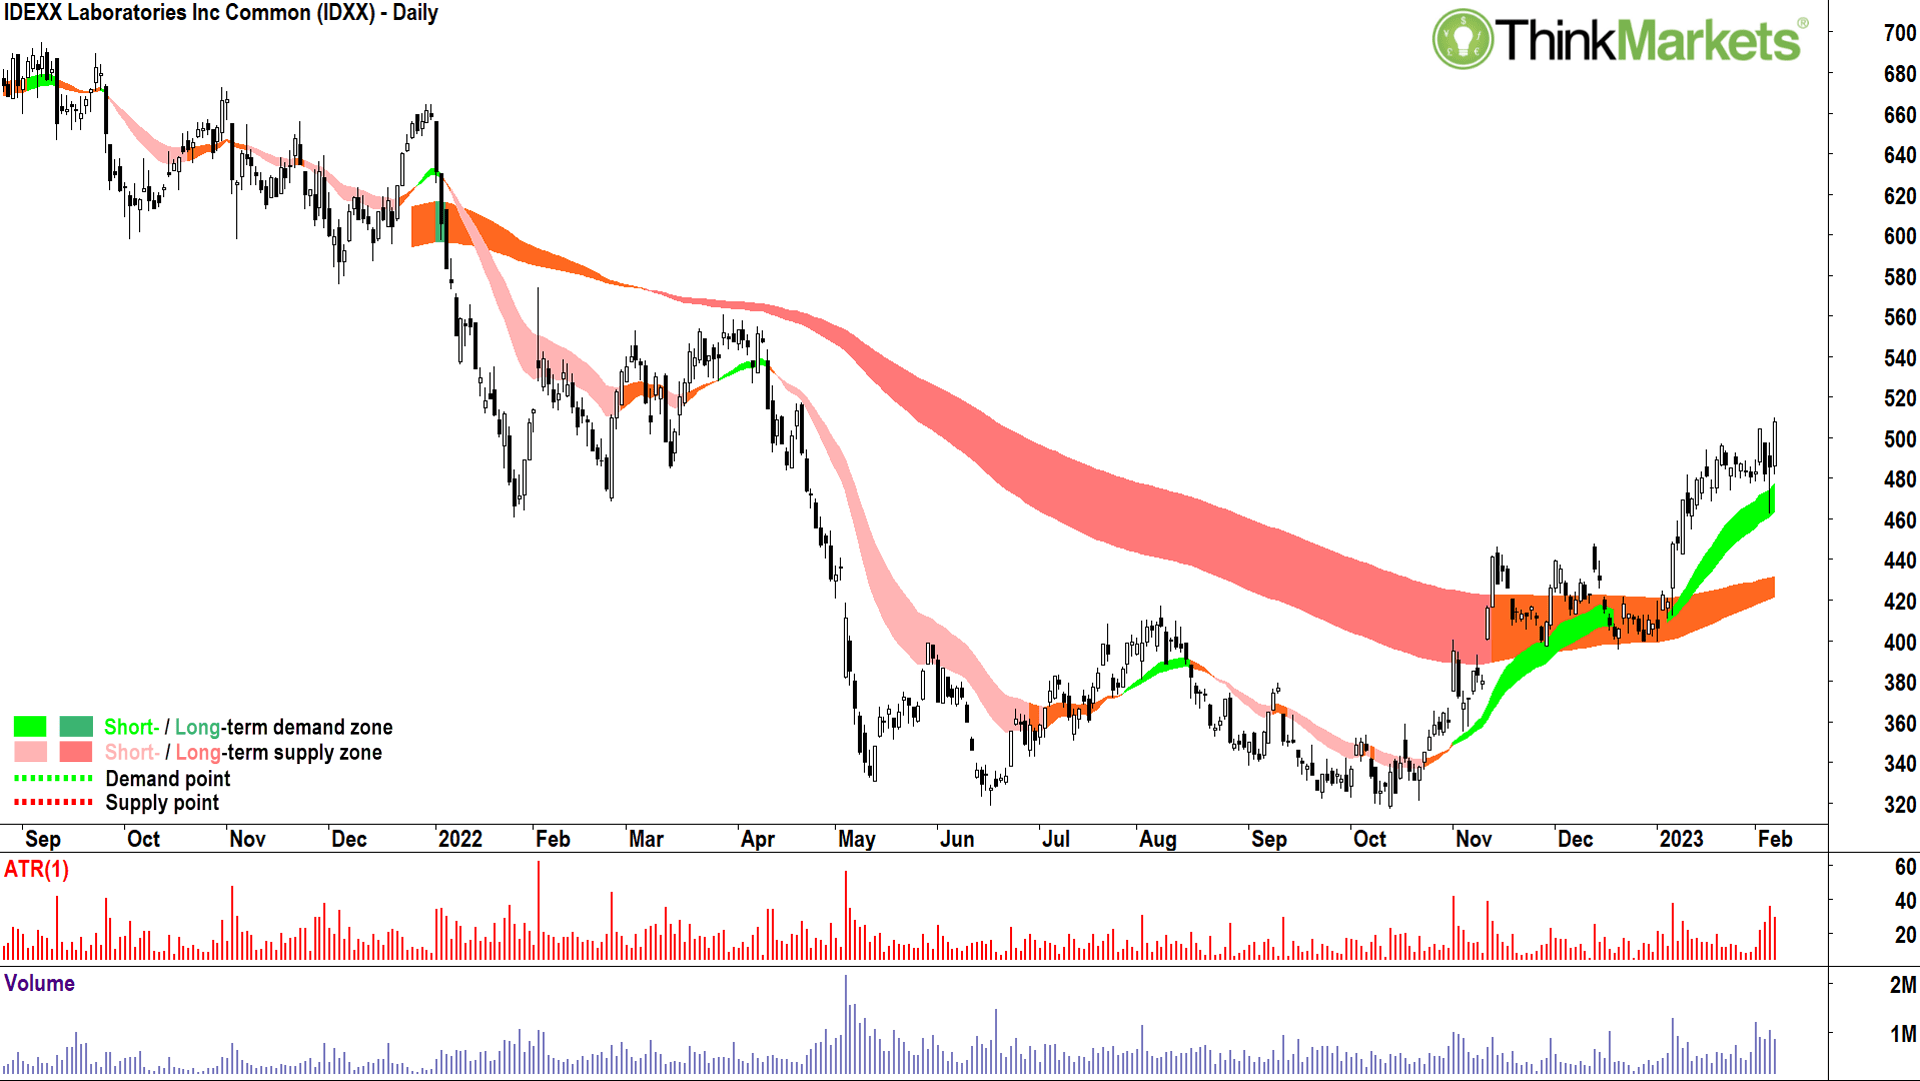
IDEXX Labs is a global vet science juggernaut.
If it was listed on the ASX, it would be in the Top 10 ahead of Wesfarmers. With respect to US companies, it’s presently 199. See why you might want to pry even just one eye away from the ASX?
This is another turnaround setup (as opposed to the bottom-left-top right setup on ULTA below). Again, I note the solid consolidation zone between $395-$450 in November and December, and a shorter period between $460-$500 through January. Each demonstrates demand remains in excess of supply.
The two-candle demand pattern from 6-7 February with the long lower shadow on the 6th followed by the long white-body on the 7th is particularly bullish. The short-term trend is well established, and judging by the 6 February low, it is dutifully supporting price. The long-term trend ribbon remains amber, but it is moving closer to a transition back to up/green.
The 7 February close above $500 should prove to be decisive for a move towards $560 in the first instance, but upon clearing the potential supply zone from the March 2022 peak, towards $660 in the medium term.
View: Bullish until a close below the 6 February low of $462.60.
NVIDIA Corp NVDA
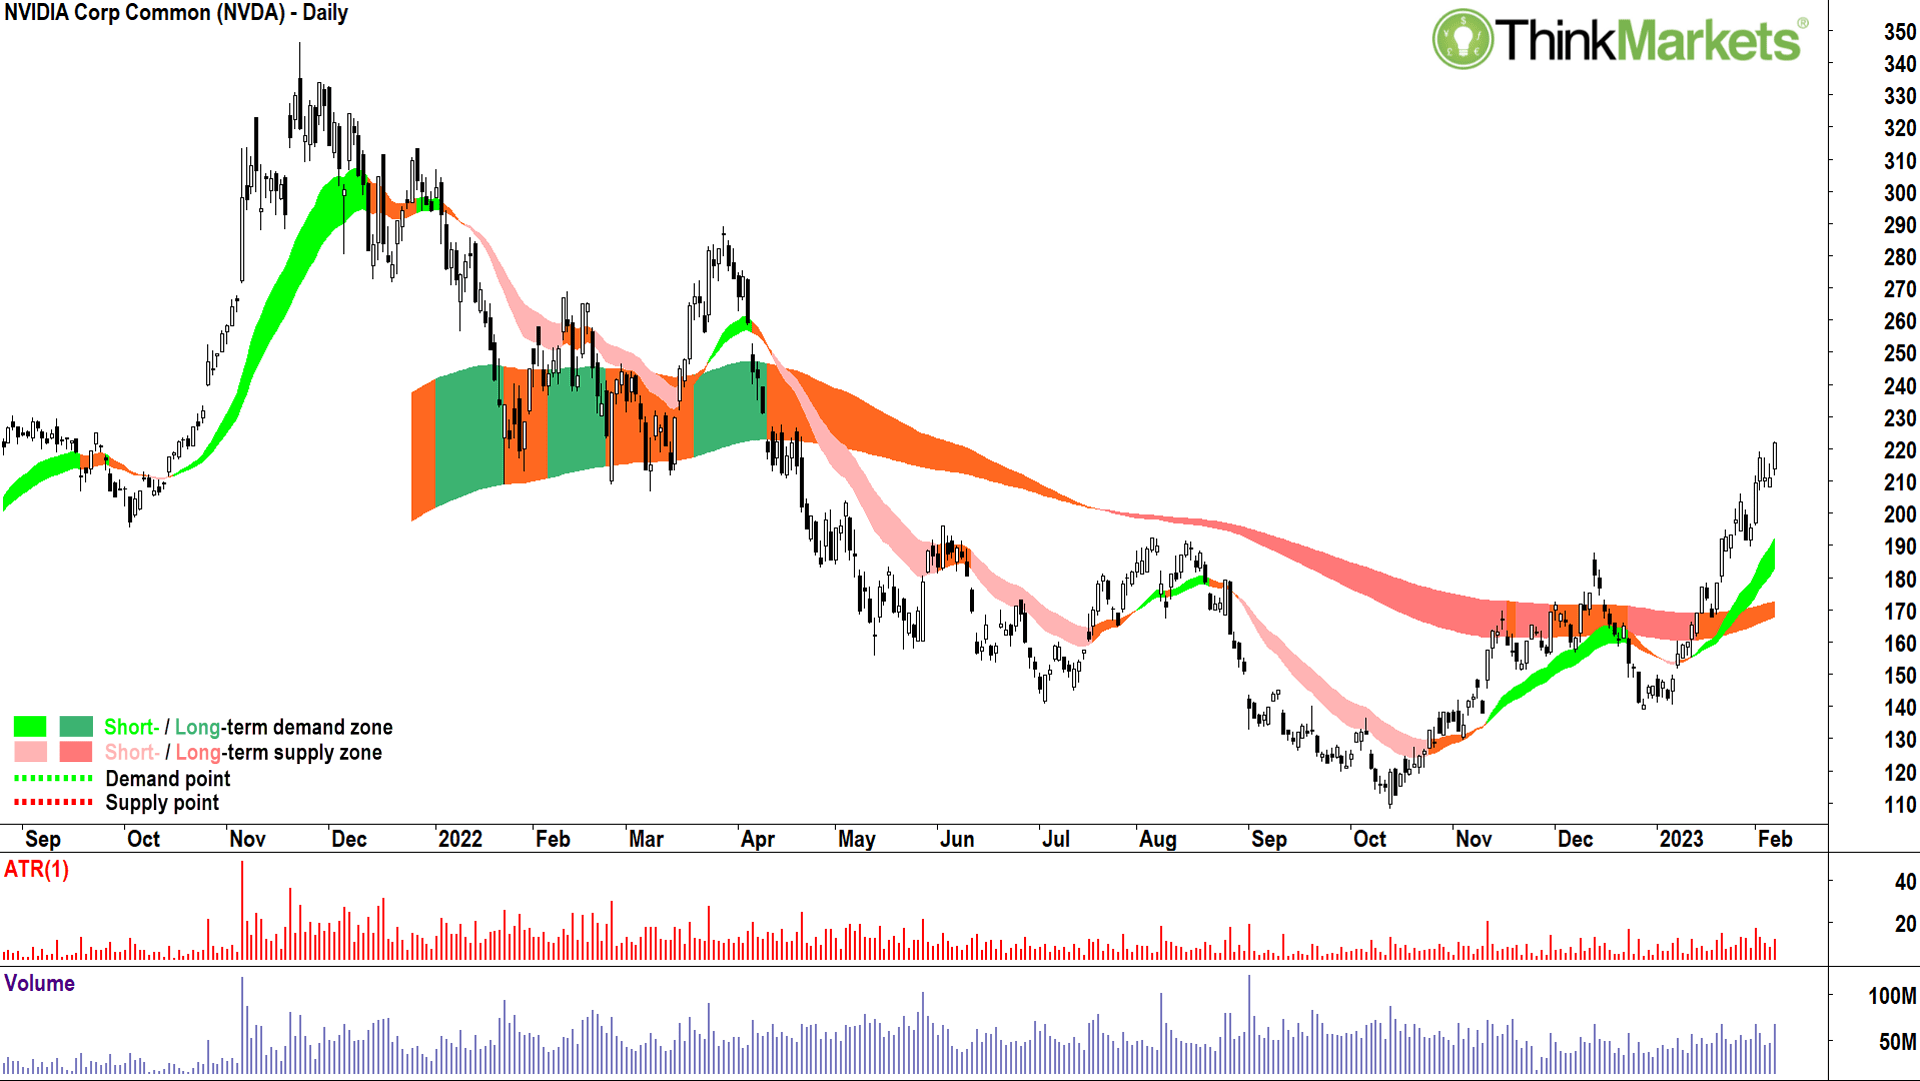
If you’re reading this on a PC, chances there is a NVIDIA graphics processing unit (GPU) allowing it to happen.
Is NVIDIA a big business? It’s a monster, as in three times the size of BHP in terms of market capitalisation!
The monster topped out at $346.47 a share on 22 November 2021. That’s no coincidence, it was the day Jerome Powell was reappointed as chairman of the Federal Reserve, and then in his acceptance speech, flipped from ultra-dove to ultra-hawk. The rest is history, as they say, and so was the prevailing bull market!
NVDA has doubled from its $108.13 bear market low, but it’s showing excellent short-term momentum to continue to move higher. The candles are almost exclusively of the demand-side variety, i.e., white bodied and or with lower shadows, and the price action is firmly set to higher peaks and higher troughs.
The short-term uptrend ribbon is well established, and the long-term trend ribbon has transitioned to amber and appears on track to further transition to official uptrend green. Ordinarily, I’d prefer to buy when the price is closer to my short-term uptrend ribbon, I use it as a kind of ‘value zone’. But in this case, the candles and price action are so strong, I’m happy to add some risk now knowing there could be a correction back to the short-term uptrend ribbon at some stage.
View: Bullish until a close below the 31 January low of $189.50.
Ulta Beauty Inc ULTA
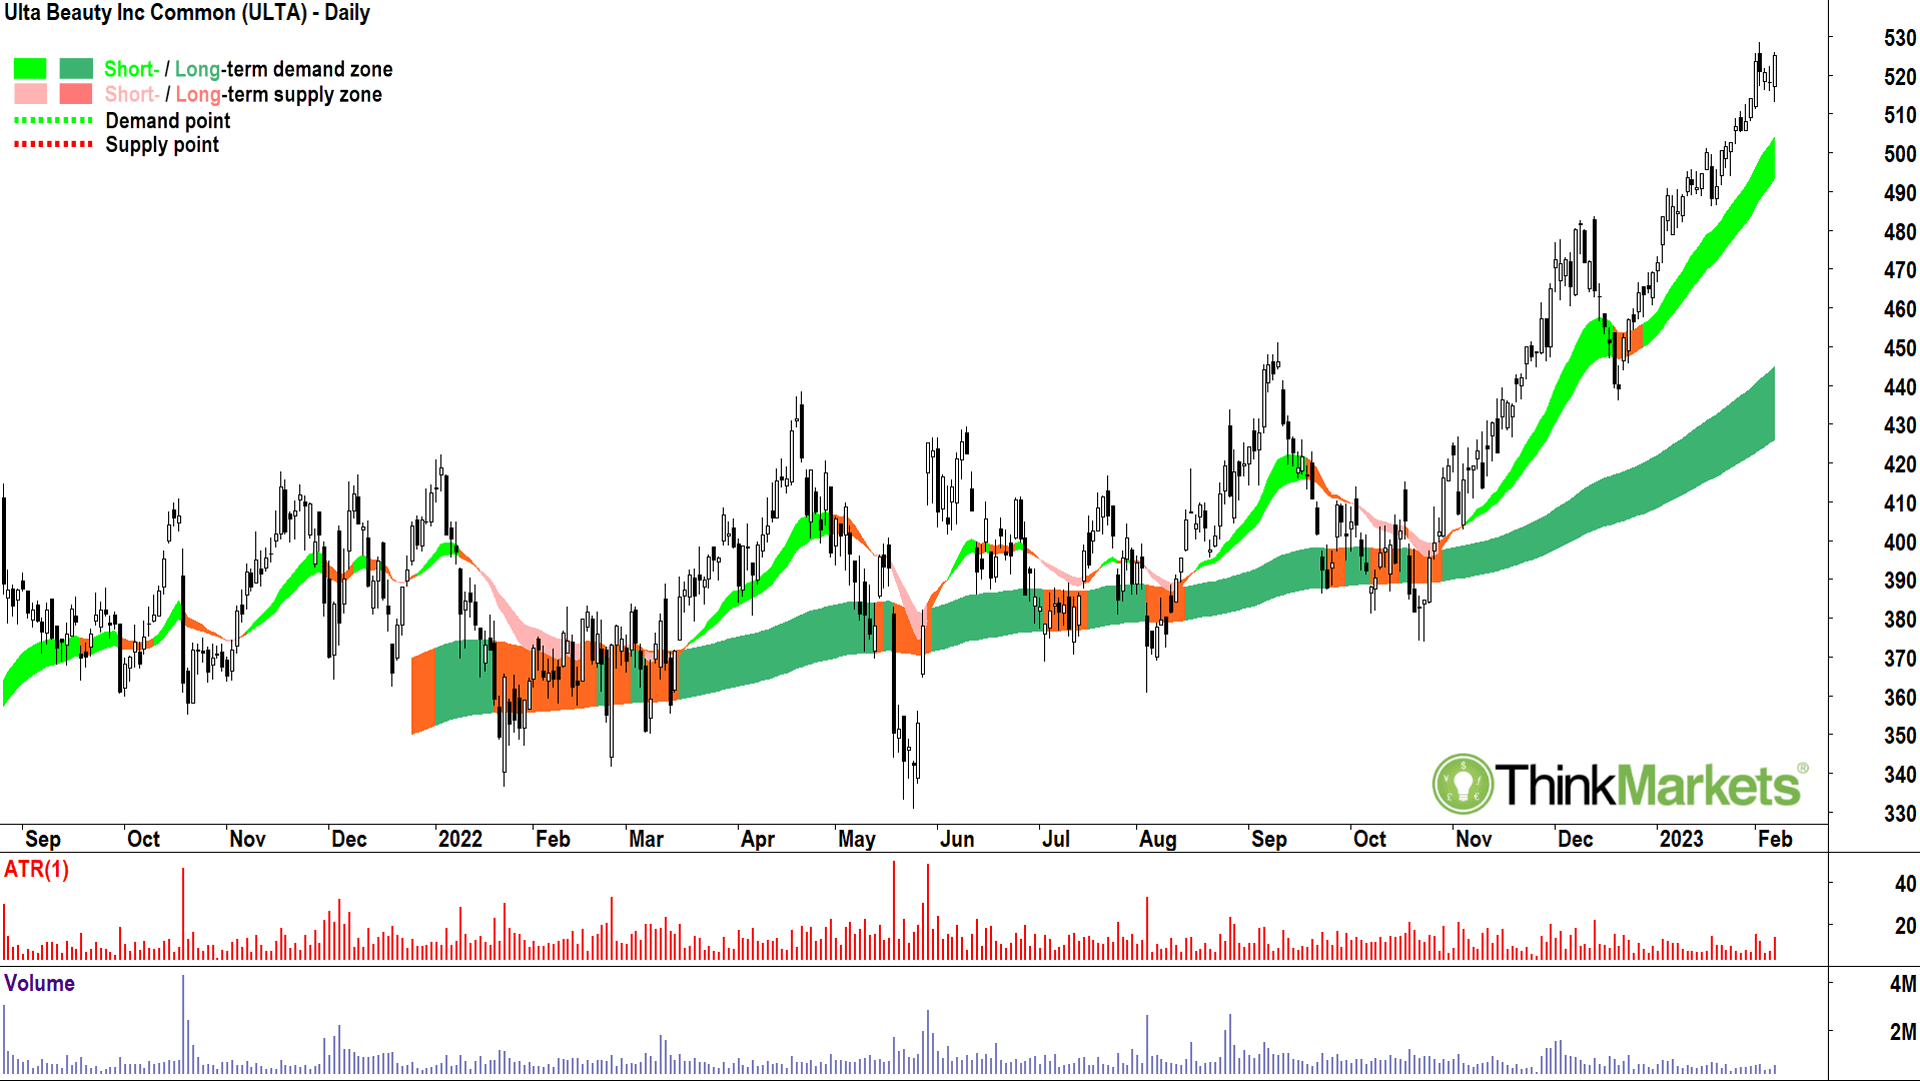
Looking at the chart of beauty salon chain operator and cosmetics manufacturer ULTA, it’s difficult to spot where the recession is. Zoom out from the chart below, you won’t even find the pandemic! Hey, a girl’s gotta look her best.
The ULTA chart is a fantastic example of my firm belief that: In any bear market, no matter how bad the economy or circumstances appear, there’s always a stock somewhere making the most of the situation and whose share price is going bottom-left-top-right.
This is the ultimate stairway to heaven chart – and I know it’s the one in this Top 5 you’ll likely find the toughest to make yourself buy. There’s always the fear that as soon as you do – that’s the top. I know, you’ve done it too many times before!
I can’t promise you this time will be different, but what I can promise you is that a chart like ULTA only occurs if there are investors willing to throw piles of cash at ever-increasing prices at those who already own the company’s shares. Further, those very ULTA shareholders are acutely reluctant to sell, and are only doing so if those higher prices are forthcoming.
So, why do the investors with cash keep throwing their hard-earned money at ULTA? Because they think it’s too cheap. They believe it’s going to be much higher in the future. And why don’t existing shareholders in ULTA want to sell? Same reason, why would you sell something you know is still too cheap, and therefore is still going up? You wouldn’t.
So, those with cash think ULTA is cheap. Those with ULTA shares think ULTA is cheap. It looks like you’re the only one who thinks it’s expensive!
View: Bullish until a close below the 19 January low of $486.02.
Workday Inc WDAY
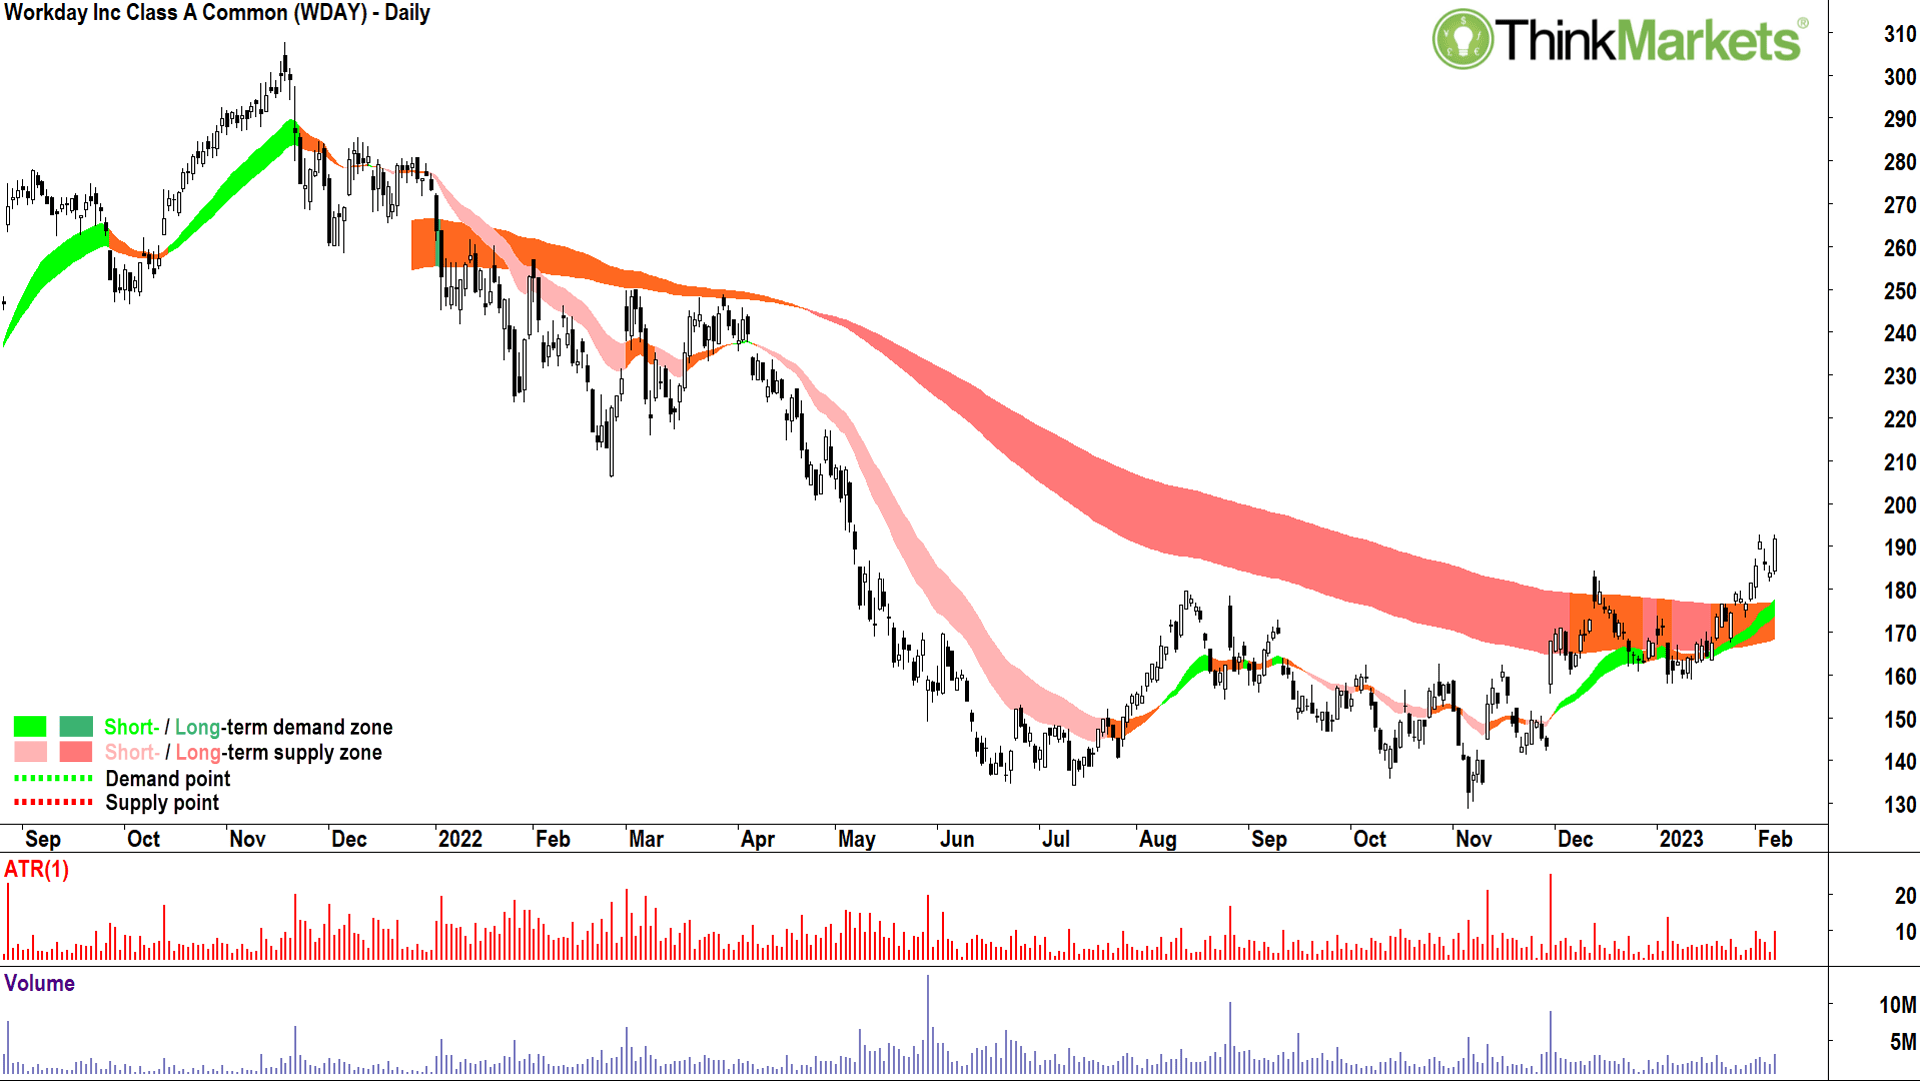
Workday provides over 10,000 companies all over the world with human resources software to help them manage their employees’ journey from hire to retire (or fire!). Chances are your employer uses it, hey – I just like their chart.
This is another turnaround style of setup. Again, we can observe a well-established period of basing after the November recovery. Rather than crumble back down to its lows as it did after the August rally, WDAY has forged higher.
Supply is dissipating, demand is building, and prices are moving higher. Importantly, the long-term trend ribbon has switched from an area which was offering dynamic resistance, to one offering dynamic support. It is this transition which is pivotal in signaling a new long-term uptrend has begun.
It’s still early stages in the new long-term uptrend, but the short-term uptrend ribbon is growing in stature, and the price action and candles clearly demonstrate excess demand is again building. The 6-7 February test and hold of the 13 December peak is also reassuring.
I can’t see a great deal holding WDAY back until previous points of supply around $250.
View: Bullish until a close below the 30 January low of $173.29.
Happy hunting!
Carl Capolingua.
The views, information, or opinions expressed in the interviews in this article are solely those of the interviewees and do not represent the views of Stockhead. Stockhead does not provide, endorse or otherwise assume responsibility for any financial product advice contained in this article.
Related Stories


UNLOCK INSIGHTS
Discover the untold stories of emerging ASX stocks.
Daily news and expert analysis, it's free to subscribe.
By proceeding, you confirm you understand that we handle personal information in accordance with our Privacy Policy.


