The Candlestick: If it looks like a honeytrap… it’s probably just another bear market rally

Via Getty
Carl Capolingua is Australia’s leading technical analyst. The other ones are just doing zombie-math.
Carl works by candlelight at ThinkMarkets and lives with the little candelabrums in the western state that does what it wants, where they admire his unique brand of price action-based naked trend tracking.
Capo has been honing this art over some 30 years of investing, advising, and managing funds.
Every week in The Candlestick, Capo plots the unknowable iterations of markets global, local and the very stocks within them.
He is Carl.

The Candlestick – Eighth iteration – Investing in falsetto
On one of my trips to pick up the little candelabrums from school this week, an old but formerly edgy classic started up on Capo-radio (The Greatest Hits of the 80s, 80s and 80s) one which I felt perfectly summated the current market conditions.
Clearly written about his experiences investing in bear markets, Lenny ‘cat dad’ Kravitz painfully laments in …
“So many tears I’ve cried,
So much pain inside,
But baby, it ain’t over till it’s over…”
Okay, maybe one from the 90s…
The point here though is if one were to replace every instance of “baby” in that song with “bear market”, and “our love” with “my portfolio”, Lenny’s other big hit actually serves as a cautionary tale in falsetto for how not to trade in bear markets.
The gist of it would be, if you are going to fall in love with your stocks, then no amount of appealing to the market gods is going to save you when a bull turns into a bear – and yes, you should indeed be prepared for plenty of “tears” and “pain” because as far as bear markets are concerned… “it ain’t over till it’s over”.
Bear market rallies can be very convincing.
The rally on the Nasdaq Composite (COMP) in March this year is a good example.
Its 16.7% snap back from the February lows in just 11 trading sessions was the 15th largest COMP bear market rally on record.
The 2000-2002 bear market, more commonly known as the Dot-com Crash, had nine rallies even bigger than March’s effort!
Logically, eight of those failed. This means eight times over that withering 31-month decline investors got their hopes up, piled in their cash, and strapped themselves in for new highs… only to see the market sink again and make a new low.
How many investors gave up and sold out at that next low, or the next, as they compiled loss after loss?
The candlesticks, along with several other key technical indicators, will help us predict with far greater accuracy if a particular rally is “the one”.
But we must be patient and let them do their work. Right now, the longer-term trends remain down.
So as tempted you might be by every bullish candle which pops up between now and when those longer-term trends eventually change, I still believe the best course of action is to remain cautious.
Still, even in the worst of bear markets there are stocks with business models that are absolutely killing it, and I’ll try to highlight a couple of those in this edition as well, but for the most part, we should be either sitting in cash, or looking for short selling opportunities. I’ll pose a couple of those today too.
Let’s look at some charts!
S&P500 (SPX): Are you gonna go my way?
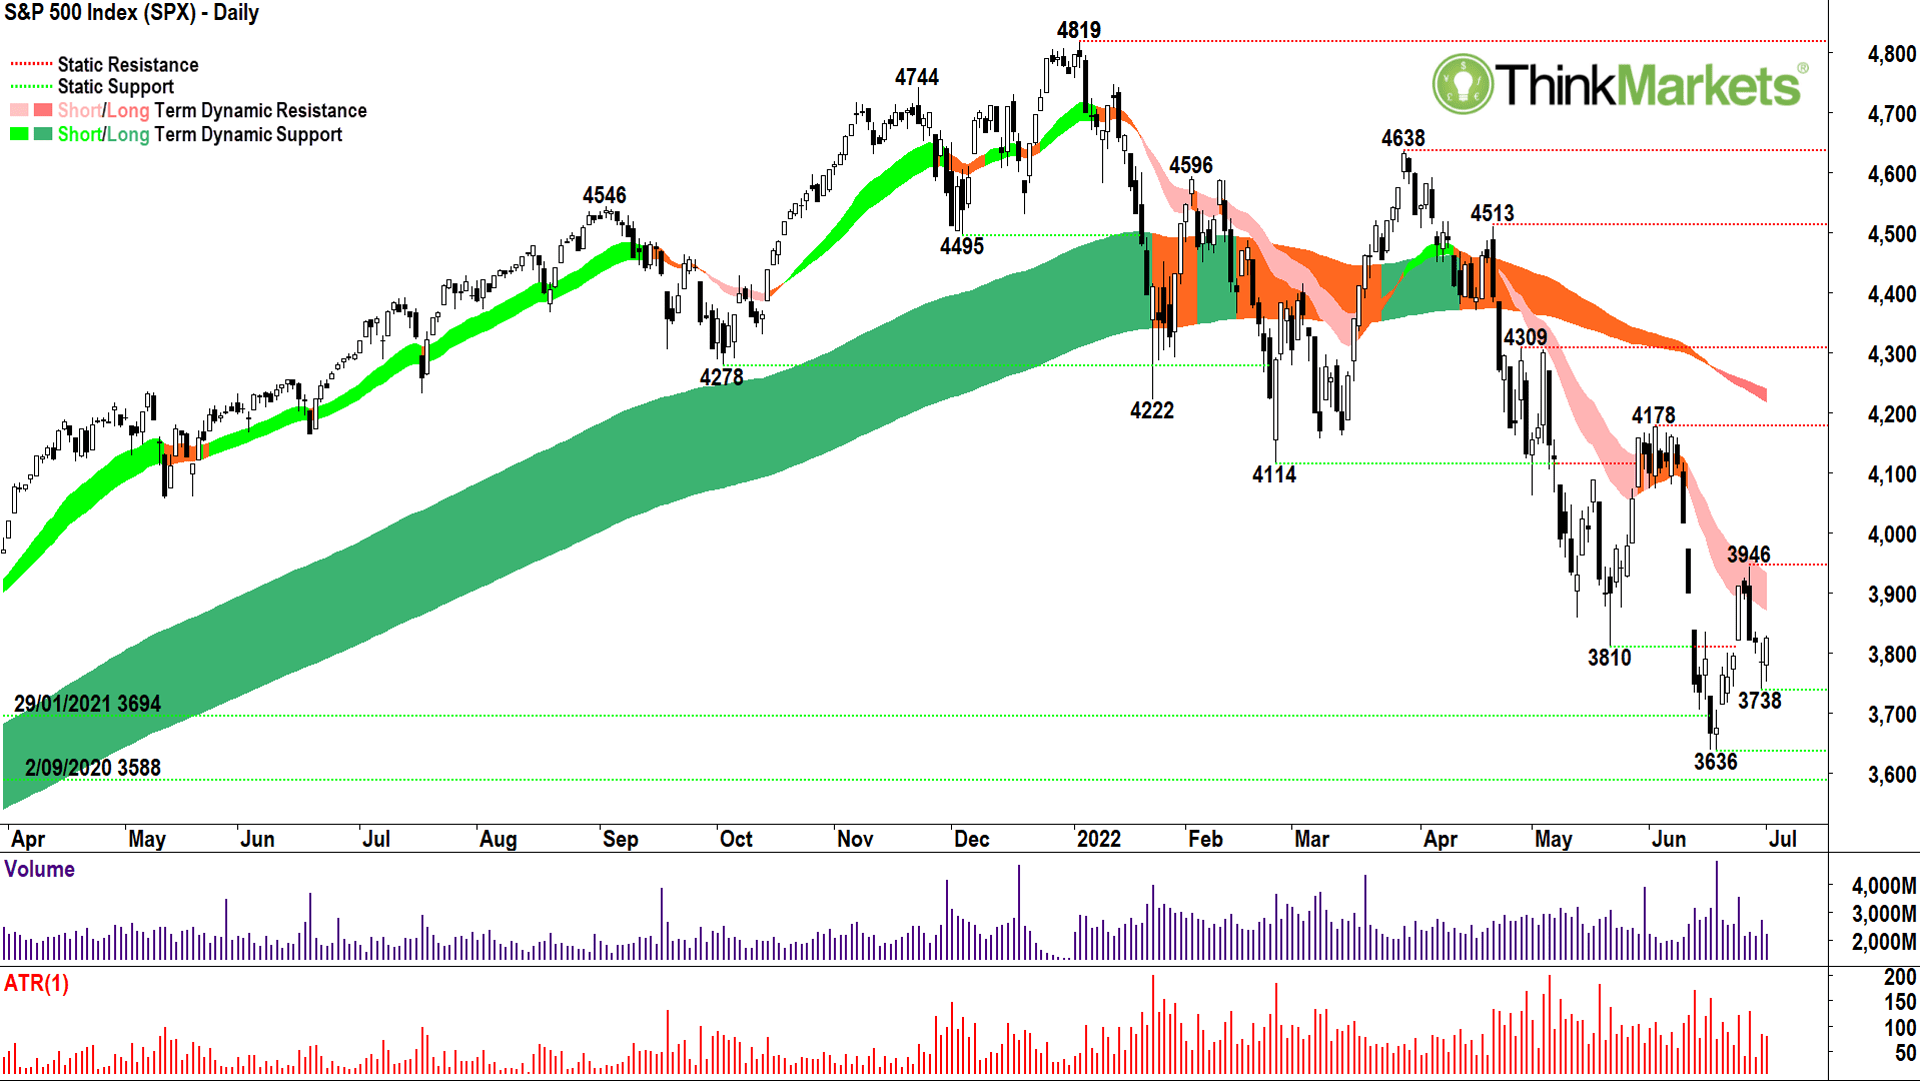
Friday’s candle on the SPX in the US provided another spark amidst an otherwise dark and dreary 2022 for stocks.
A single positive candle does not a bull market make, of course, but its characteristics and timing are important within the context of this phase of the bear market.
The fact Friday’s candle high and low are greater than Thursday’s high and low respectively, sets Friday’s low of 3738 as a “trough”. This trough is greater than the last set at 3636, and so the SPX is back to higher troughs in the price action. If it can move back above 3946, it will also exhibit higher peaks.
Higher peaks and higher troughs together are a sign that demand is building (via the higher troughs), and supply is diminishing (via the higher peaks). Building supply and diminishing demand would be a welcome first step in setting 3636 as the eventual bear market low.
A close above 3946 would also eclipse the short-term downtrend ribbon (light-pink zone). This is the other key hurdle required to be cleared before we can place too much confidence a major low is in.
If we see a bunch of supply-side candles (i.e. black bodies and or upper shadows) in the short-term downtrend ribbon, it’s a strong signal the big money remains firmly set at “sell the rally” mode. Watch then for another test of 3636, and failing that, 3588.
In summary, as promising as Friday’s spark is, there’s still plenty of work which needs to be done to turn this bear back into a bull.
View: Bearish, sell rallies until a close above 3946.
Nasdaq Composite (COMP): Heaven Help
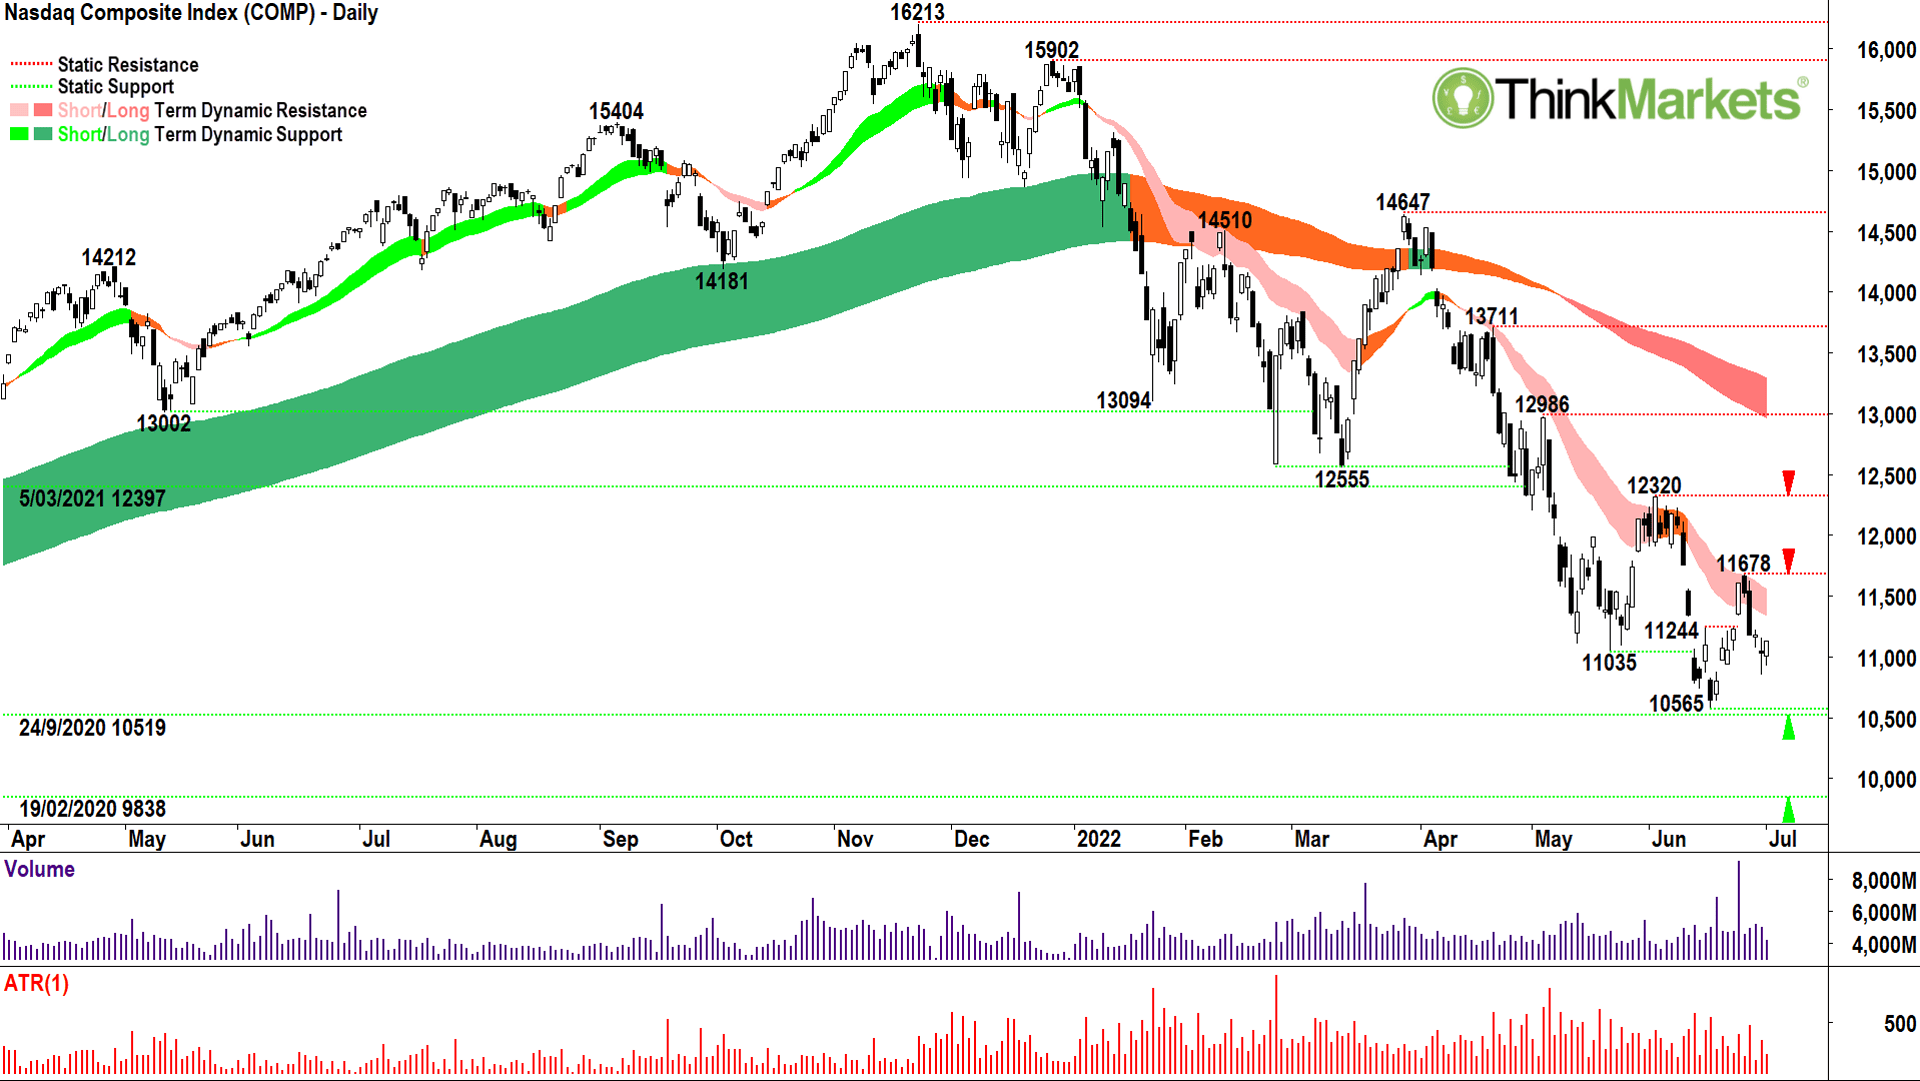
Just very quickly here, because the trends are going to match up very closely with the SPX. But note Friday’s COMP candle was not as impressive as the corresponding SPX one. It did not trigger the formation of a higher trough. Also, the COMP long-term downtrend ribbon (dark-pink zone) is far better established and is showing greater downside momentum than the SPX’s.
Like the SPX, it’s going to be crucial how the price action behaves in the short-term downtrend ribbon. That ribbon has killed several rallies now (i.e. to 13,711, 12,986, 12,320 and 11,678). Again, watch for further supply-side candles in this zone, it will signal more of the same… lower prices ahead. In this scenario watch for a retest of 10,565, and failing that, a date with destiny at the 19 Feb 2020 high of 9,383.
However, if we see further demand-side candles (i.e. white bodies and or lower shadows) in the short-term downtrend ribbon, followed by a close above the ribbon, the chance of a sustainable rally increases significantly. Even better is if the COMP also closes above static supply points 11,678 and 12,320.
And then there’s the price action, it needs to change back to higher peaks and higher troughs, and then there’s turning around those trend ribbons… Basically, a great deal needs to go right before the “View” bit in the next sentence is going to read “Bullish”.
View: Bearish, sell rallies until a close above 12,320.
S&P ASX200 (XJO): Believe
Last week we noted how the Materials Sector (XMJ) had transitioned from crutch for the XJO to dead weight.
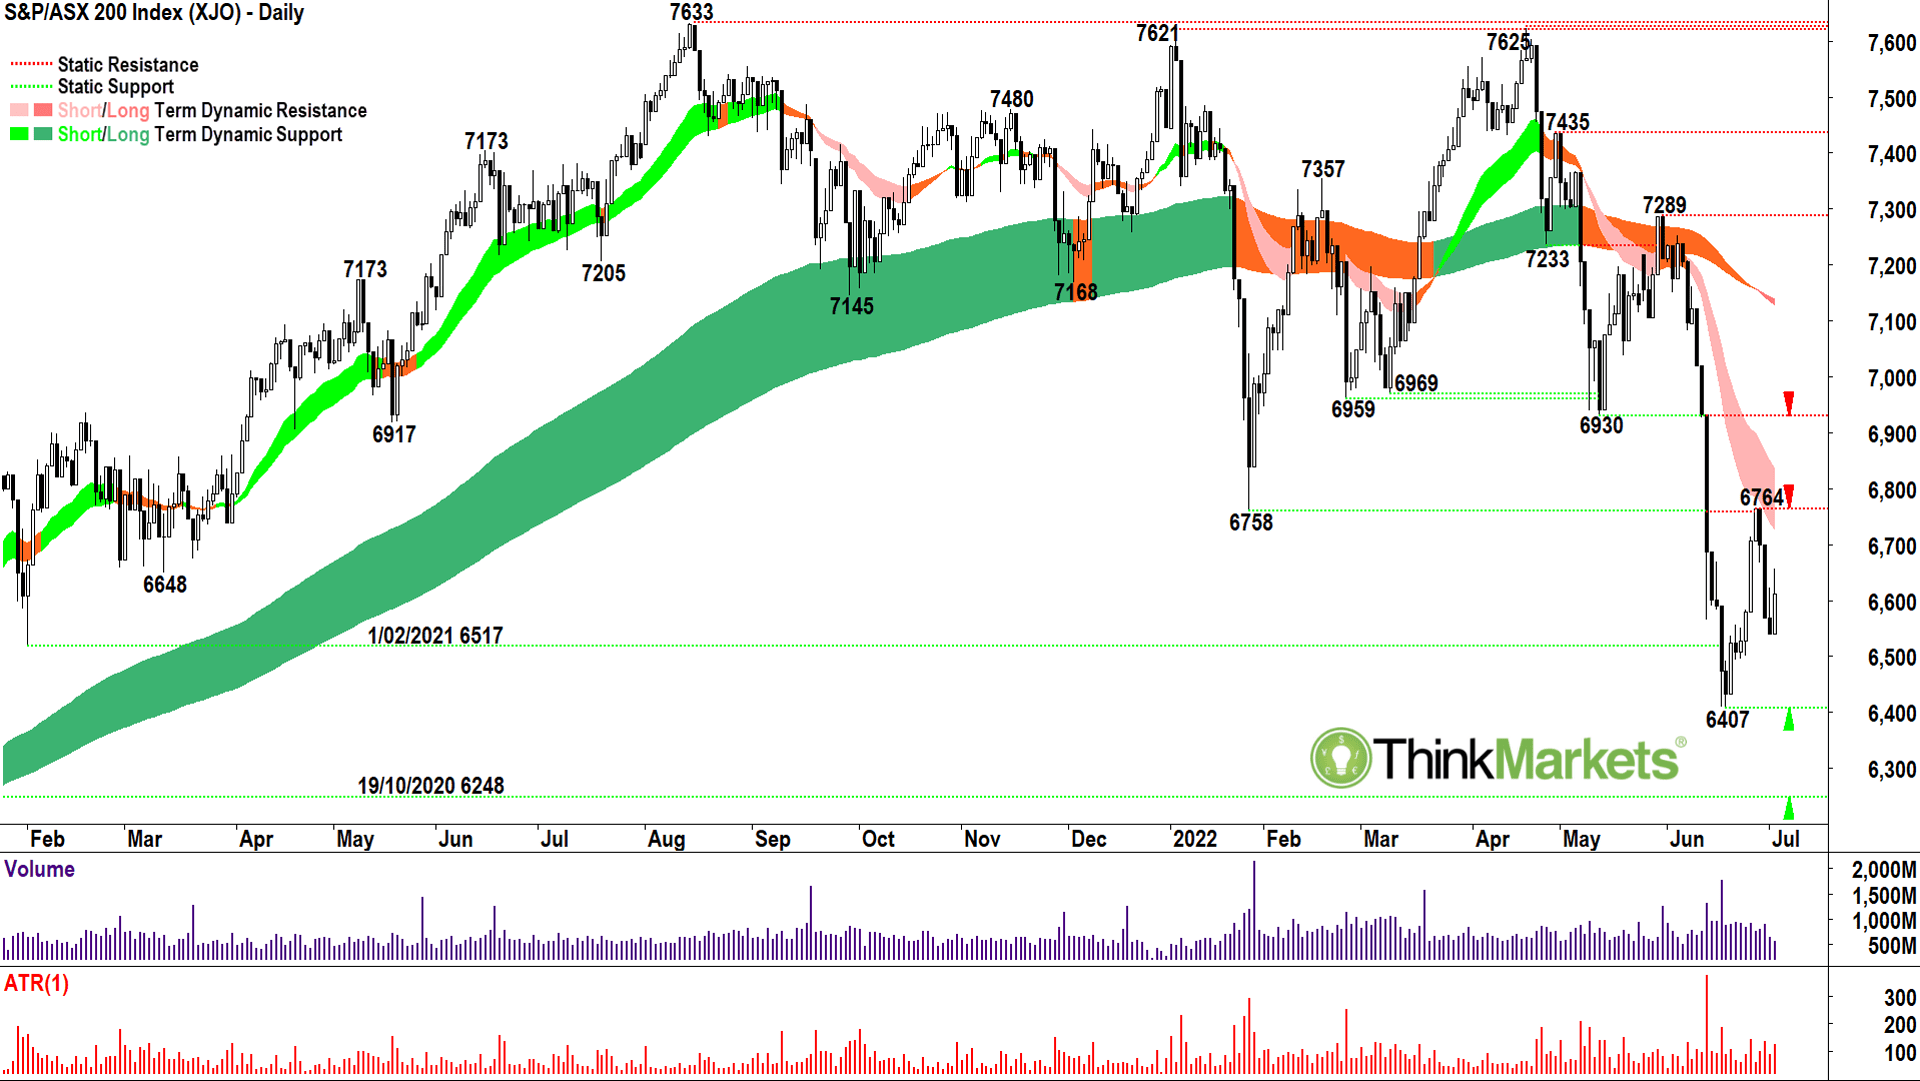
Its performance last week wasn’t much better, and even as I watch today’s promising rally, I can see a number of key ASX resources stocks closing well off their highs. We’ll look at a couple of those as potential short sell opportunities below. For now, I note the XJO is focussing more on the promise of Friday’s SPX candle than the overall short- and long-term downtrends.
This could end in tears. But where?
Well, I’m watching for supply-side candles in the short-term downtrend ribbon between 6720 and 6830. Should they appear, we’re likely to plumb the lows again with demand kicking in at 6407, and failing that, at 6248.
A close above 6764 and the short-term downtrend ribbon is crucial to demonstrate the market has switched back to FOMO, and therefore a more sustainable period of buy the dip is possible. My tip is not to get too excited about any rally until we sufficiently deal with each of these barriers.
View: Bearish, sell rallies until a close above 6764.
And now, a snappy little riff and some mood music. After the intermission, for your sheer charting pleasure, I want to show you six super-sexy ASX stock charts to watch this week. Take it away Mr Kravitz.
Intermission
Part Deux
I have two charts I feel are set for lower prices ahead, two which I’ve just added to my “turnaround play” radar because of their commendable short-term downtrend ribbon performance so far, and two I feel have re-established their long-term uptrends and are therefore set for higher prices.
Fortescue Metals Group (FMG)
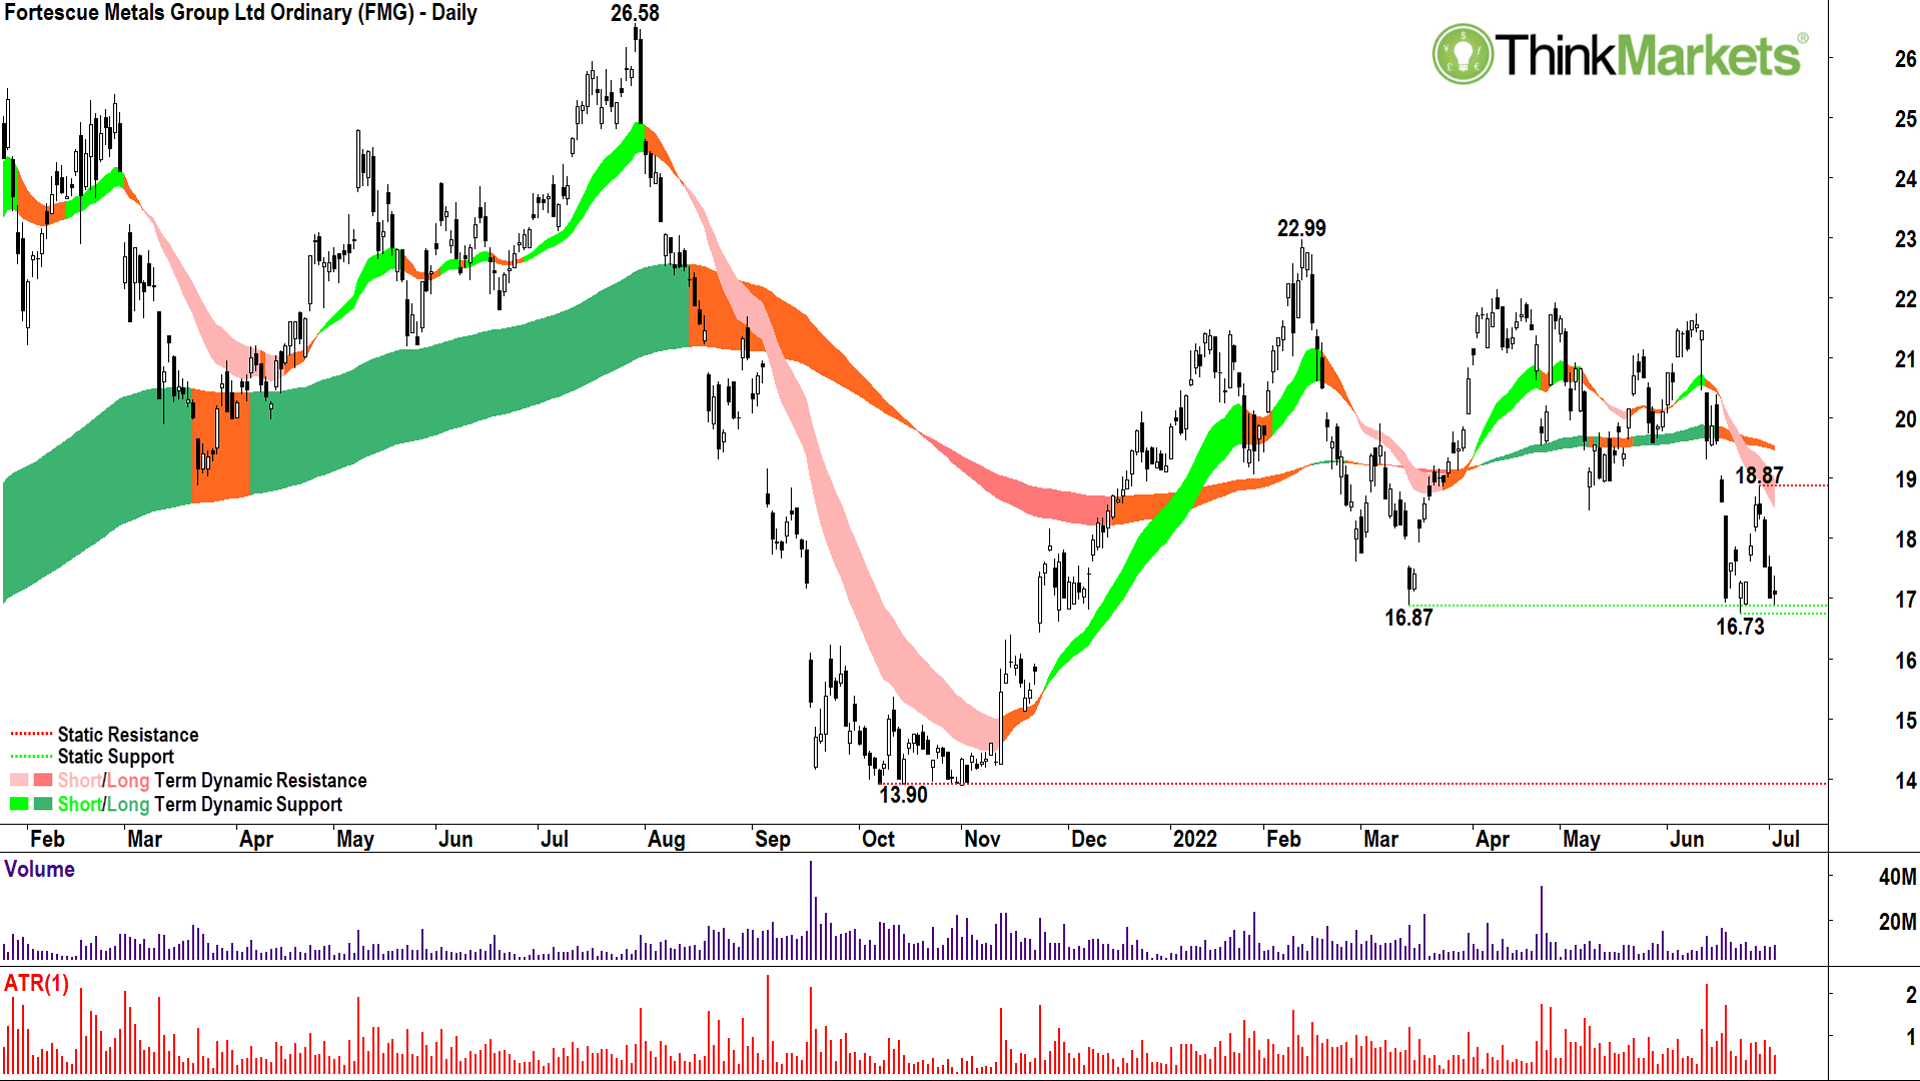
My tip is the long-term trend on FMG is just about to turn down. The long-term trend ribbon (orange zone) has completely flattened after a very weak switch back to the upside in March-April. The price broke below this critical zone in June, retested it, and then failed to reclaim it (29 June peak at 18.87). A break of the trough at the 26 June low of 16.73 will be the final confirmation a new long-term downtrend has begun.
The short-term trend ribbon (light-pink zone) will continue to impede rallies, as will 18.87. Should the price close below 16.73, the next logical target is the static demand point at the 7 October 2021 low of 13.90.
View: Bearish, sell rallies until a close above 18.87.
Sandfire Resources (SFR)
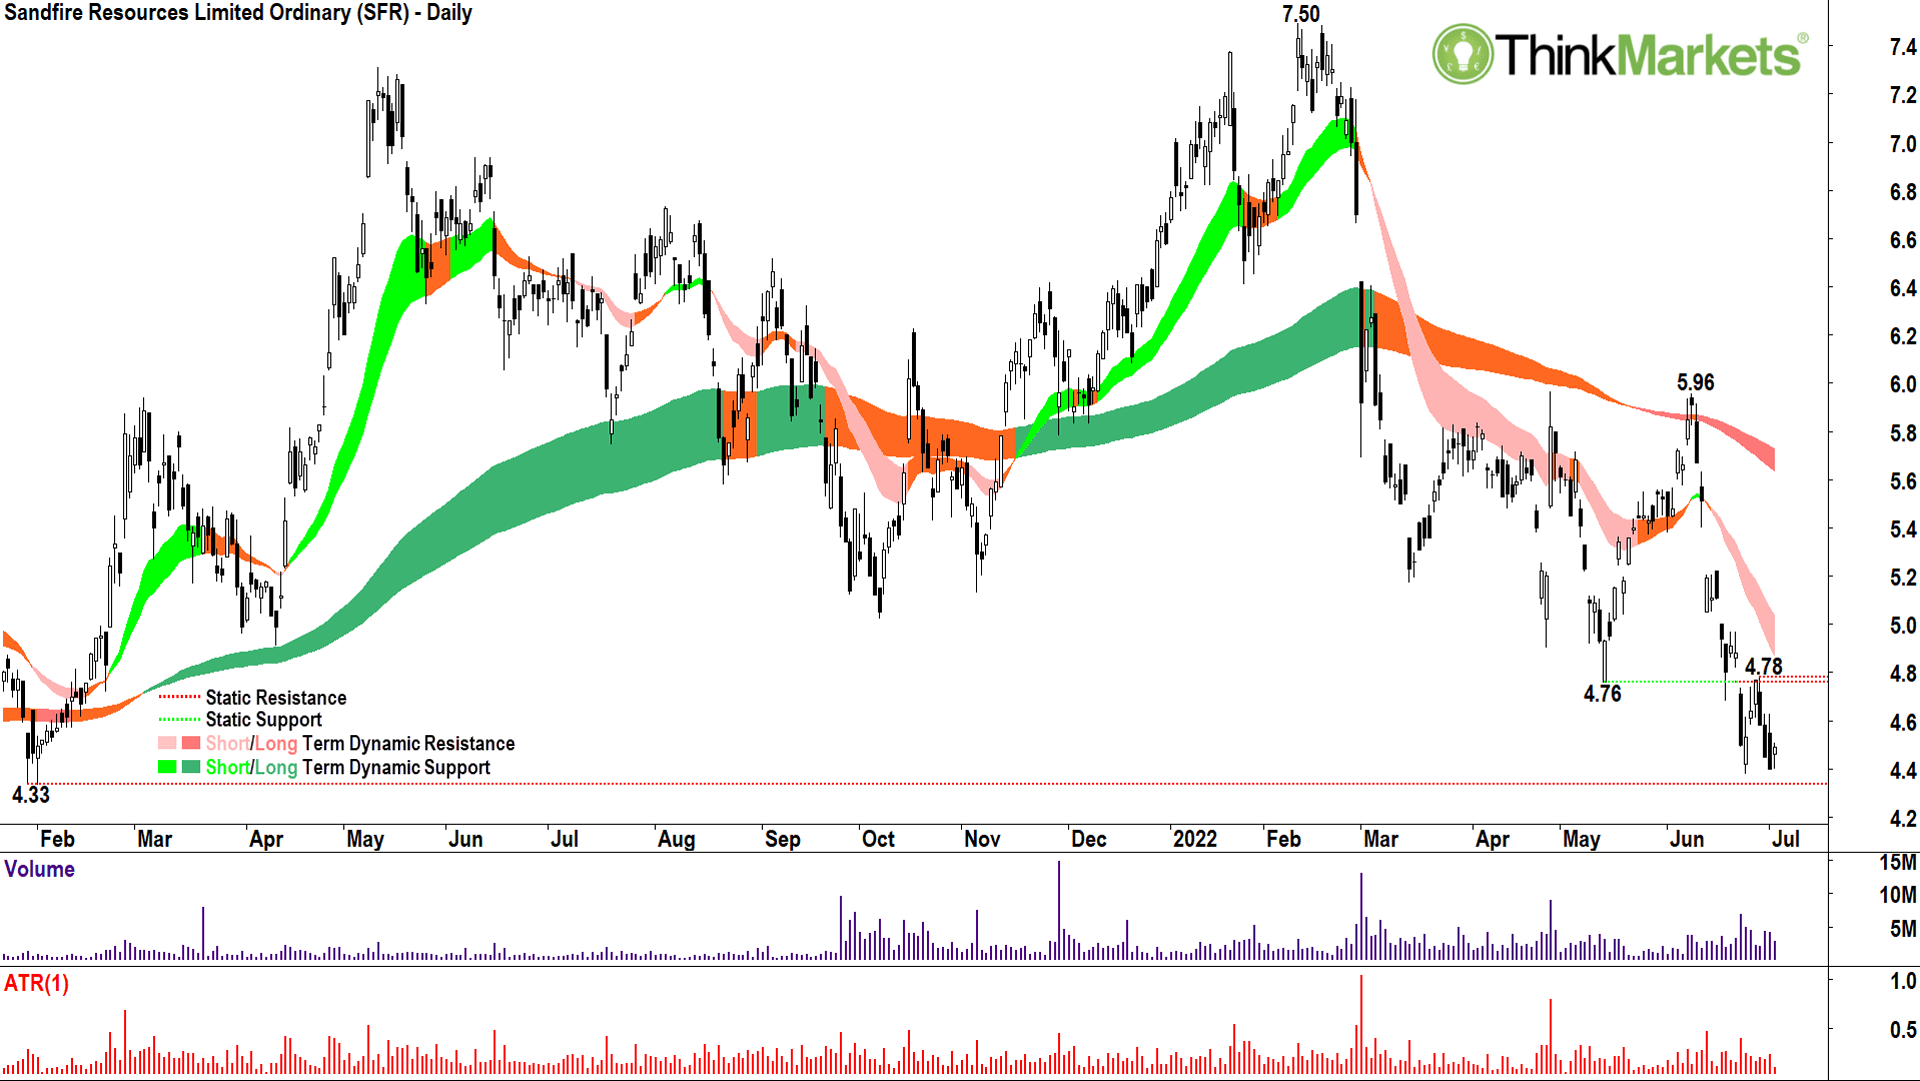
The SFR long-term downtrend is well established. It cracked in late-February and retested and failed to reclaim it in April and June. The break of the trough at the 4.76 low on 23 June was the final straw destroying any hope of higher prices for SFR in the near term. More likely, the 28 January 2021 low of 4.33 cracks and the price targets the next static support point (not shown) at the 2 October 2020 low of 3.70.
View: Bearish, sell rallies until a close above 5.05 (i.e. top of short-term downtrend ribbon).
Betmakers Technology Group (BET)
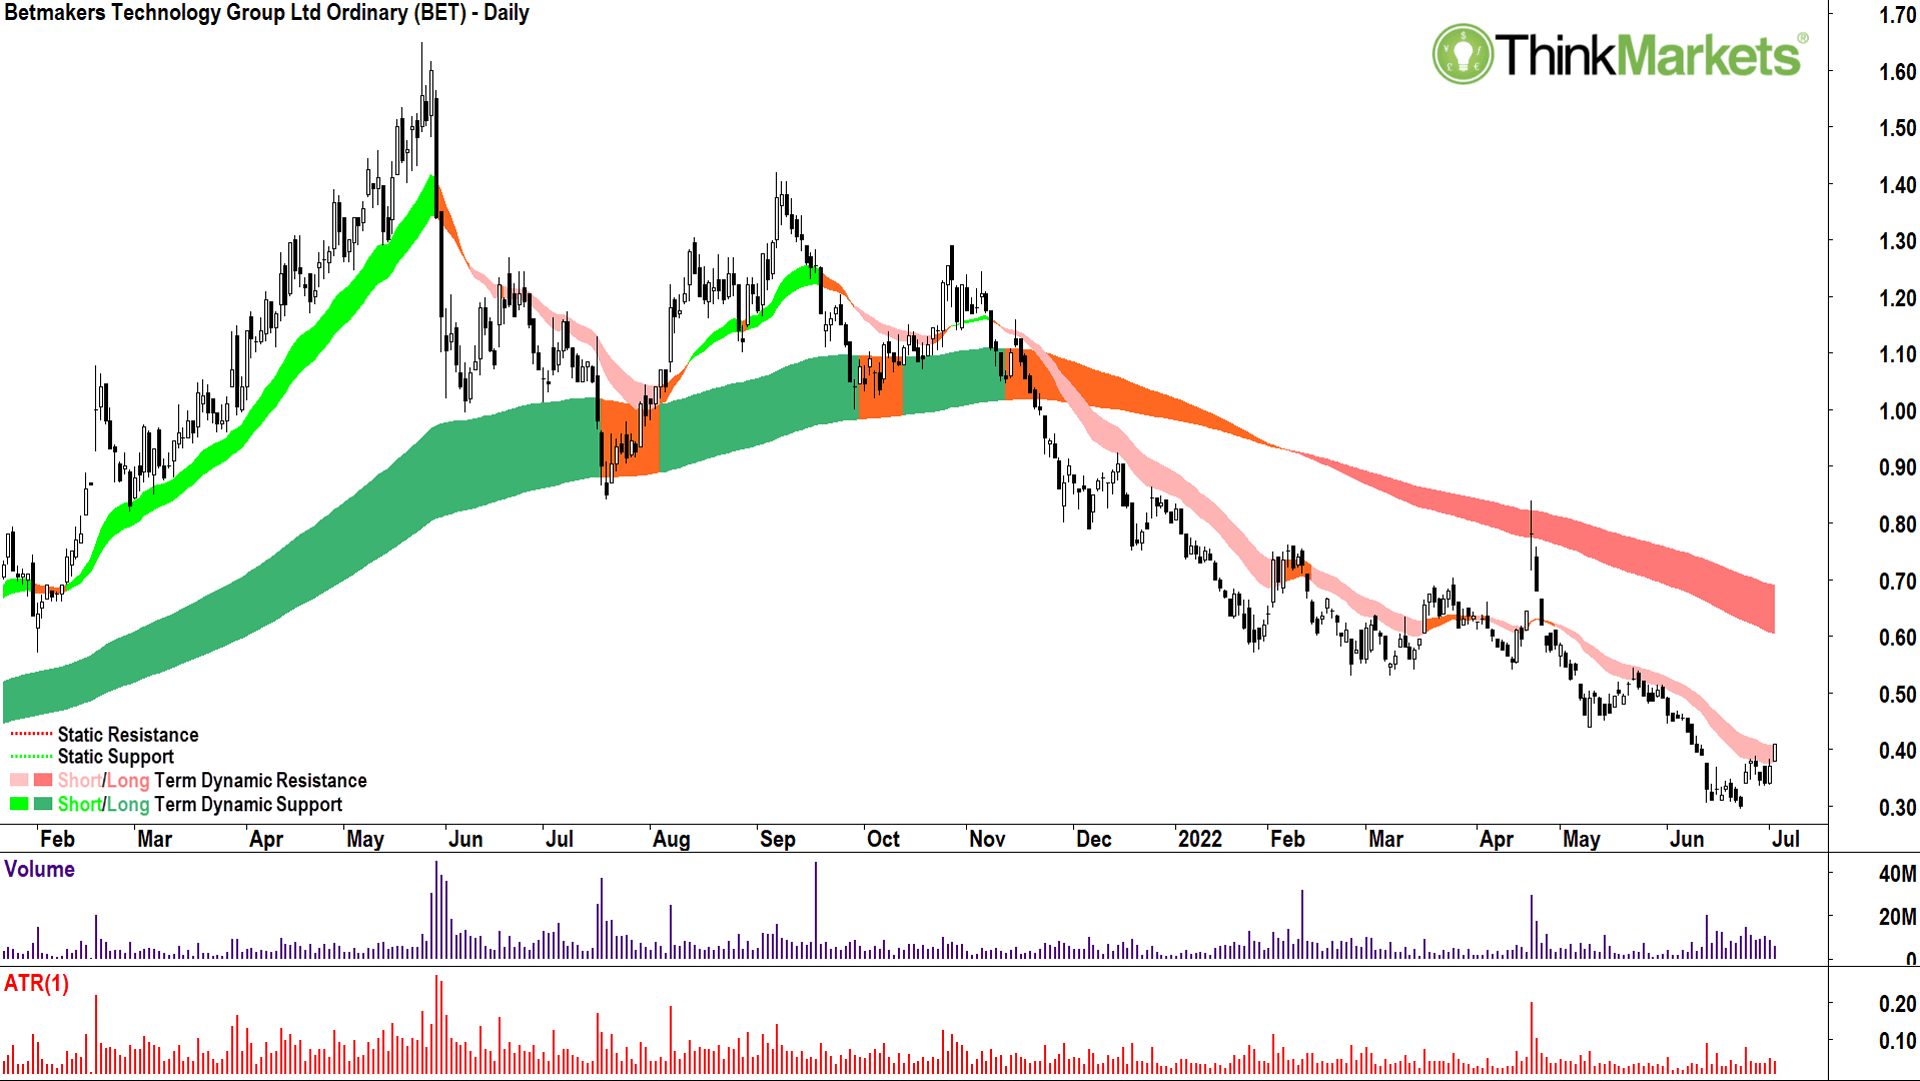
Honourable mention here and on the next one. Clearly the long-term trend ribbon is a monster, and the short-term trend ribbon has terminated rally after rally after rally after… well, you get the picture!
But!
The price action has swung back to higher peaks and higher troughs, and I note solid demand side performances on the candles 24-27 June and 1-4 July.
The 4 July candle close just pipped the top of the short-term downtrend ribbon and closed at its high. Perhaps investors aren’t afraid of the big bad short-term downtrend ribbon anymore! Famous last words… but this one is very much on my “turnaround play” radar, and it should be on yours.
View: (Dare I say) Bullish, going to wait for more confirmation though before calling it an outright buy, but on my turnaround play radar until a close below the 26 June low of 0.295.
Dubber Corp (DUB)
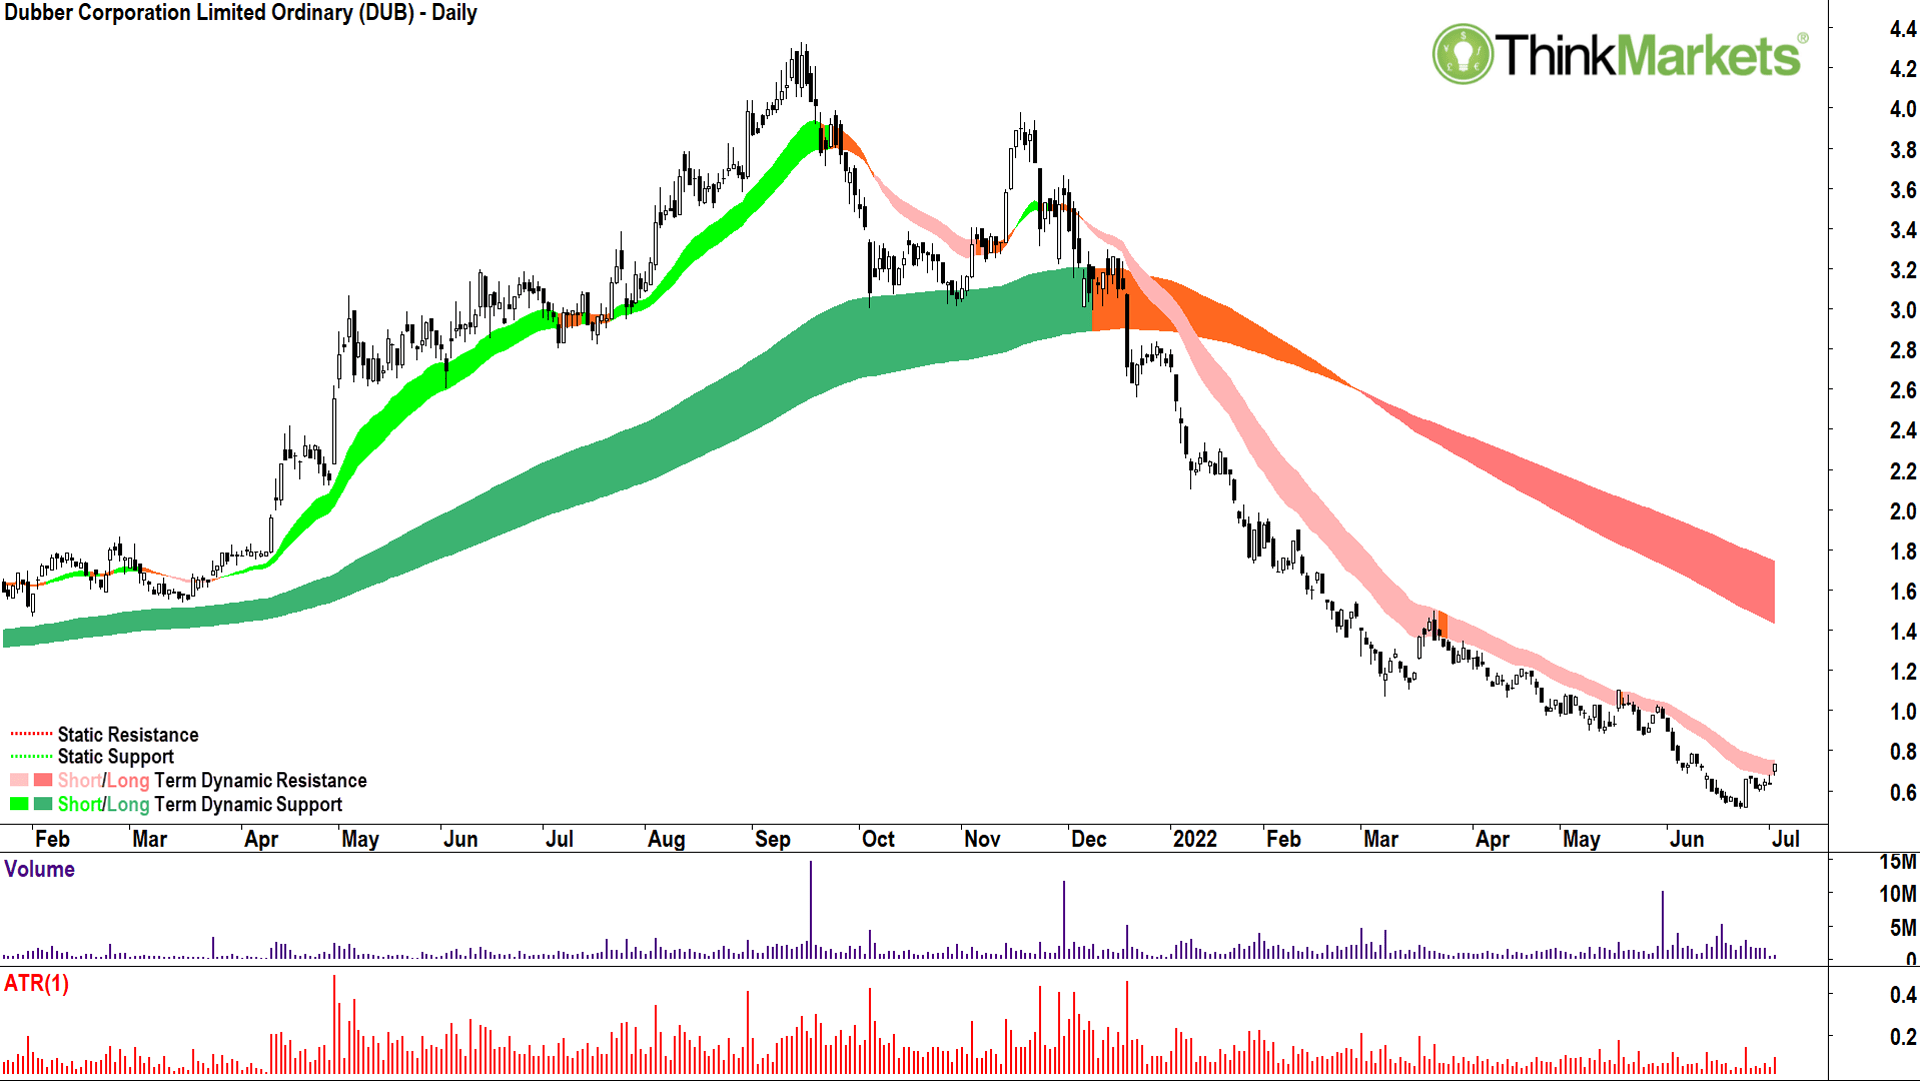
Ditto on DUB!
The only thing which makes this “not quite as good” as BET, is the fact the 4 July candle didn’t quite close above the short-term downtrend ribbon. But, given it did close at the session high, this not-so-mean feat shouldn’t be far away. I look at BET and DUB as a risk-reward play.
There are some decent technical signals on each demand is returning. If they have even a modest rally, the upside in comparison to the downside is probably very good. The downside is well defined – upon a close back below the swing low (in this case the 23 June low of 0.51) mea culpa, I’m out of there!
Bullish, going to wait for more confirmation though before calling it an outright buy, but on my turnaround play radar until a close below 0.51.
Melbana Energy (MAY)

No squinting to find a reason to buy this one.
The long-term trend has re-established (dark-green zone), the price action has swung back to higher peaks and higher troughs, and there’s been some great candles over the last couple of weeks despite a terrible broader market. The demand-side wants into this one – and I am happy to go with the flow.
Volume is building up again, but there doesn’t appear to be a great deal of supply in the way on that move through 0.10 – which is a good thing. I can see a little pressure point at the 9 May high of 0.115, but I don’t expect it will cause too much trouble.
Major supply points at 0.18 (the 7 April high) and 0.215 (the 18 March high) are the logical upside targets.
View: Bullish, buy pullbacks until a close below the 23 Jun low of 0.069.
Silex Systems (SLX)
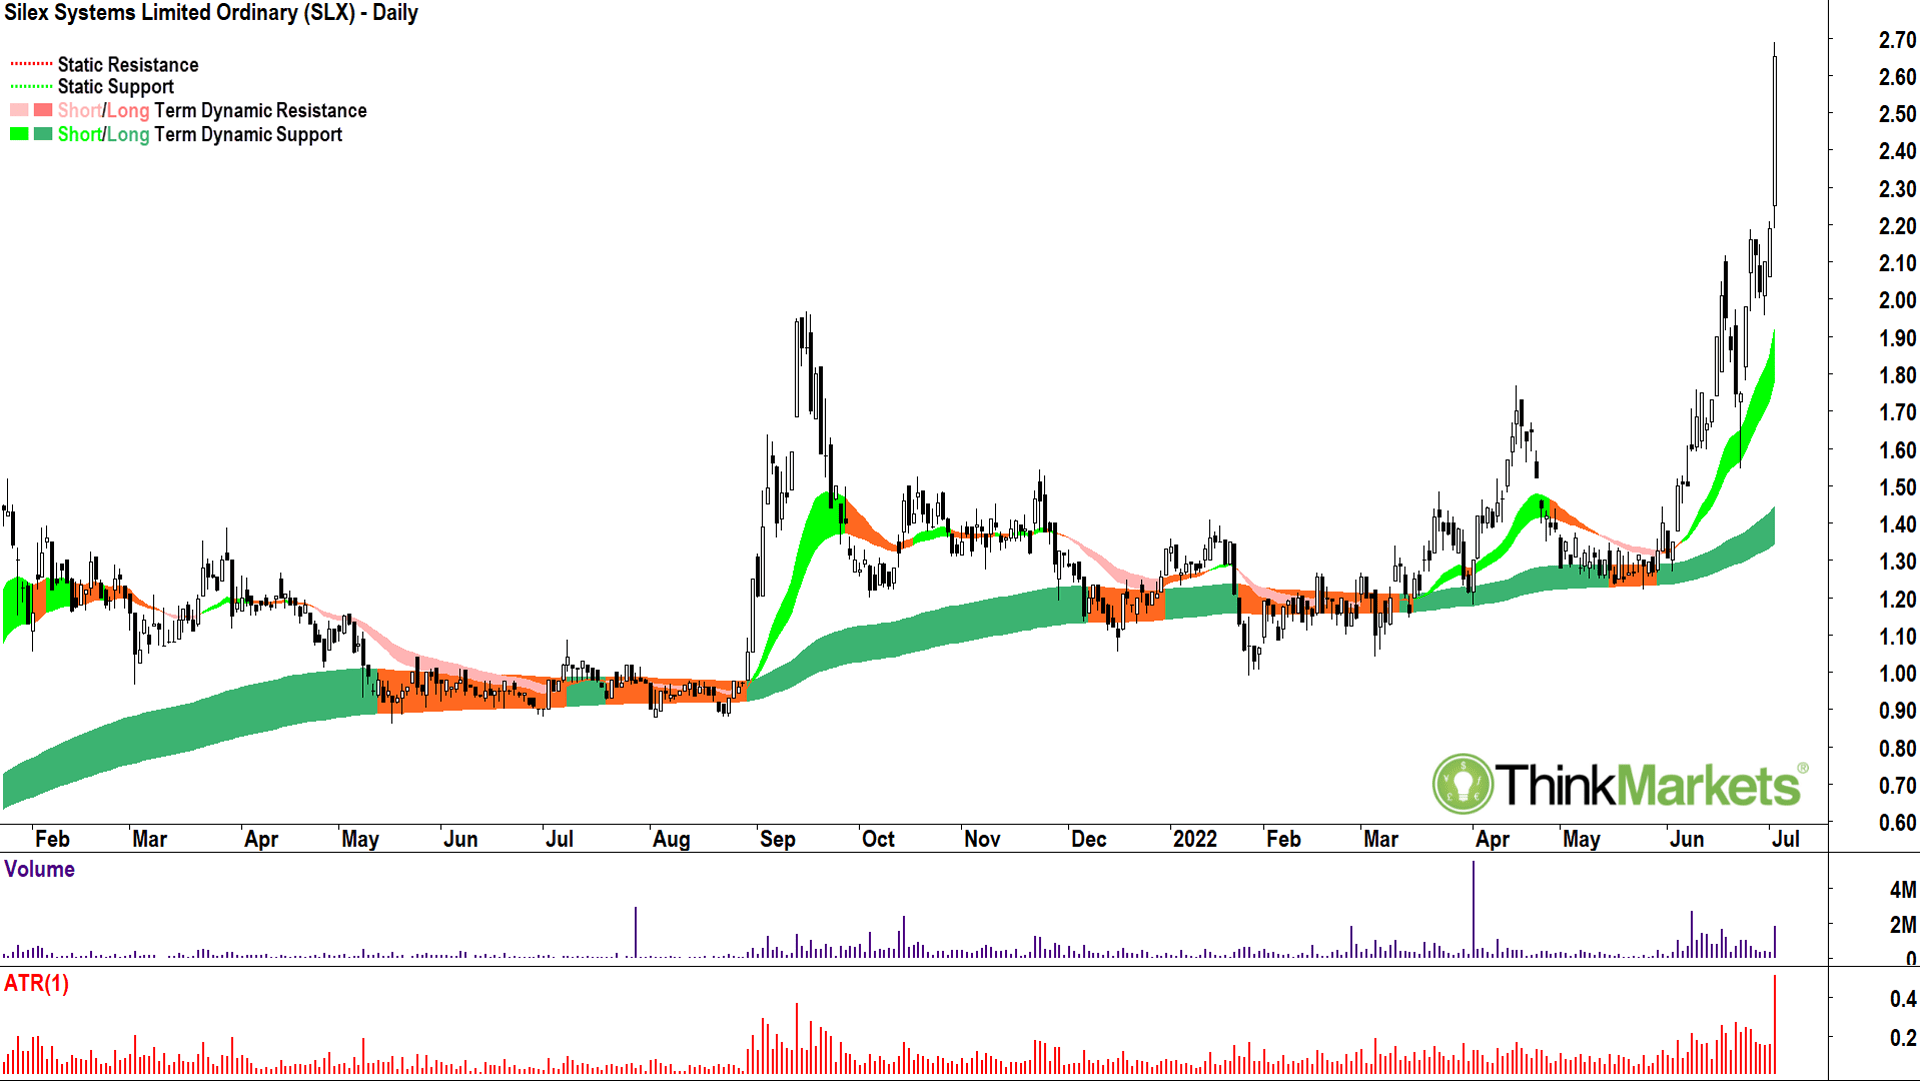
This one is more of a follow up – I covered it in this outstanding previous edition of The Candlestick.
At the time, it was just pushing into 2.00 and looked just as amazing as it does now. So, unthink your last just thought: Just because it’s gone up doesn’t automatically make it too high to buy (yes you did!).
SLX remains a picture of excess demand.
I can’t see any reason in the chart above to sell it, price action, candles, trends – all perfect. To buy it, however, is a bit trickier. Ideally, I’d like to get in close to the short-term trend ribbon with a ripper demand-side candle. The last chance to do this was just after my last posting, on 23 June – a ripper demand-side candle if ever I saw one!
When you find this candle in the short-term trend ribbon in a trend as strong as SLX’s at the time, you buy! So, memory burn that pattern for next time!
View: Bullish, buy pullbacks until a close below the 30 Jun low of 1.95.
It’s the end. Until next week,
Candle-out.
The views, information, or opinions expressed in the interviews in this article are solely those of the interviewees and do not represent the views of Stockhead. Stockhead does not provide, endorse or otherwise assume responsibility for any financial product advice contained in this article.
Related Stories


UNLOCK INSIGHTS
Discover the untold stories of emerging ASX stocks.
Daily news and expert analysis, it's free to subscribe.
By proceeding, you confirm you understand that we handle personal information in accordance with our Privacy Policy.


