The ‘Buffett Yardstick’ suggests manic markets are heading for another crash

Pic: via Getty Images/ Stockhead
Investor expectations are soaring “far beyond any reasonable figure”, with U.S. investors now expecting to achieve average annual returns of ~17.5% — roughly in line with the most aggressive return expectations seen at the peak of the DotCom Mania.
As a result, they’re pouring money into the equity market like never before, according to experienced analyst Jesse Felder.
This is WILD. If equity fund flow continue at the current pace, this year will see greater net inflows than the preceding 20 years COMBINED. pic.twitter.com/Tlsm5Igvrf
— Robin Wigglesworth (@RobinWigg) July 2, 2021
This is despite the the Buffett Yardstick going “straight off the top of the chart.”
What is the Warren Buffett Yardstick?
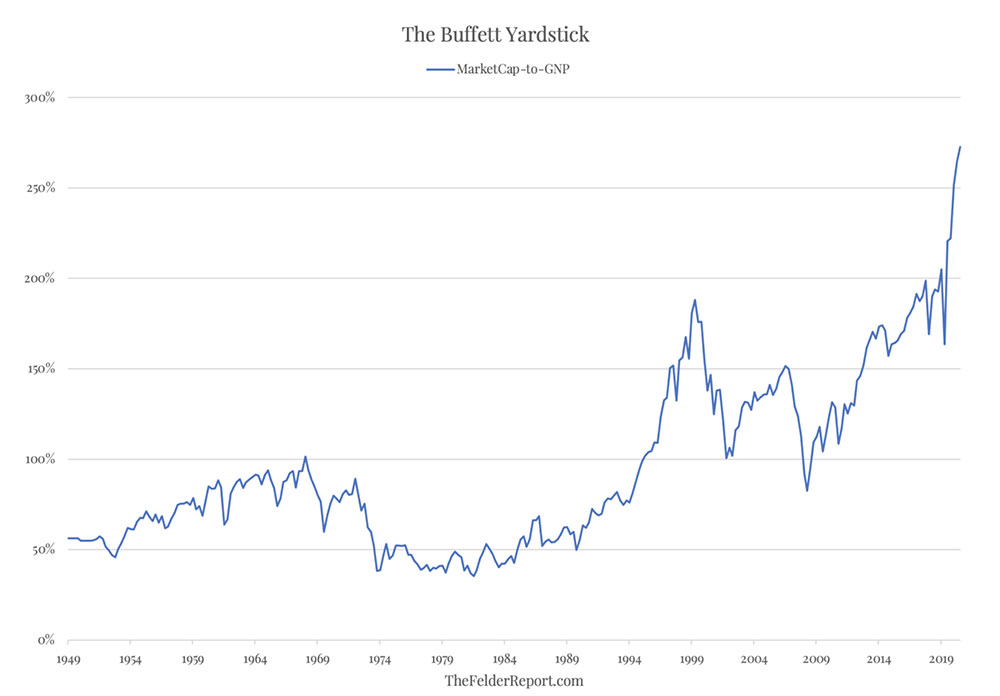
This chart, used by famous business magnate and investor Warren Buffett, shows the market value of all publicly traded companies as a percentage of the total value of all products and services produced by a country, or gross national product (GNP).
“It is probably the best single measure of where valuations stand at any given moment,” Buffett says.
As you can see, in 1999 the ratio rose to an unprecedented level, before crashing. Hard.
“That should have been a very strong warning signal,” he says.
“For investors to gain wealth at a rate that exceeds the growth of U.S. business, the percentage relationship line on the chart must keep going up and up.
“If GNP is going to grow 5% a year and you want market values to go up 10%, then you need to have the line go straight off the top of the chart. That won’t happen.
“For me, the message of that chart is this: If the percentage relationship falls to the 70% or 80% area, buying stocks is likely to work very well for you.
“If the ratio approaches 200%–as it did in 1999 and a part of 2000–you are playing with fire.”
Right now, the Buffett Yardstick is ~ 50% higher than its peak set in 2000, widely seen as the top of the greatest speculative mania in stock market history, Felder says.
“If Mr. Buffett is right and, “price you pay determines your rate of return,” investors today are facing a much bleaker future than they were 20 years ago,” he says.
Related Stories

UNLOCK INSIGHTS
Discover the untold stories of emerging ASX stocks.
Daily news and expert analysis, it's free to subscribe.
By proceeding, you confirm you understand that we handle personal information in accordance with our Privacy Policy.


