Market Matters Masterclass: Looking for growth at the edge of recession

This series is brought to you by Market Matters. Market Matters provides access to professional money managers, portfolios, and daily market updates so that you can easily tailor your investment strategy to your needs. Sign up here for a full 14-day free trial to learn more.

James Gerrish is Portfolio Manager at the boutique/retail market insights platform Market Matters.
Alongside co-founder former Macquarie and Goldman Sachs macro-analyst Shawn Hickman, he is the lead author of MM’s daily investment reports – mailed directly to members morning and evening, with live alerts sent through the trading day whenever they amend portfolios, providing clear, decisive and actionable market insights in real-time.
In this bloody exciting new series, Stockhead has wrangled unfettered access to Messrs Gerrish, Hickman and the Market Matters analyst team – and their devilishly interactive MM platform.
I ambushed James with a few unanswerable ‘what’s going to happen to us all in this life’ questions – and then recorded everything. What follows is exactly how it went down.
Money Matters Masterclass Week #1
Sensei: James Gerrish
WE begin amid the madness and confusion of a post-pandemic fiscal uncertainty so profound that even the recession it’s inspiring is itself but a profound uncertainty.
A man – let’s call him James Gerrish (it totally is James Gerrish) – emerges from the still smoking wreckage of global markets.
While everyone’s looking about for their limbs like in Saving Private Ryan, Gerrish is sifting happily through the ashes of Small Caps, calling on the ghosts of Growth Stocks and snapping up fire-sale real estate in the red light districts of the Consumer Discretionary sectors.
To anyone hit by the recent down this may appear to be the grizzly behaviour of the damned. It may seem a little crazy-brave; a bit counter-intuitive, or perhaps just contrarian-bordering-on-truculence.
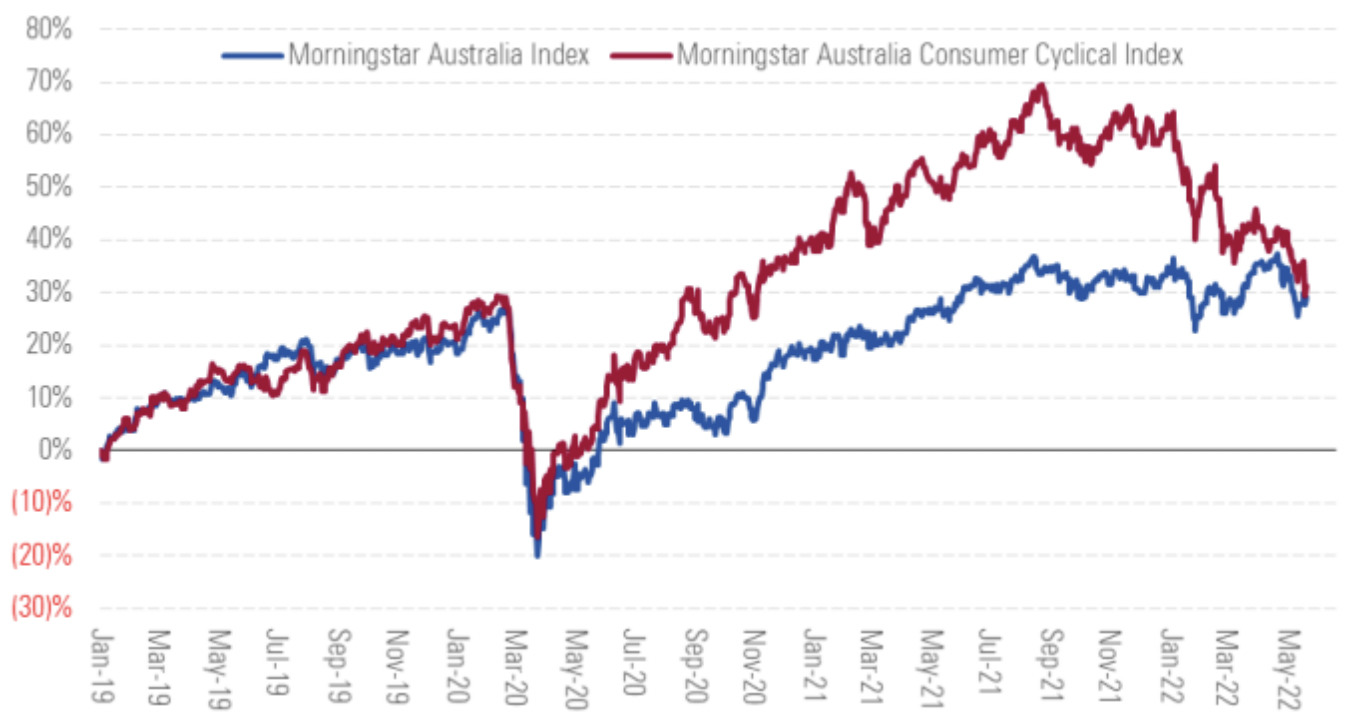
Just last month in the slightly vexed words of Morningstar analyst Angus Hewitt, the Consumer Cyclical (or Discretionary) sector only just scraped through a “brutal” Q2 22, the index down 21% for Morningstar, eclipsing the 14% loss of its Australia Index (see chart below), which targets the top 97% of local stocks by market cap.
That slide’s wiped out whatever COVID-gains these consumer brands made over the rest of the market, as the sector took off like a rocket starting Q1 20.
Entirely nonplussed, Gerrish says: “I would argue the market is potentially pricing a high probability of the armageddon already.
The typical decline in a recession led stockmarket sell-off is 24%. The Aussie market is down – top to bottom some 16%. The S&P 500 is down 25%, the Nasdaq 30%… there’s been clear evidence of equity pricing of this apparent looming recession. In some spaces, there’s been a huge rerating in equities already.
But markets as highly-charged as these evolve quickly and in strange ways, Mr Gerrish says – not unlike the Vegetation of Chernobyl.

“Despite priced in recession risk… these markets are riddled with valuation opportunities. And in these three very different spaces we mentioned – each at the centre of its own current storm – well, if you can stomach the volatility some very exciting things are unfolding.”
Gerrish says: “Market Matters absolutely has a long-term thesis on any stock with a good story:
“If the narrative is compelling, and there’s a beginning, a middle and an end – then we don’t walk out of the cinema. Actually on the site – a little plug – members see the stocks we’re into, as well as the stocks we mistrust. But we provide all the reasoning, the complete history behind every name and the why’s of every one of our decisions. So y’know. Backstory is key.
“But in the environment we’re seeing right now, where the rhythm is so staccato that shifts which normally take years to play out are happening in the time horizon of a few months… In these situations – like any in market scenario – you’re on the hunt to make forward looking decisions and act on them.
“What I don’t do is sit here and buy something and say we’re going to hold onto this come hell or high water.”
MM’s Indicator of the Month
What to look for – and rely on – as a market indicator amid the mess of macro we’re all copping?
James: “The volume of Inflation vs Central Bank data is just a bit of a tail chaser a the moment.
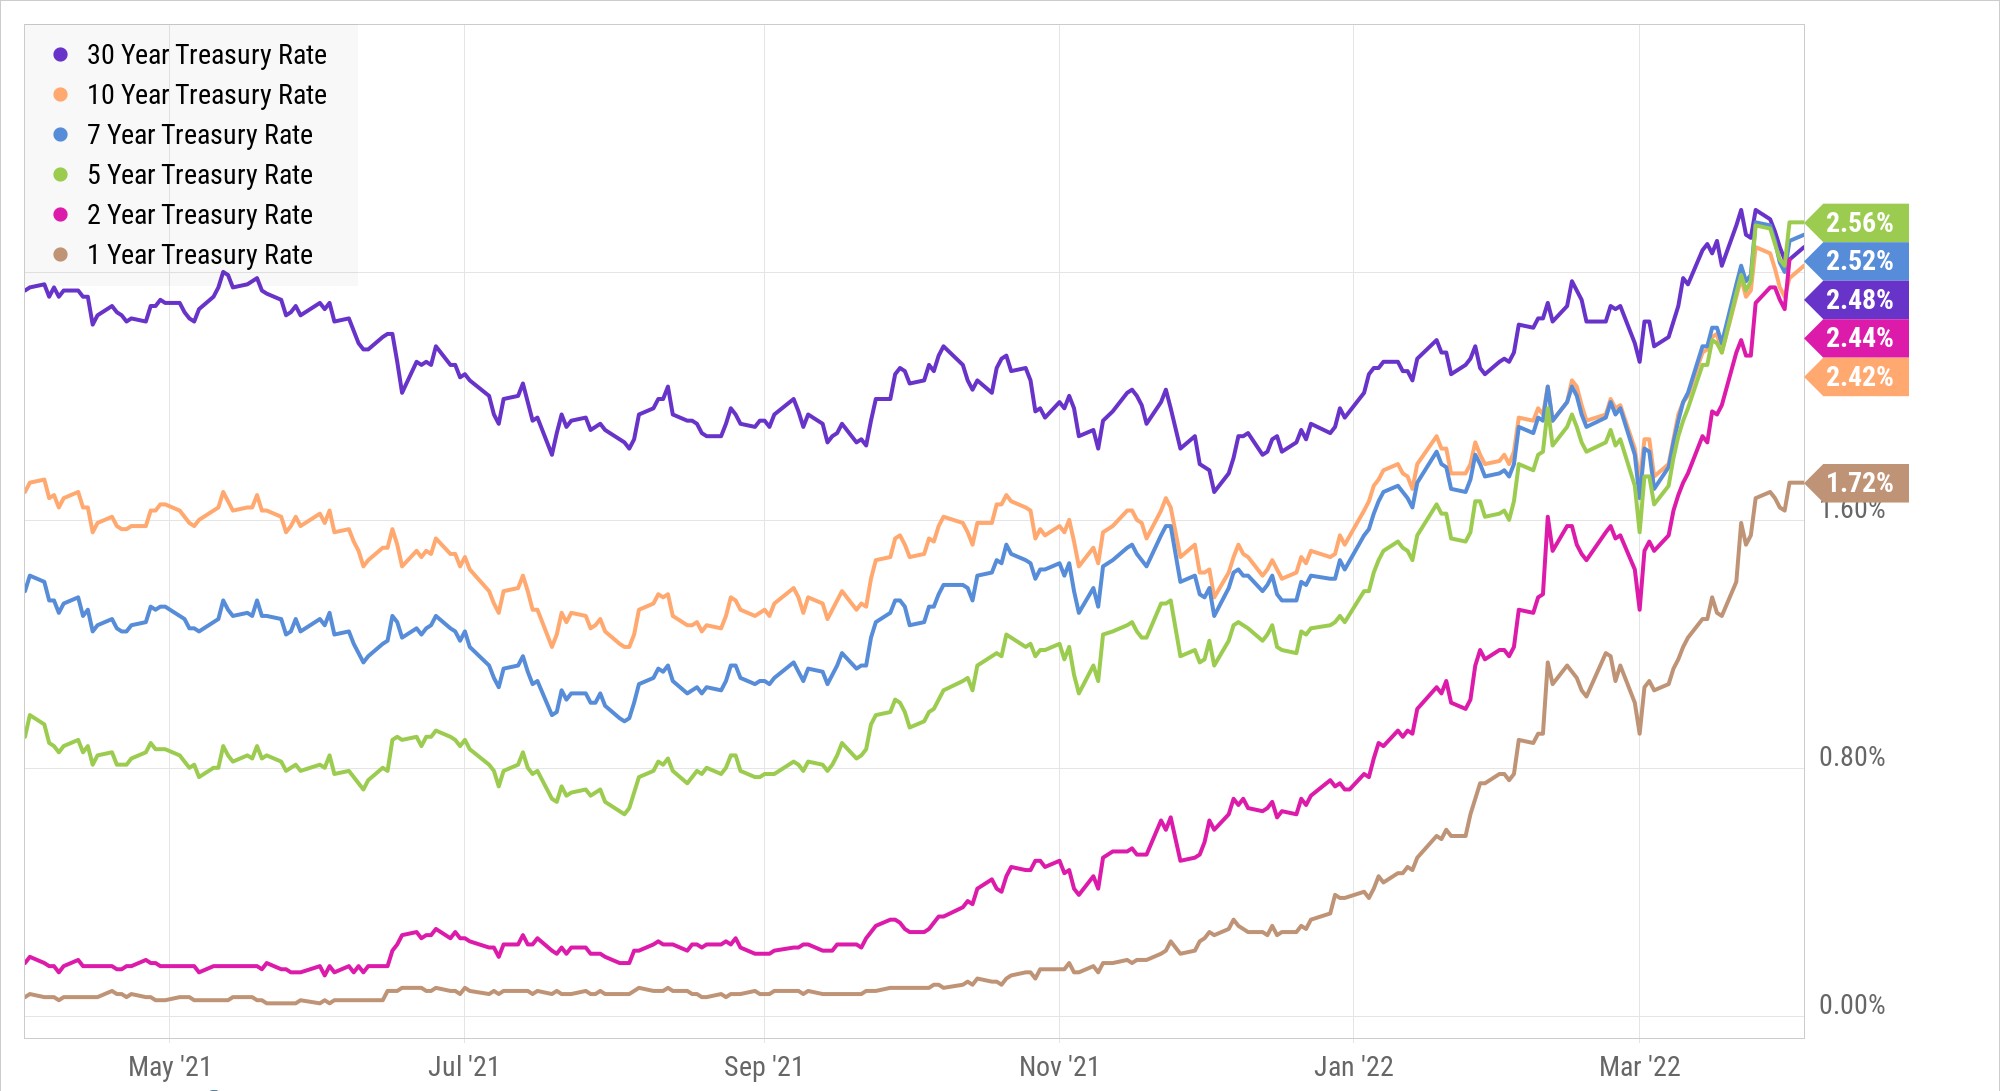
“For your own clarity – bond markets are critical. Actually the single simplest break-glass indicator for an economic panic is the yield curve.”
(Ed: That’s right, just when you thought it was possible to get through a downturn without having to learn something outside the easy way, it’s time to talk about yield curve inversion.)
The yield curve is what the difference between long and short term government bonds looks like when someone whacks it on a chart – that curve slopes on higher as the bonds get longer.
That’s because money is worth more the longer you can’t have it. That’s not math, that’s life.
You’ll want to get more for giving someone your money for 10 years than for just two years. So returns (rates) on long-term bonds exceed the rates on short-term bonds.
But not always.
Then we have this big sell-off and the global bond index crashes 10%. And then instead of a black swan – not quite as rare as a black swan, let’s call it more a purple chicken – conditions emerge where the short-term bond rates rise up above the long-term ones.
Yield curve inversion: Your Portent for Panic
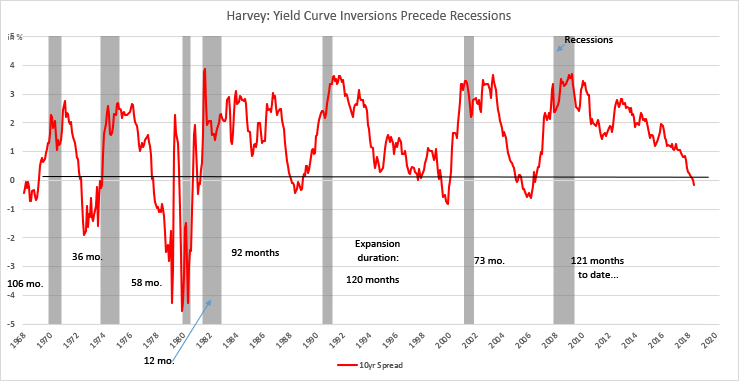
This entirely unlikely unorthodox bit of economic gymnastics is called a yield curve inversion and it’s mysteriously materialised on graphics ahead of every US recession since about 1955.
The 2 vs 10 US Gov bond yield curve inverted (see above) back in March for the first time since 2019. Then it did the same trick a few months later, in June.
In a 2018 report, researchers at the San Francisco Fed were the first to realise a recession followed within one or two years of the curve flipping like a pancake, although Duke Uni’s Campbell Harvey did publish a dissertation linking yield curve inversions back in 1986.
And by the way that’s why you got all these negative returns from super funds – now that’s an uncommon move – and they tend to happen when there’s a lot of artificial market intervention.
The Pit and the Pendulum
So we’re trading for a recession then, Mr Gerrish?
A little frustrated, James says: “No.”
“Not only is a recession far from a lock-in. It entirely misses the point of what is being indicated to a thinking trader.
“Flat or inverted yield curves are historically associated with slower economic growth or recessions.
“Our key focus is valuation. There’s been artificially depressed valuations and now markets will likely feature the transition back to more normal multiples.
“It’s like pendulum swinging – this huge economic contraction from the pandemic made central banks and governments go straight for the bazooka – and the pendulum swung the other way. Right now their concern is inflation and now they need firepower again to suppress the momentum and off we go again. Each swing of the pendulum can make it more difficult to land in the middle.
“And that’s why theres more risk out there – just as there’s more opportunity. It’s the Pit and the Pendulum and we have to not only navigate our way safely through.
“That happy medium is the target.”
Stock picks:
Money Matters Masterclass Week #1
Wesfarmers (ASX:WES)
“A large cap in the discretionary retail space we’ve bought before and it’s our most recent – Wesfarmers. We’re adding a bit more to the Active Income Portfolio as well.
ED: Last week the brokers at Morgans gave WES a huge rap, lauding it is a best-in-class business in the retail space and cheap as chips, with a price target of $58.40 after closing Wednesday at just above $46.
While COVID-related staff probs are proving a challenge, the core Bunnings division (that’s circa 60% of group EBIT) remains a solid performer as consumers continue to invest in their homes. We see the pullback in the share price as a good entry point for longer term investors, the brokers said.
Gerrish agrees: “This is exactly the kind of discretionary counter-intuitive trade worth getting a piece of:
“WES have one of the highest-quality retail portfolios in Australia. These are brands we all use. The Bunnings, the Kmarts, the Officeworks…
“I think just as importantly they’ve got a top leadership in the executive. Highly-regarded, very experienced – good PE and the balance sheet is strong.
“Bunnings is the big drawcard, it’s not really a question of if, but almost just a question of how much should we be investing into hardware retail exposure in Australia.
“Wesfarmers owns and runs retail chains, operates mines, writes insurance, manufactures and distributes industrial products, manufactures fertilisers and chemicals, and distributes liquefied petroleum gas and medical and industrial gases.
“Its main driver of earnings as I said is Bunnings, for better or worse, Australia’s best, biggest and always accessible hardware store.”
MM is bullish WES, adding +2% (Active Income Portfolio), at circa $44.80
Time for us to muck about with the MM toolkit.
Chart 1: Wesfarmers
This is the six-month for WES represented in bars, with closing price tracker and daily volumes:
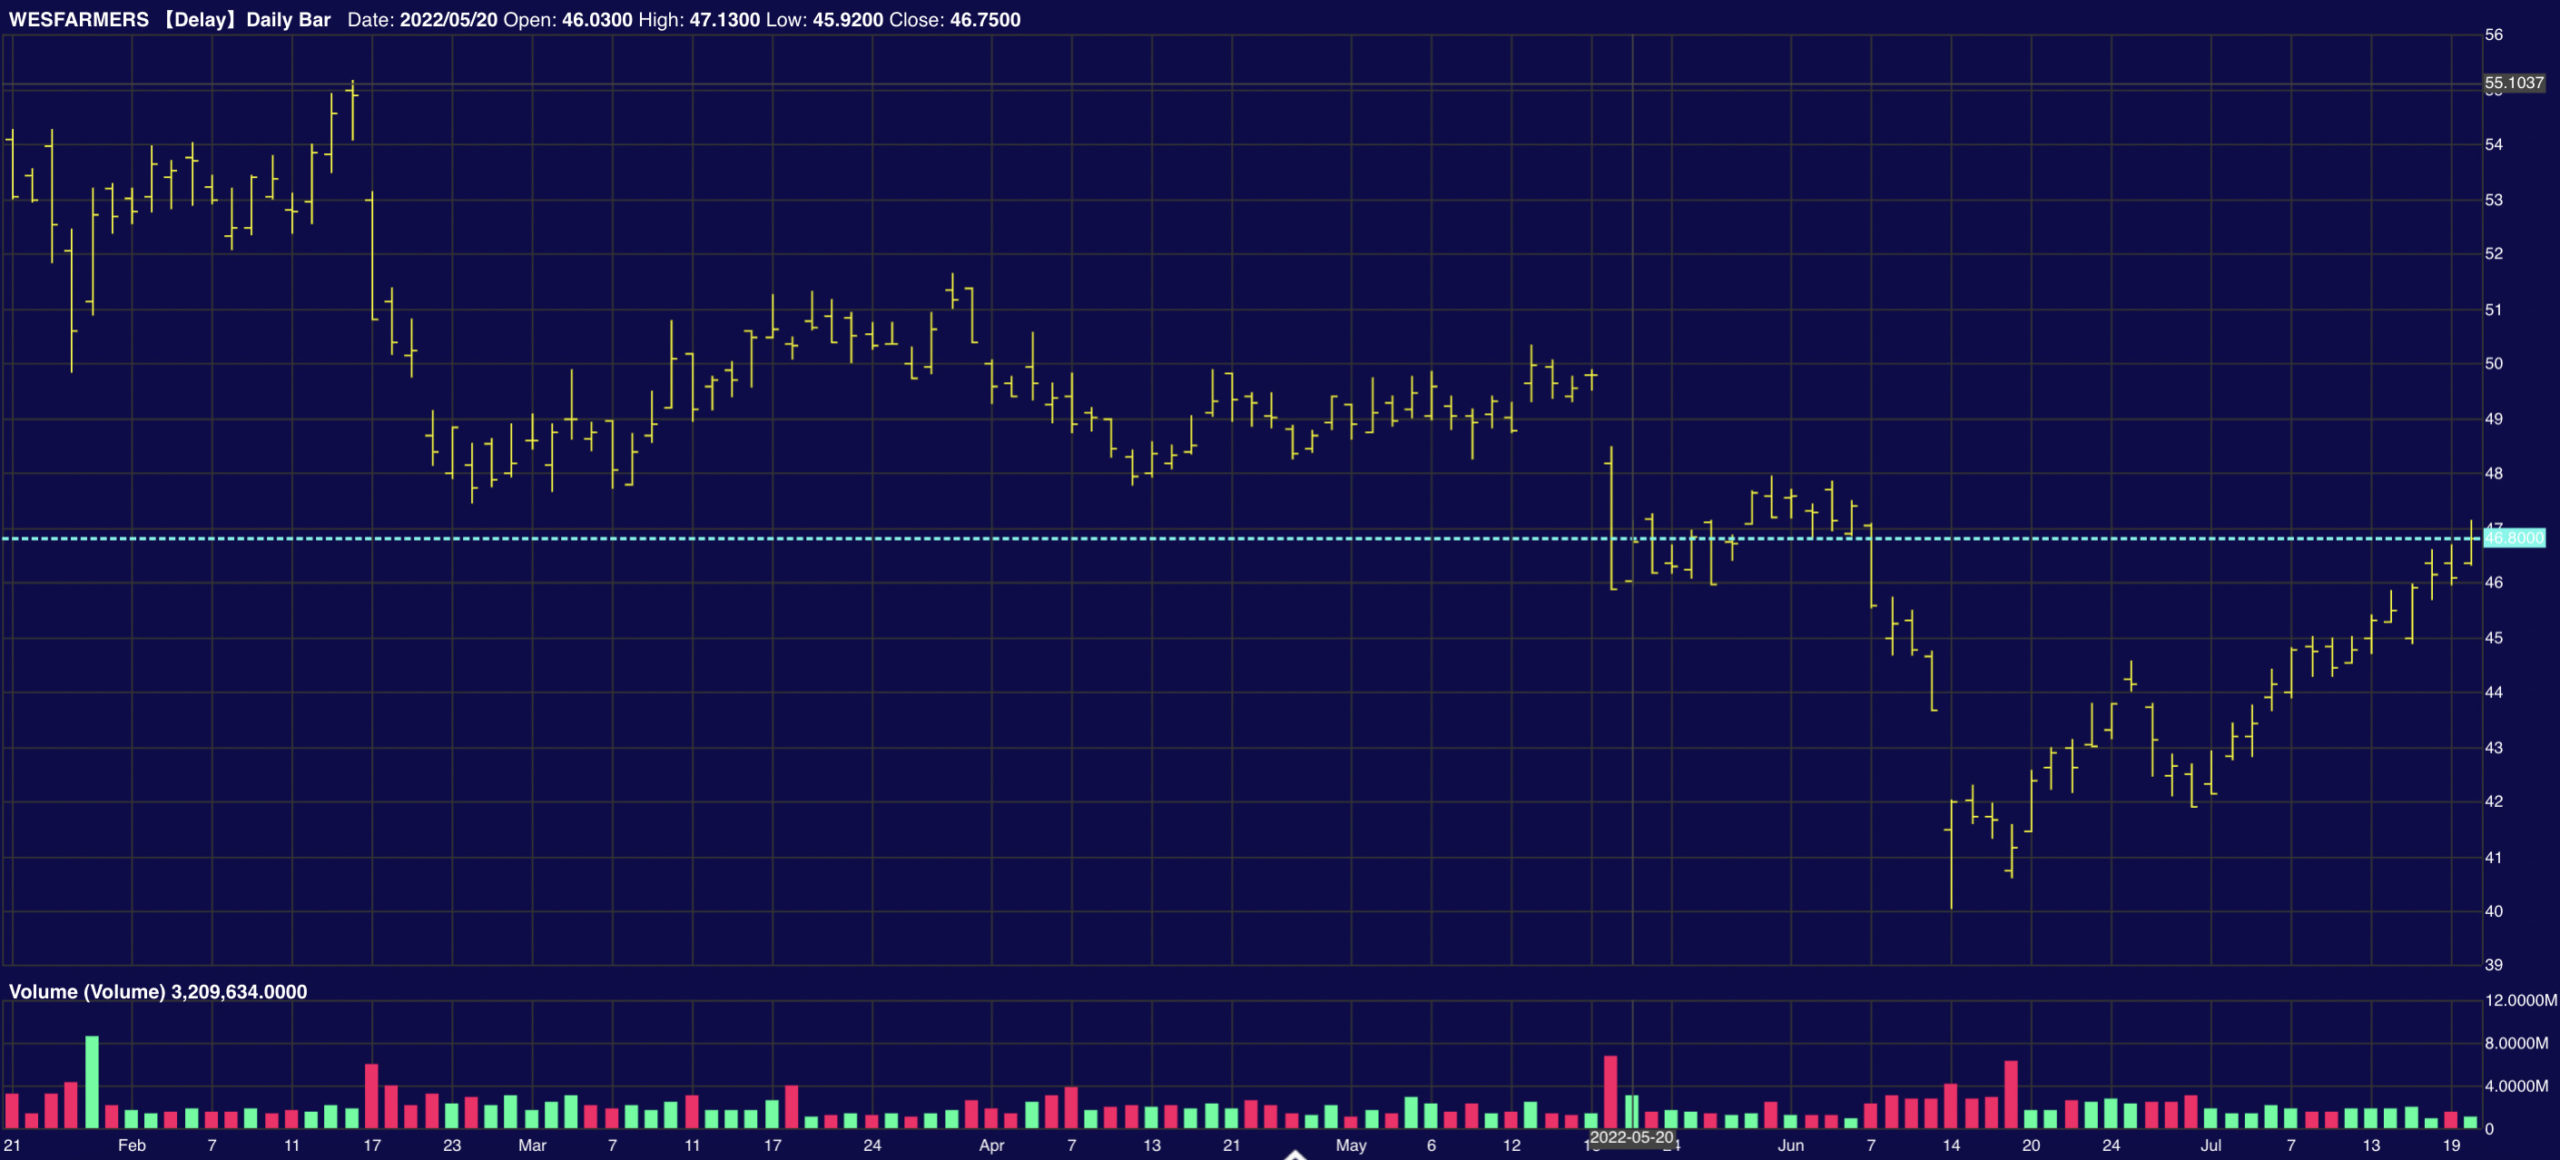
Chart 2: Wesfarmers
Here we’ve pulled out to 12 months, provides a better trajectory and visual immediacy of where the WES opp sits over time – the red line – is the turnover moving average. The TVMA is too complex for me to grasp – James knows – but I like to reduce it to this:
Bullish: when prices are above TVMA.
Bearish: when prices are below.
(My supposition would be wrong, by the way – as the TVMA is sitting well below the last closing.)
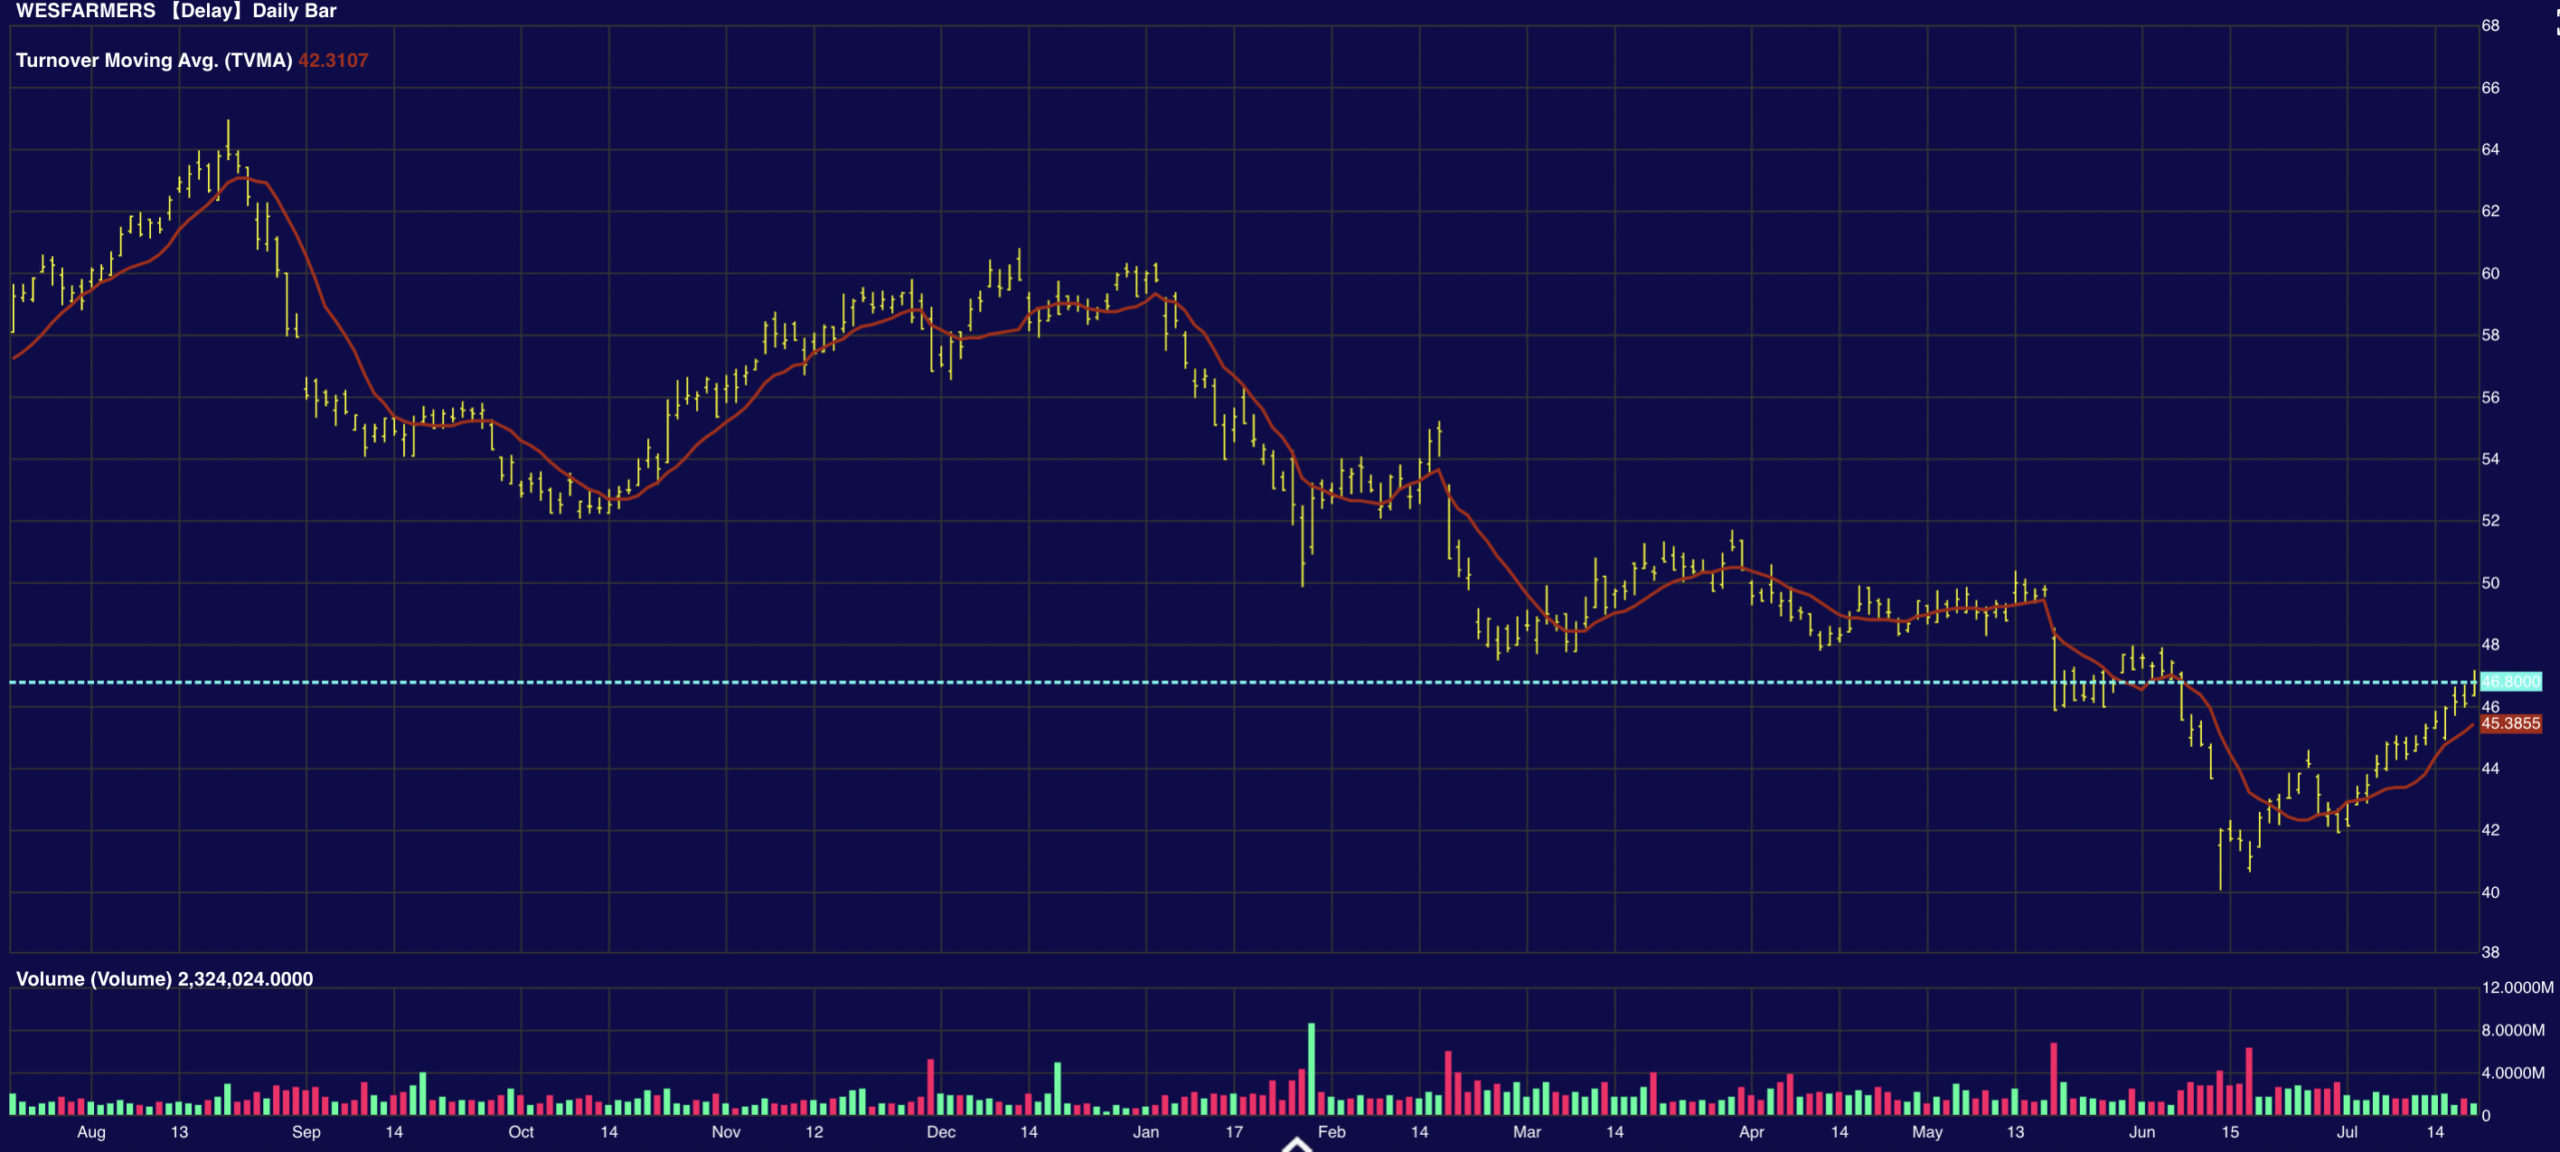
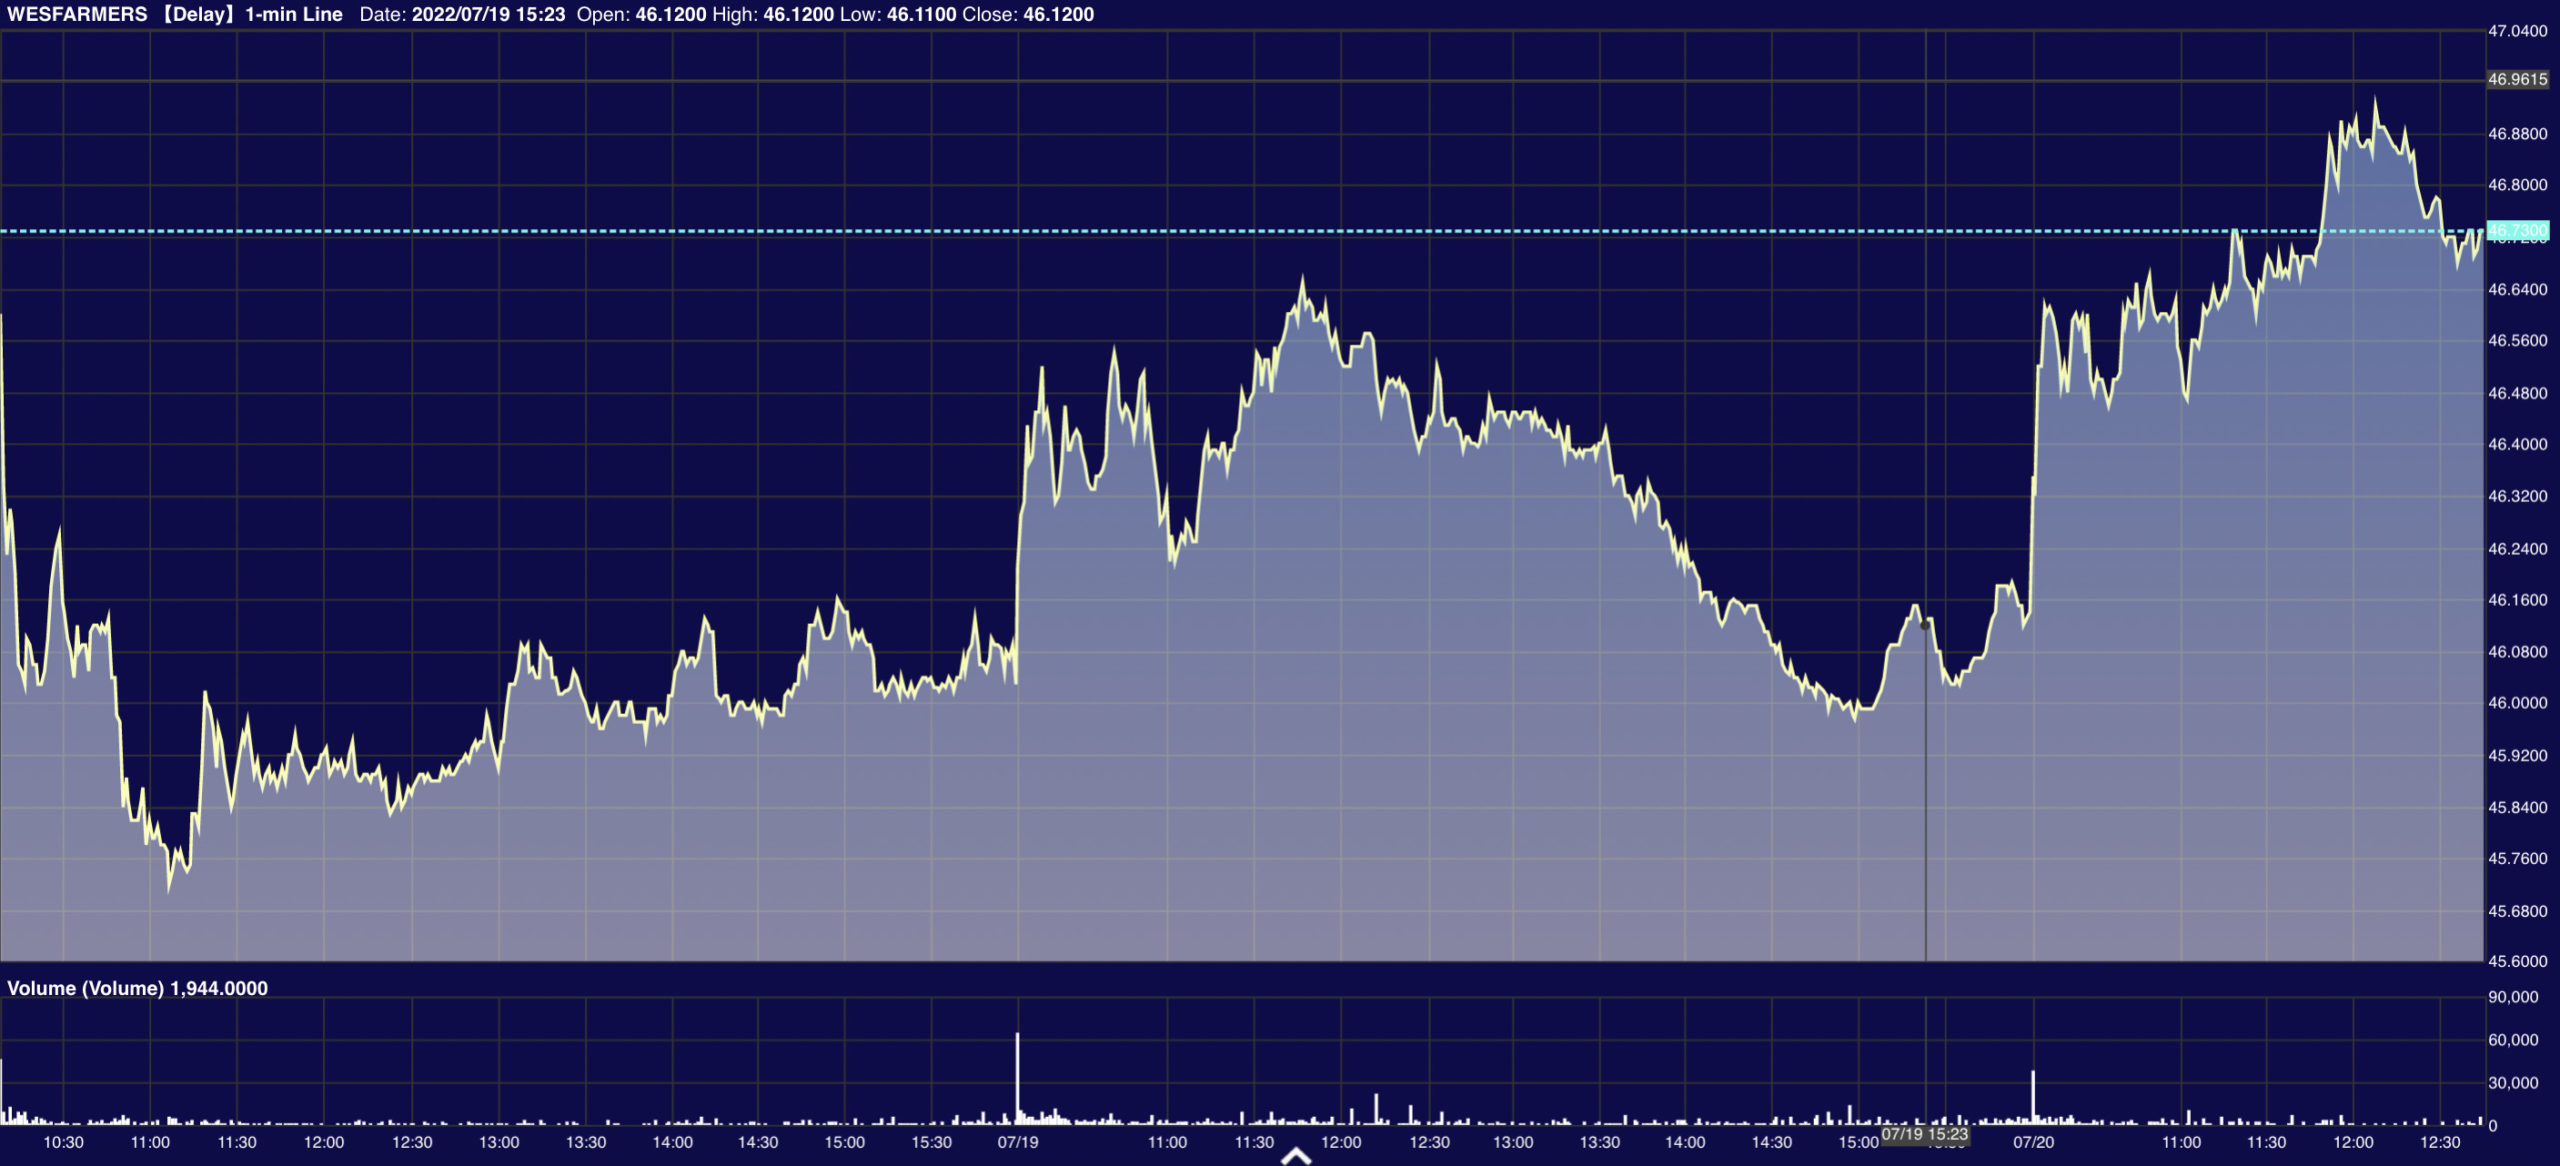
Chart 3: Wesfarmers
And this is the midweek trade WES. Pretty cool too. Very clear volume spikes. There’s a crosshair tracker around 3.23pm on the 19/7.
Lovisa Holdings (ASX:LOV)
James says Market Matters’ Emerging Company Portfolio had a solid week heading into Monday (up 4%):
“We did make some changes during that week too, cutting under performers to move into some better value stocks with potential catalysts – St Barbara and Lovisa. I’m just thinking back – Strandline (ASX:STA) rallied more than 15% and EML Payments (ASX:EML) bounced 10% and they led the portfolio. St Barbara (ASX:SBM) & Select Harvests (ASX:SHV) both fell more than 5% to be the weakest positions in the portfolio.
“Consumer Discretionary stocks have been sold off now right across the board on the expectation that a recession will put a lid on discretionary spending, that’s a pretty textbook play, however, as we’ve been trying to hammer home in a few of our more recent reports, we reckon there’s some pure value emerging in a few areas.
“And one of those is the low-cost jewellery business, Lovisa (LOV).”
(ED: If you wat to see what they make, I found a South African influencer!)
James says: “Doesn’t get too much more discretionary than this business, and it is in a strong position – probably looking to double earnings over the coming 12 months through an expanded store footprint in North America and Europe.
“Their customer base is unlikely to be impacted by higher rates and they may see increased demand as consumers start leaning toward lower-priced offerings for value, at the same time rising wages – including the minimum wage increase in some developed countries – will also boost disposable income for their target market.
“Lovisa’s got a market cap of circa $1.7b, and they aren’t just in the odd Westfield – LOV currently have around 600 stores with plans to add another 100 over the coming year.
“Their most recent sales update was positive with strong same-store sales growth and strong margins.”
– From Market Matters company (LOV) analysis
MM is bullish LOV ~$15
Chart 1: Lovisa Holdings
This is the MM daily bar chart. I added some dodgy colour schemes, just to let me see where volumes rose and fell. This kind of stuff is pretty easy to get the hang of.
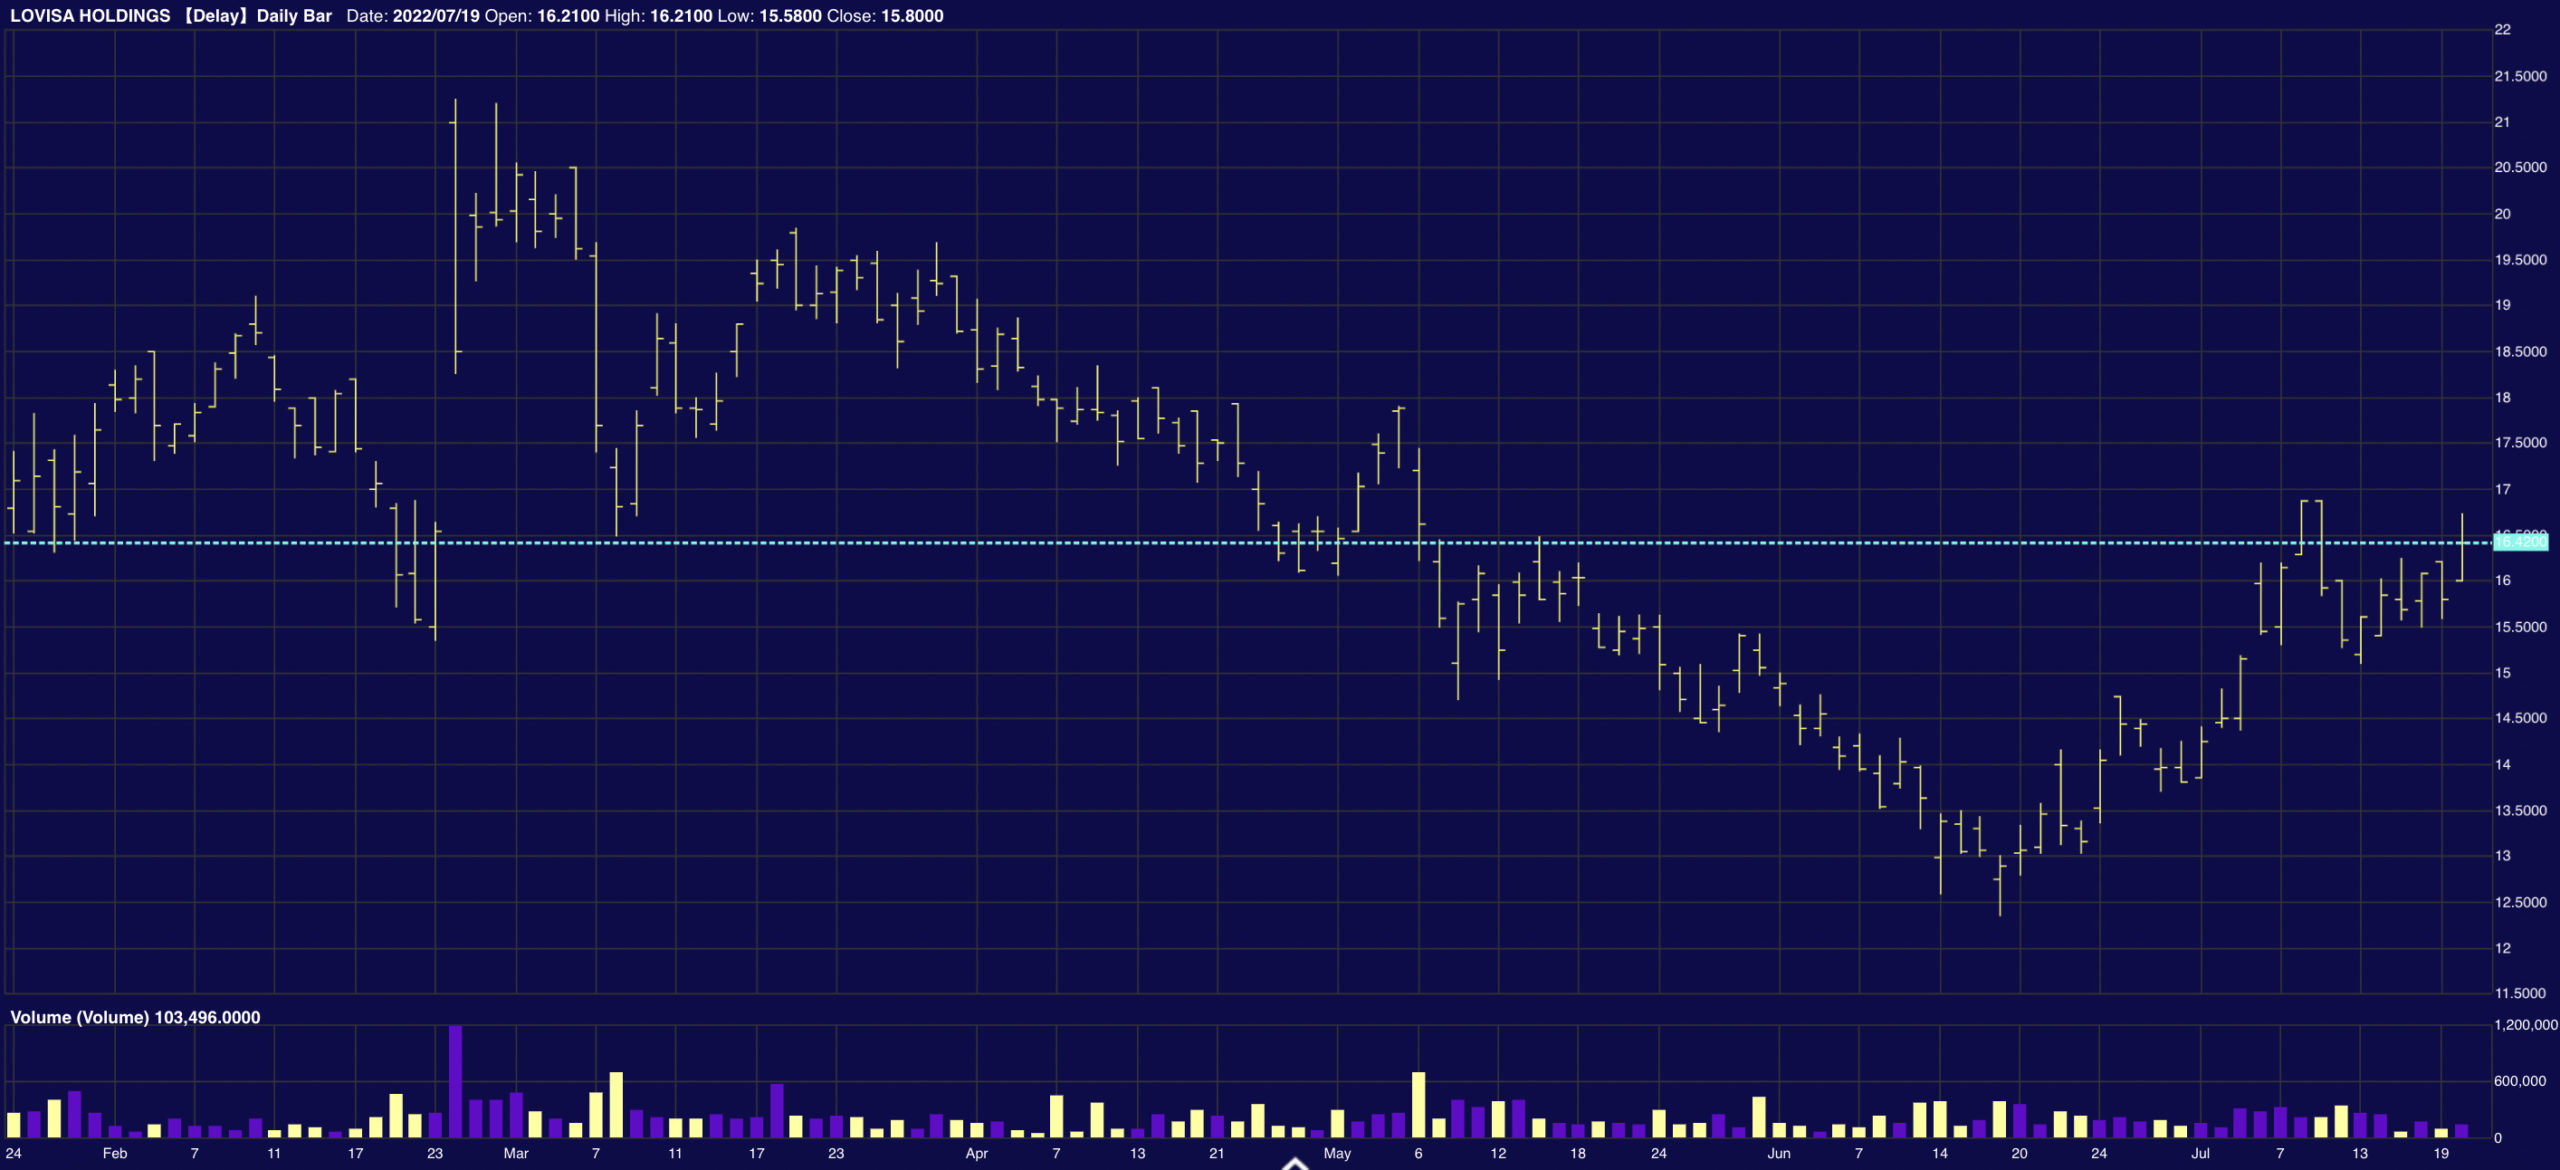
Chart: 2 Lovisa Holdings.
Same, same, but wanted to see from a bit further out…
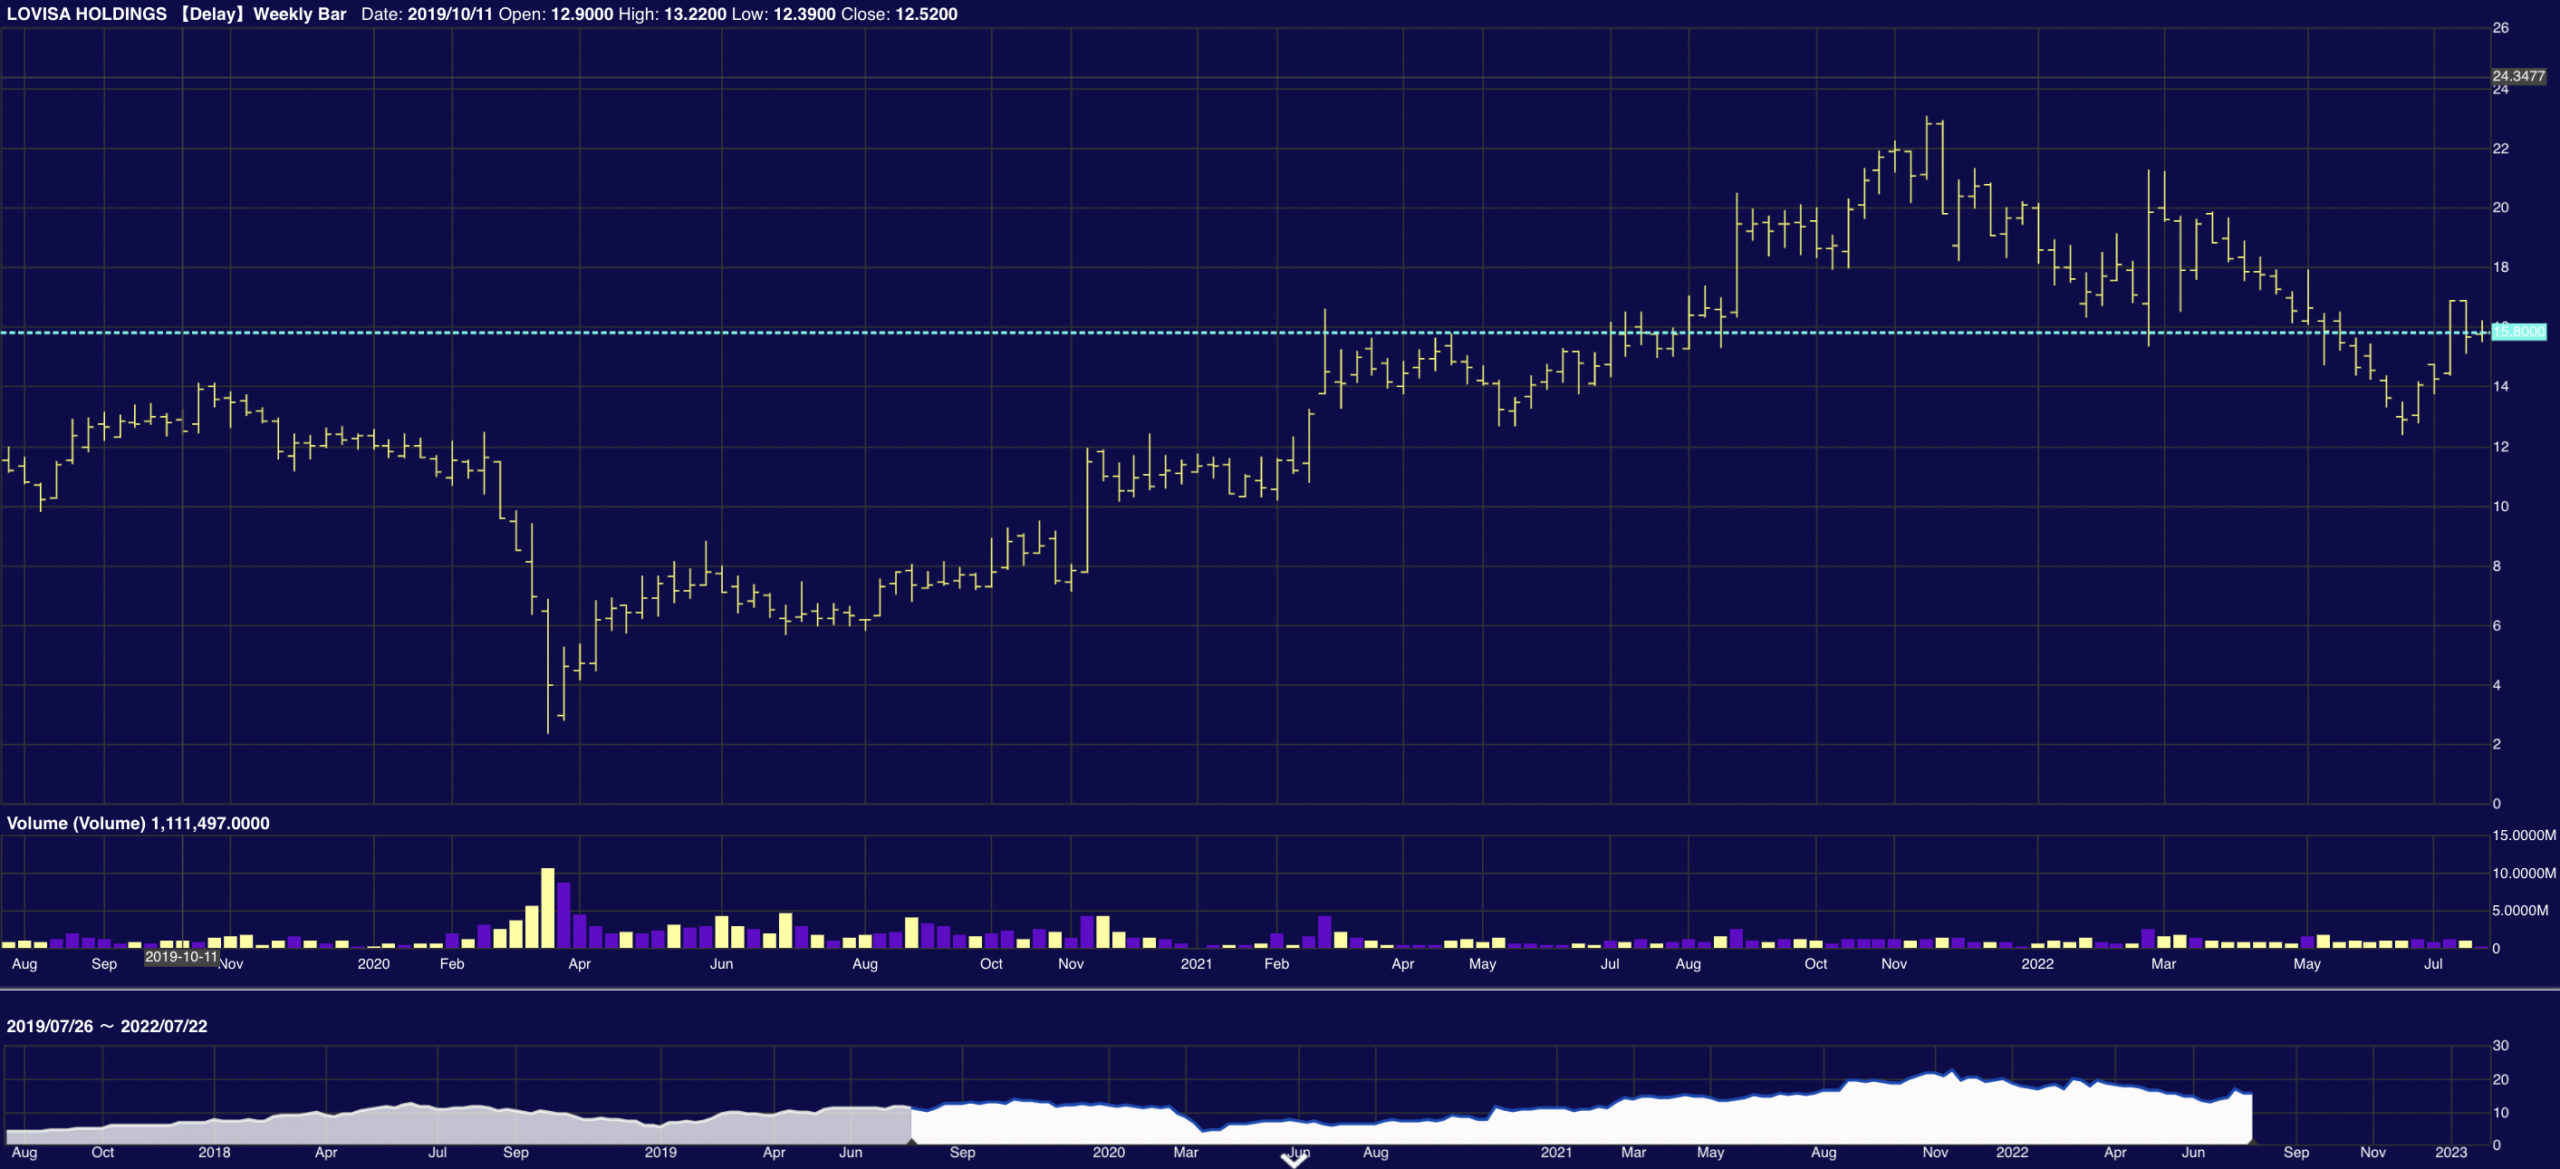
Chart 3 Lovisa Holdings
OK. This is handy too. Here’s the Full Year financials (ahead of FY22), the navy blue is net operating expenses.

The Trade Desk Inc (NASDAQ:TTD)
The Trade Desk is a US multinational tech firm which specialises in real-time programmatic marketing automation technologies, products, and services, designed to personalise digital content delivery to users. Basically it runs a software platform that allows for advertisers to buy digital screen time on various formats and devices within a real-time bidding system.
It’s headquartered in Ventura, California.
This one sits in the MM International Equities Portfolio
MM remains long & bullish TTD ~$US45
Chart 1: Trade Desk Inc (NASDAQ:TTD)
Daily candlesticks, volatility tracker and timeline volumes over 12 months:
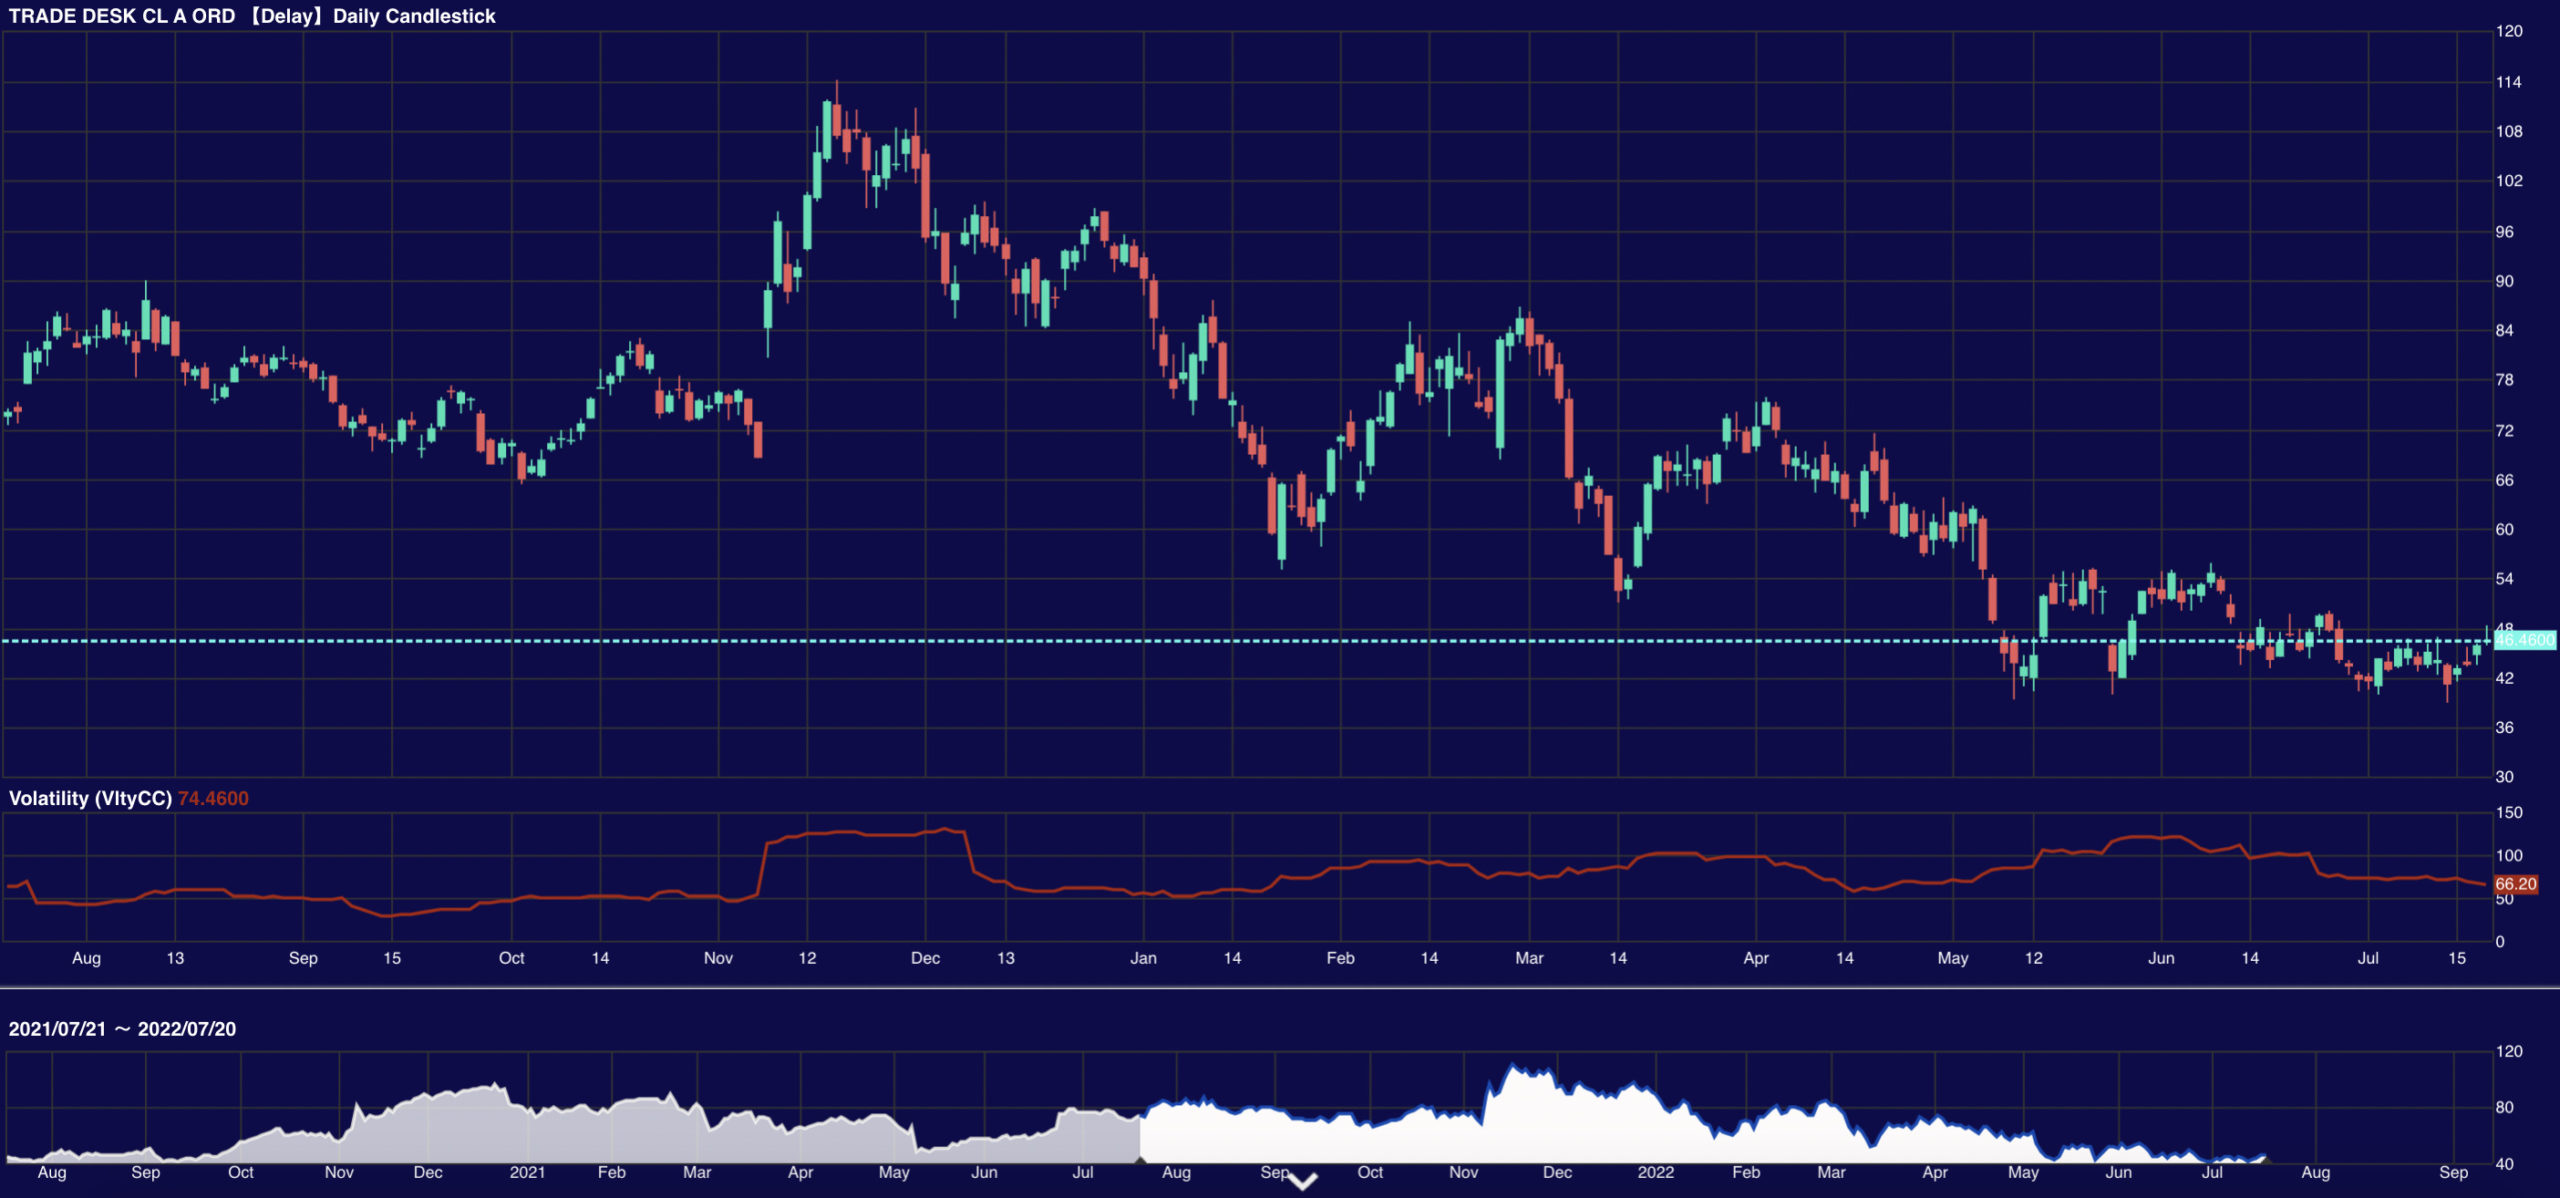
Chart 2: Trade Desk Inc (NASDAQ:TTD)
This one is the daily chart over the last month of trade, volumes:
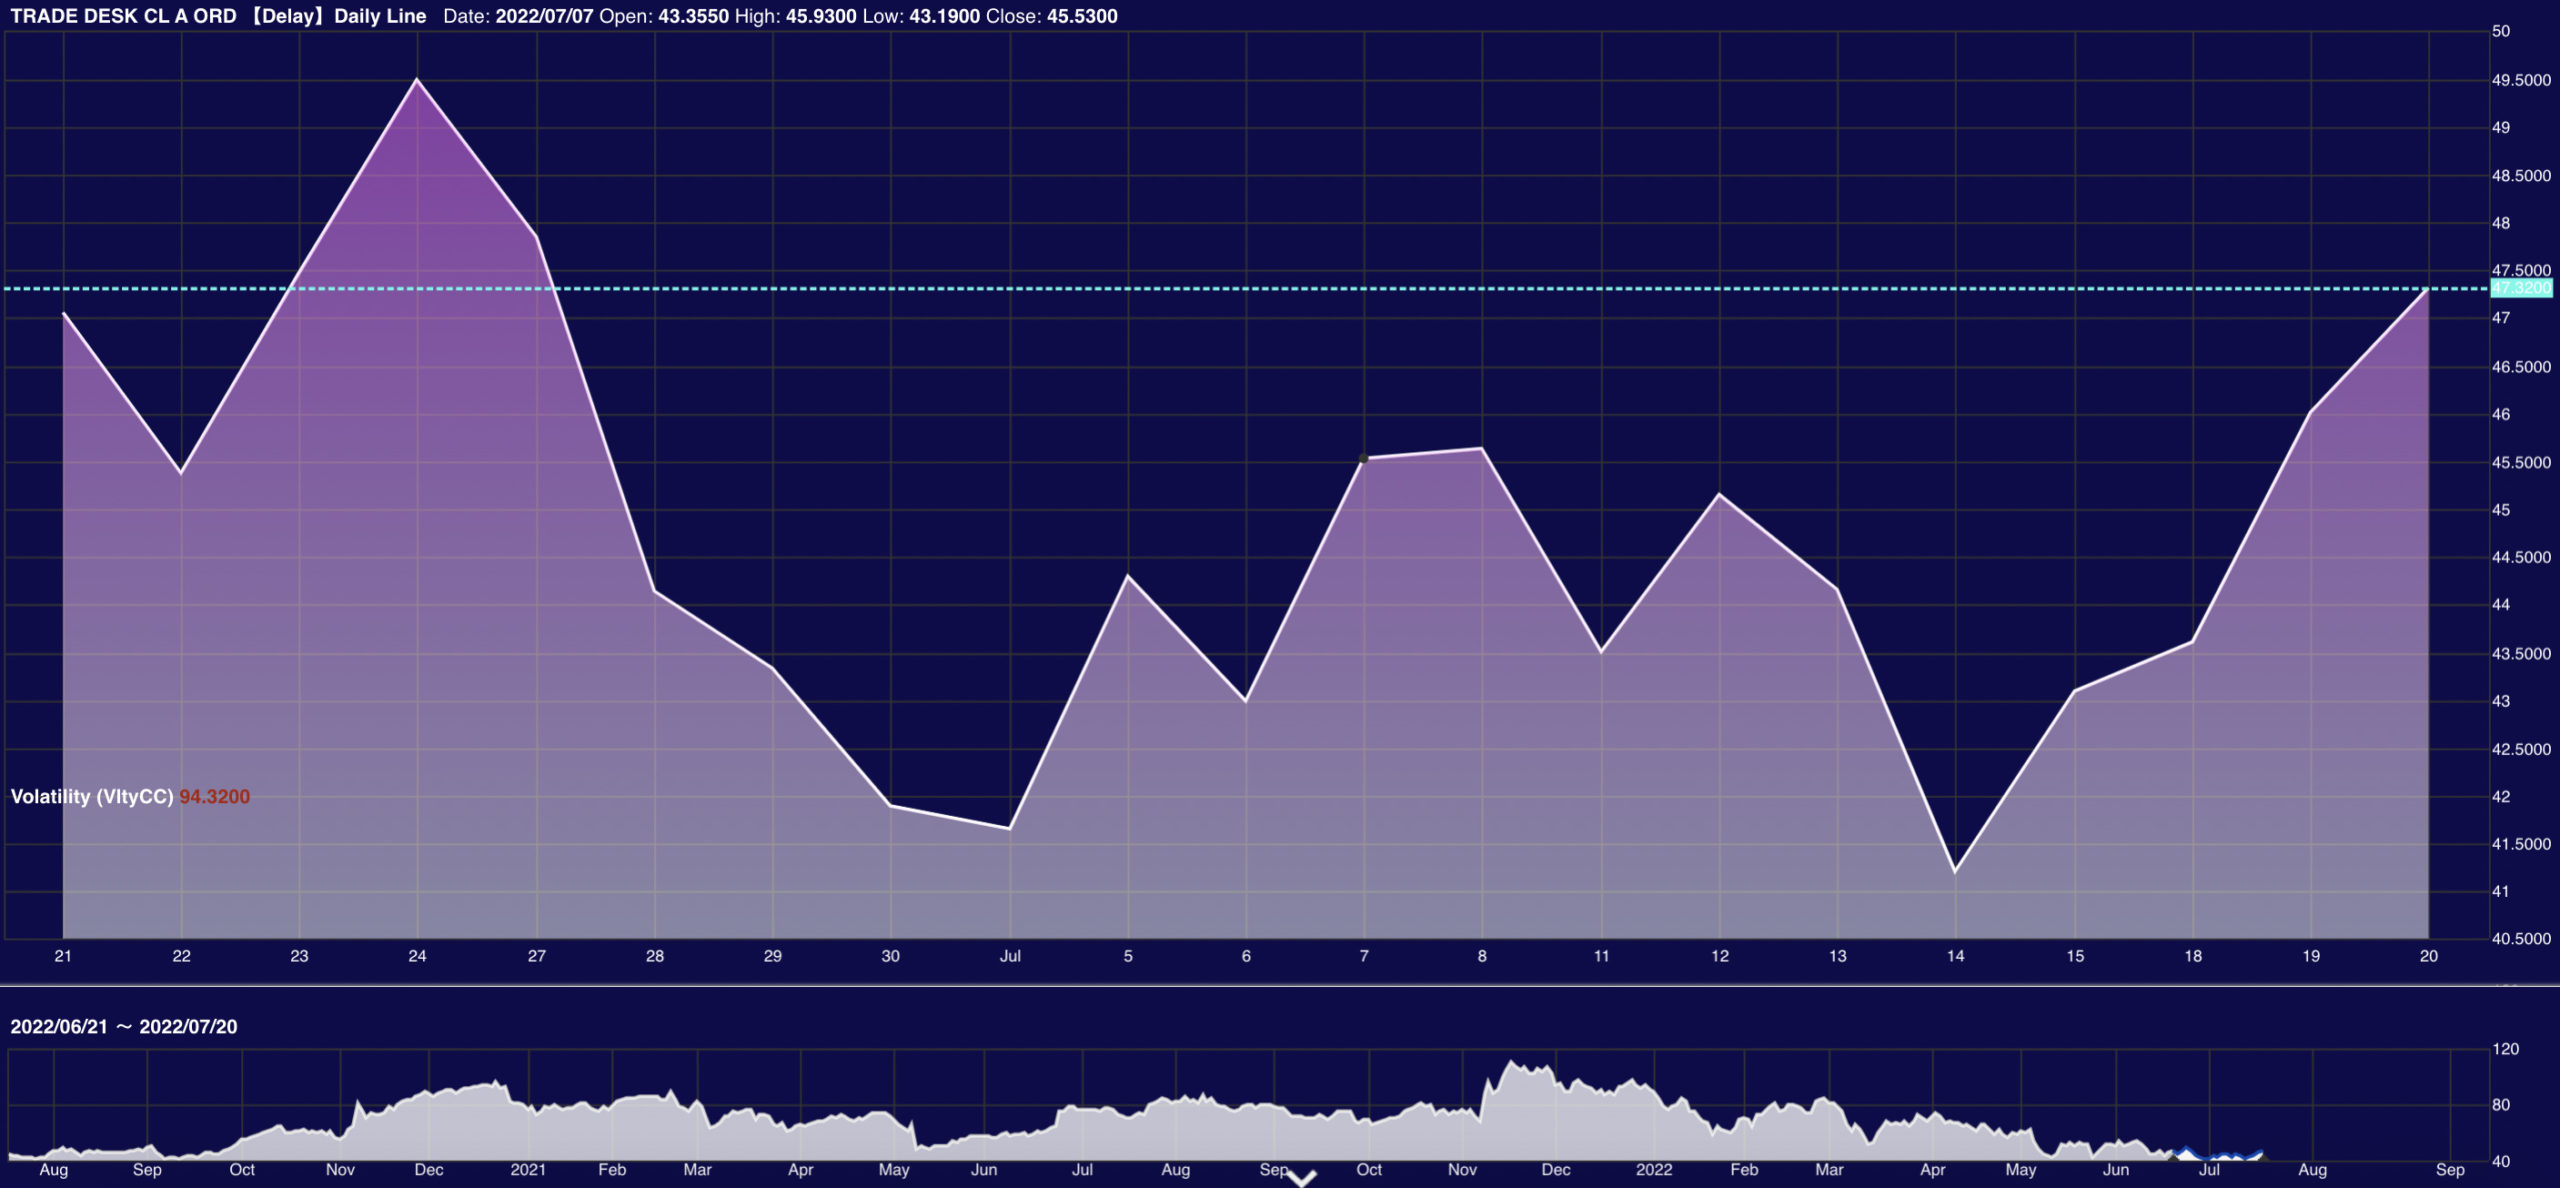
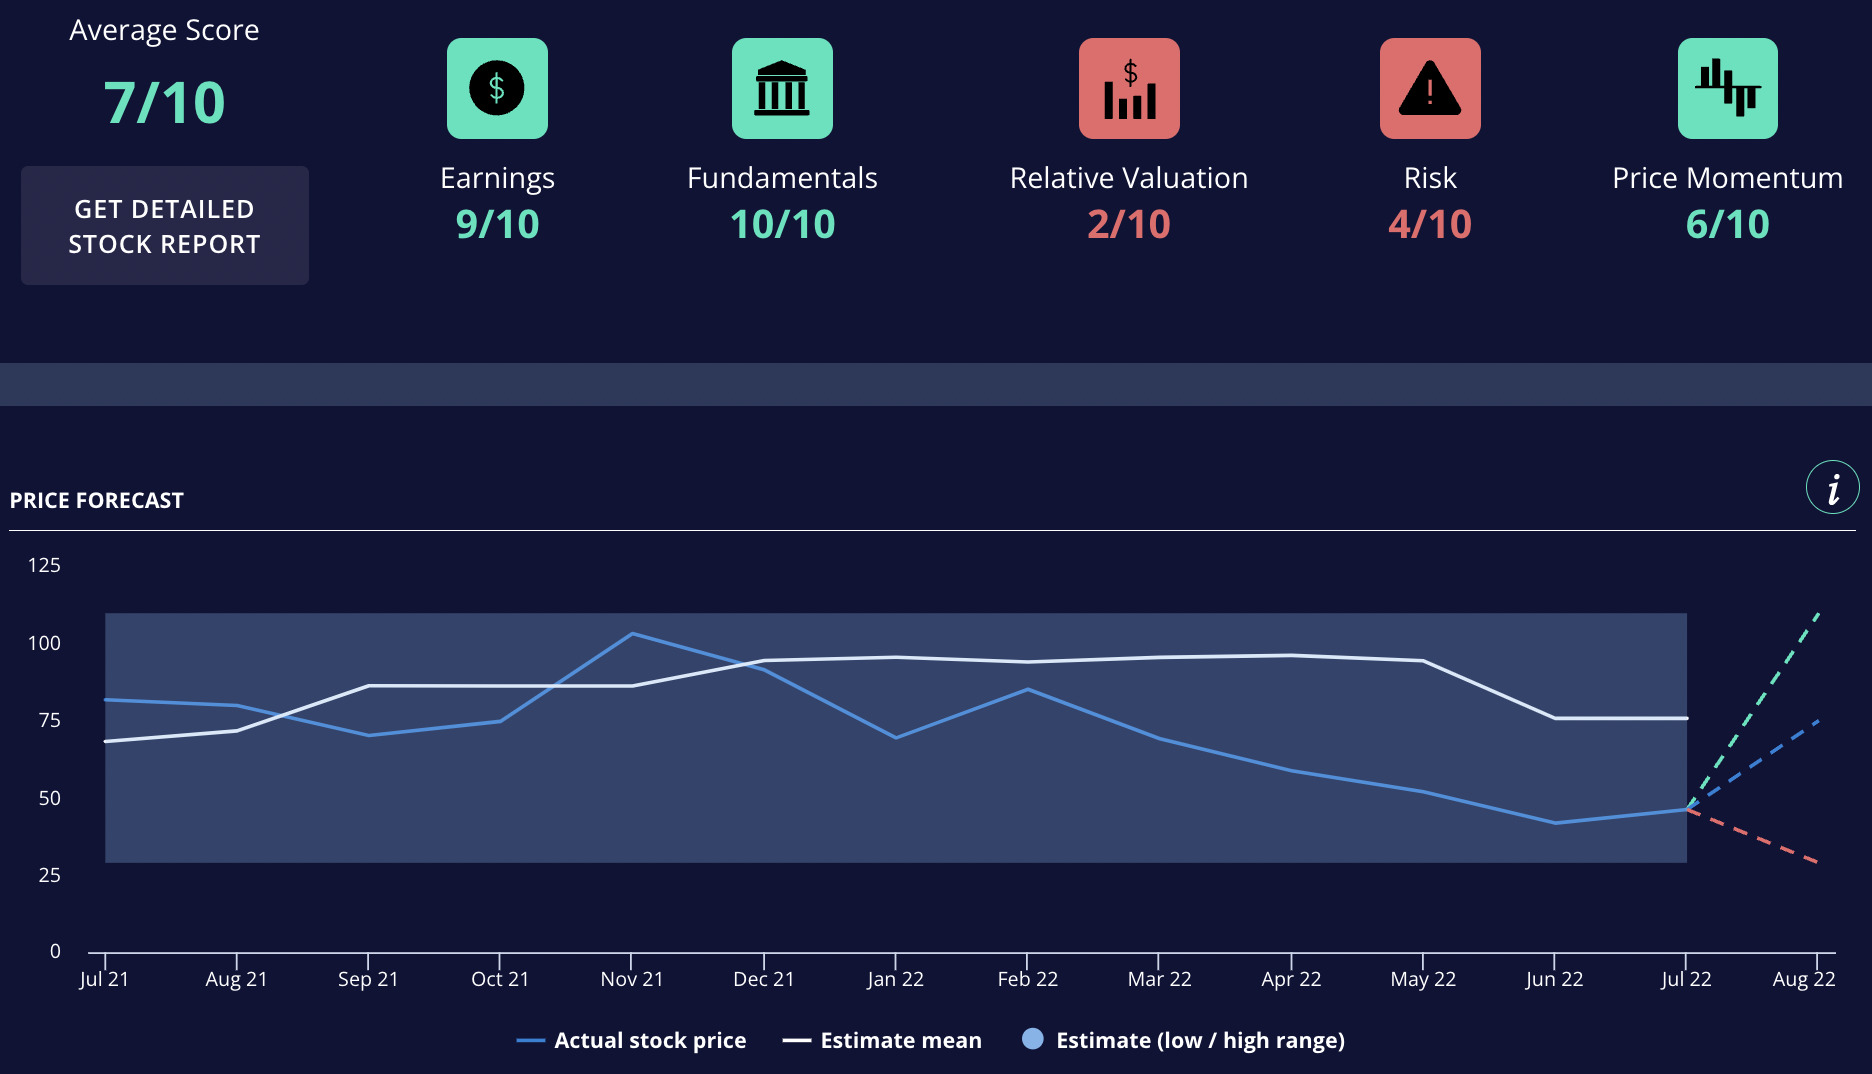
Chart 3: Trade Desk Inc (NASDAQ:TTD)
(ED:I got totally distracted watching the stock price rise – at 0100 Sydenham (Wed), TTD was up almost 6%.)
The detail below from James and the MM team is a bit which features a price forecast and a scorecard which I thought I’d add:
Homework Matters
James says: “Before you go, it’s about finding the stories you love:
“Like anything. Like life. Find the things you have a passion for and start exploring. Don’t get swept up in the romance of it, we’re all rooting for the little guys which can come good. What you want is to analyse why this story works and if it has legs.
“There’s a stack of books about storytelling and narrative theory. Ever since George Lucas explained the role Joseph Campbell’s study of mythology played in Star Wars, you can find just about anything. We’ll come back to that.
“First, it’s probably better to stay on song and dig up a bit on these three, why they’re solid choices. Or why WE think they are. Rationale is all on the site.
“Secondly, Vincent Price in Edgar Allen Poe’s… watch it!”
This article was developed in collaboration with Market Matters, a Stockhead advertiser at the time of publishing.
This article does not constitute financial product advice. You should consider obtaining independent advice before making any financial decisions.
Related Stories


UNLOCK INSIGHTS
Discover the untold stories of emerging ASX stocks.
Daily news and expert analysis, it's free to subscribe.
By proceeding, you confirm you understand that we handle personal information in accordance with our Privacy Policy.


