Guy on Rocks: $15,000/t in 2025? ALL the analysts are bullish on copper

Pic: Via Getty
- Strong uranium price is starting to filter down to equities with uranium-lithium explorer Infini Resources (ASX:I88) performing well on debut last week
- Analysts bullish on copper: Fitch Solutions sees 75% uplift over next two years, Bank of America predicts $15,000 a ton in 2025
- Goldman Sachs reckons there will be 500kt copper deficit in 2024
- Stock of the Week: Gladiator Resources
‘Guy on Rocks’ is a Stockhead series looking at the significant happenings of the resources market each week. Former geologist and experienced stockbroker Guy Le Page, director, and responsible executive at Perth-based financial services provider RM Corporate Finance, shares his high conviction views on the market and his “hot stocks to watch”.
Market Ructions: Yellow fever, more yellow fever and geopolitical tensions
Welcome back to the Stockhead faithful and fellow climate deniers for what looks like a volatile start to 2024, particularly on the geopolitical front with spot fires now spreading from the Gaza strip to the Red Sea and Yemen.
This has helped to underpin gold prices above US$2,000/ounce with gold moving above US$2050, (figure 1) for three straight sessions as air strikes on Houthi targets in Yemen look set to continue.
Unfortunately, the Federal Reserve wrecked gold’s train and was a little more circumspect about near-term interest rate cuts with gold retreating to US$2,027/ounce by mid this week.
This was partly in response to stronger than expected consumer data from the US which saw retail sales rising 0.60% over the month of December 2023 compared to consensus projections over around 0.40%.
Earlier inflation data was a little more supportive of gold with a 0.10% month on month decline in US producer inflation that provided some hope of an early interest rate cut from the Federal Reserve.
According to the CME FedWatch Tool, markets see a nearly 0% chance of easing in late January and a 50% chance in March.

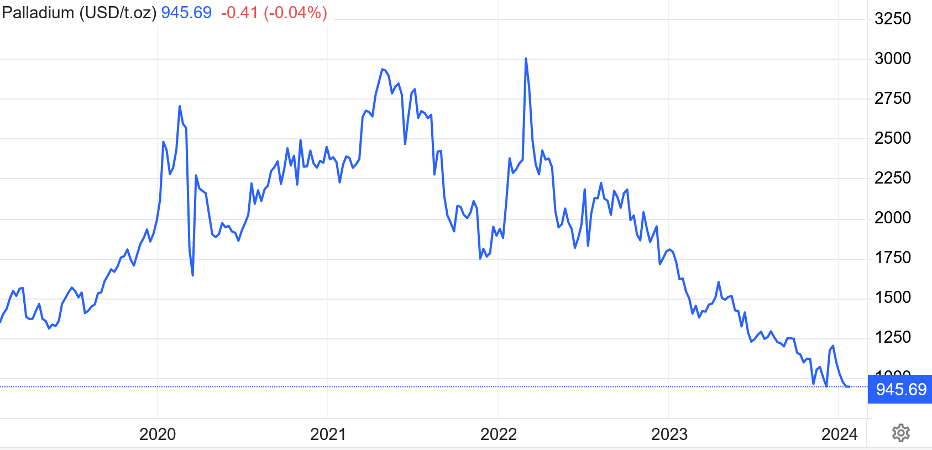
Palladium is again close to 5 ½ year lows reached in early December last year and is now trading at US$946/ounce as a surplus of around 300,000 ounces is projected over CY 2024 (deficit of 200,000 tonnes in CY 2023).
Platinum has also had a soft start to 2024 dropping below US$899/ounce despite the World Platinum Council projecting a supply deficit of 540,000 ounce this year.
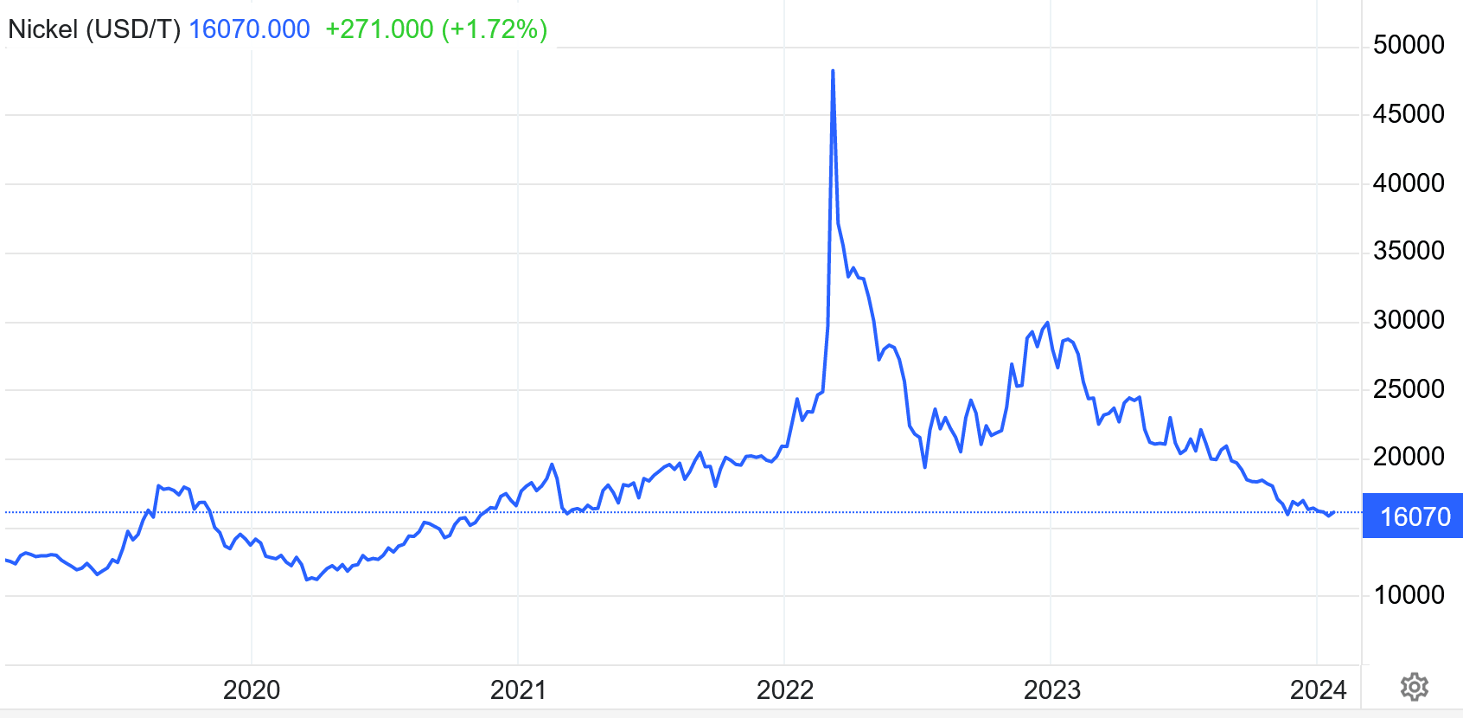
One commodity that isn’t travelling so well is nickel (figure 3), courtesy of a ramp up in Nickel laterite production out of Indonesia.
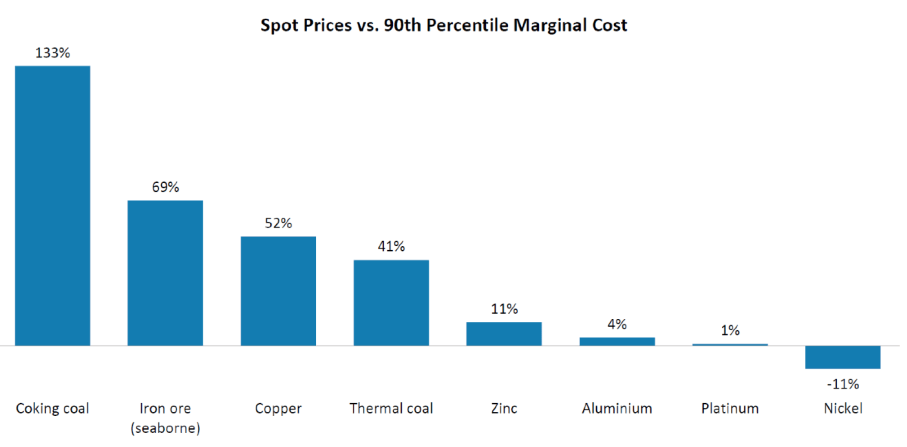
With nickel prices down almost 50% over the last 12 months Morgan Stanley paint a bleak picture of operating margins for nickel producers (figure 4).
Canadian miner First Quantum Minerals announced last week that it will stop mining and lay off over around one third of its workers at its Ravensthorpe nickel mine (18Kt of nickel produced in FY 2023) in WA’s southeast.
Processing of stockpiles over the next 18 months however will continue.
This follows on from Panoramic Resources Ltd (ASX:PNR) decision a couple of weeks ago to cease production at its 100% owned Savannah mine in Western Australia with around 140 jobs and 200 contractors likely to be laid off.
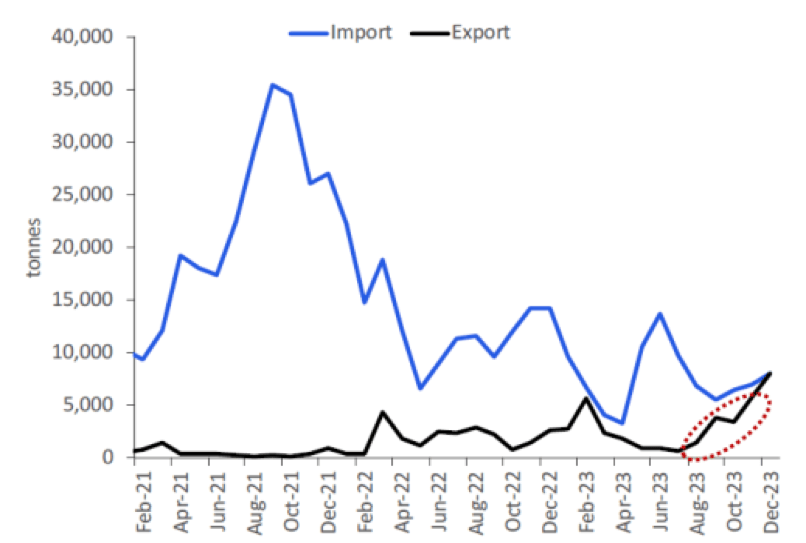
According to Bloomberg data however there appears to be an increase in Class 1 nickel exports from China in late CY 2023 which partly explains the increase in LME Asian warehouses (figure 5).
The trend in nickel producers increasing conversion products has seen a >20% increase in refined nickel production over the last 12 months.
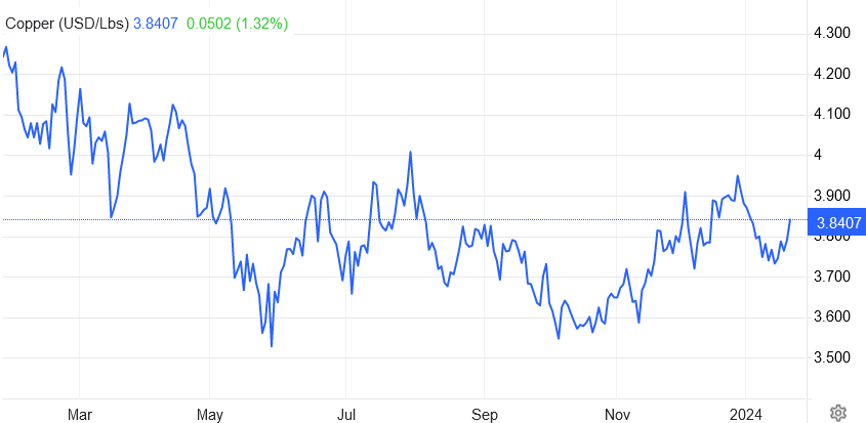
Three-month Copper futures (figure 6) moved back towards $3.84 per pound level bouncing off three-month lows of US$3.73/lb.
Much hangs on China which is doing its best to stimulate the economy recently lending CNY 350 billion to other state policy banks.
The Shanghai Futures Exchange however is seeing an 8% increase in inventories to 33,130 tonnes over the first week of January.
Many commentators however remain bullish on the medium-term outlook for copper with Fitch Solutions (January 2024) believing that copper will soar more than 75% over the next two years driven by supply disruptions and higher demand for the metal.
Plans to triple global energy capacity by 2030 (COP28) and rate cuts by the Federal Reserve are also likely to be a key driver according to Bank of America Securities’ head of Asia -Pacific basic materials, Matty Zhao, in a recent interview with CNBC.
This would potentially push copper prices to $15,000 a ton in 2025, the report added, significantly higher than the record peak of $10,730 per ton scaled in March 2023.
Fortune Business Insights recently stated that the global copper mining market size, which was valued at US$8.4 billion in 2022 is forecast to grow from to US$11.2 billion by 2030. Goldman Sachs are also bullish on copper and are anticipating a 500,000 tonne deficit in 2024.
Supply disruptions are the order of the day with First Quantum Minerals halting production at the Cobre Panamá in November last year following a Supreme Court ruling and nationwide protests over environmental concerns.
Anglo American, also stated that it was likely to cut copper output in 2024 and 2025 as part of a broader cost cutting strategy.
Uranium (figure 7) managed to breach US$100/lb late last week with China building 22 of the planned 58 global reactors.
The spot price was hovering around US$106/lb by the middle of this week. Japan is also restarting reactors and Finland is proposing to build Europe’s first new reactor in over a decade.
Utilities have responded to the tight uranium market and have signed contracts for 160 million pounds of U3O8 in 2023, the most since 2012.
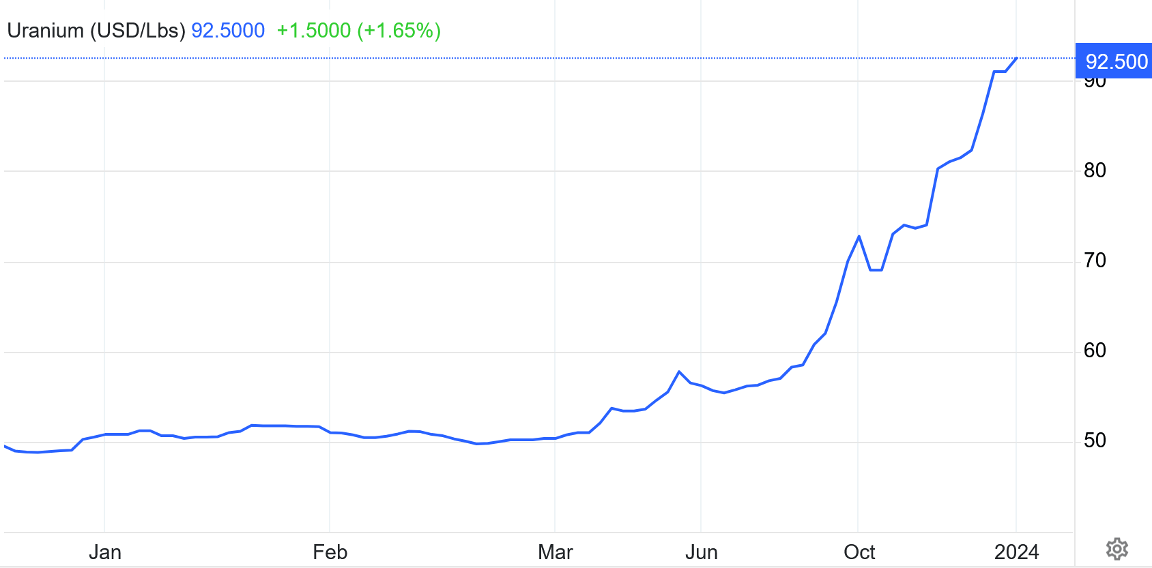
Late last week, Kazatomprom, the world’s largest uranium miner accounting for around 27% of global output, announced that it was likely to fall short of its production targets over the next two years due to a shortage of sulphuric acid.
The strong uranium price is starting to filter down to equities with uranium and lithium explorer Infini Resources (ASX:IFI) listing last Monday at 20 cents and finishing the week at 34 cents.
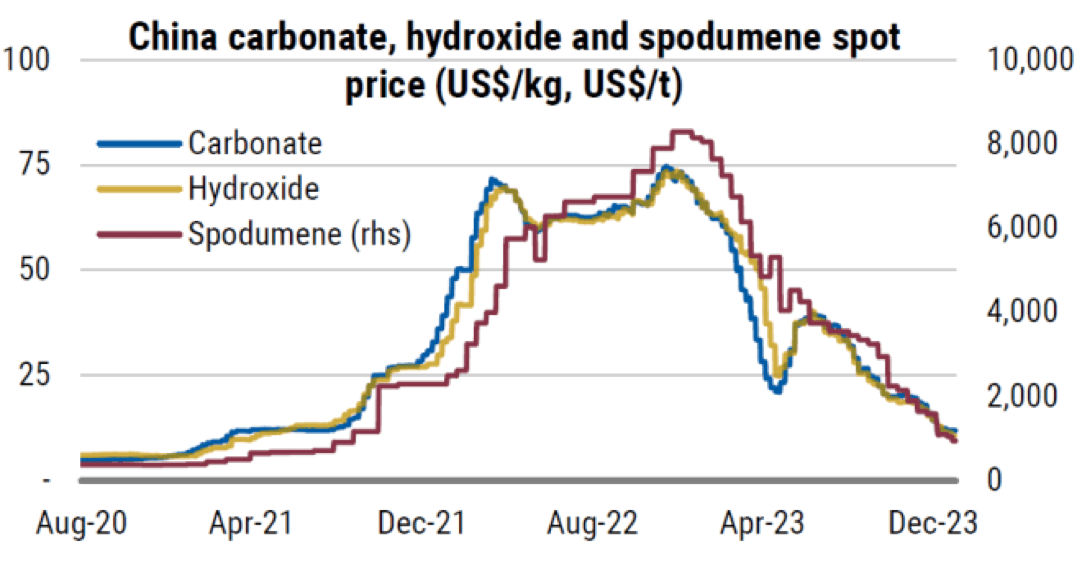
Finally, lithium prices (figure 8) have been hammered as consumers re-assess their attitude towards EV’s. In December, S&P Global Commodity insights noted that the proportion of consumers in key markets that were open to purchasing an EV dropped to 67% in 2023, from 71% in 2022 and 86% in 2021.
After reaching all-time highs of US$81,360/tonne in late CY 2022, lithium carbonate prices in China have fallen to US$20,782 per tonne with lithium hydroxide also struggling as nickel-cobalt-manganese batteries (NCM) lose market share to lithium iron phosphate (LFP) batteries.
Stock of the Week: Gladiator Resources (ASX:GLA)

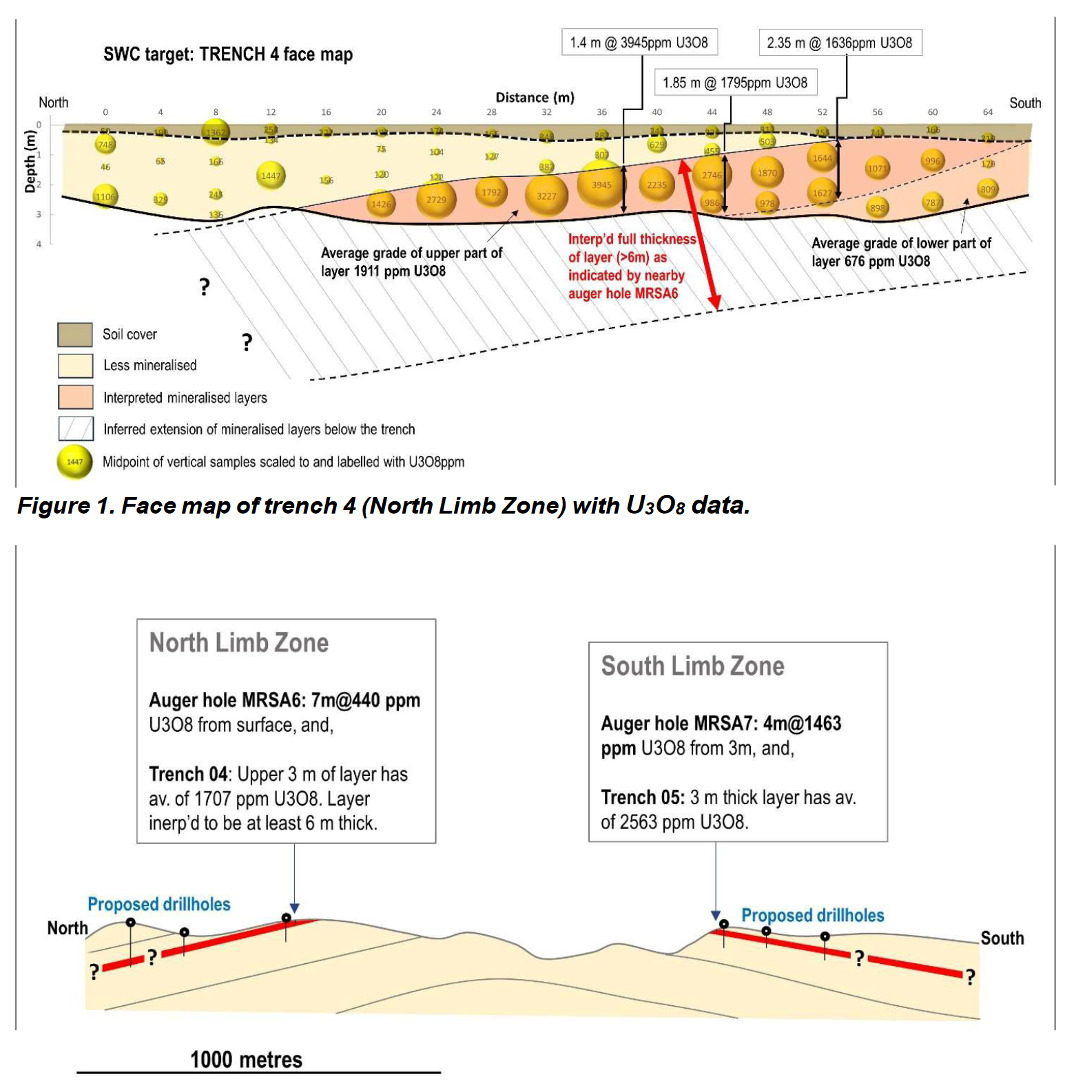
I mentioned Gladiator Resources Ltd (ASX: GLA) as an interesting Tanzanian uranium explorer to keep an eye on in November last year. The Company has had a couple of interesting announcements this year including some high-grade trenching results from sandstone hosted uranium mineralisation at the Southwest Corner project including;
o 1.40m with an average grade of 3170ppm U3O8 in Trench 2
o 1.40m with an average grade of 3945ppm U3O8 in Trench 4
o 1.40m with an average grade of 4442ppm U3O8 in Trench 5
o 0.75m with an average grade of 7139ppm U3O8 in Trench 5
The mineralisation, according to the Company, is similar in style to the Nyota deposit 50 km to the north (Measured and Indicated Mineral Resource Estimate of 124.6 Mlbs U3O8). Radiometric surveys, according to GLA, appear to support an interpretation that the layers at the North and South Limb zones could have a combined strike length in the order of 3 km which remains open down dip (figure 11). Follow up aircore drilling is due in Q2 2024.
The Company also reported some elevated uranium results from the Minjingu Project (figure 12) in soft sand-clay layers within 4 metres of surface. Two samples from pits 100m apart at the north end of the area covered by pitting – potentially the mineralized zone extends north of this. Auger drilling is planned later this year to test the configuration of mineralised layers.
Based on the last Quarterly the Company will no doubt be looking to raise funds shortly however given the momentum behind uranium explorers, I don’t believe this will be a problem. There are around 50m unlisted options with a strike price of 2 cents so I imagine that a trickle of option exercises may provide enough funding in the short term ahead of a larger capital raising late in the year. At an enterprise value of around $16 million, and some recent share price volatility helped along by a surging uranium price, this is definitely one to keep an eye on.

At RM Corporate Finance, Guy Le Page is involved in a range of corporate initiatives from mergers and acquisitions, initial public offerings to valuations, consulting, and corporate advisory roles.
He was head of research at Morgan Stockbroking Limited (Perth) prior to joining Tolhurst Noall as a Corporate Advisor in July 1998. Prior to entering the stockbroking industry, he spent 10 years as an exploration and mining geologist in Australia, Canada, and the United States. The views, information, or opinions expressed in the interview in this article are solely those of the interviewee and do not represent the views of Stockhead.
Stockhead has not provided, endorsed, or otherwise assumed responsibility for any financial product advice contained in this article.
Related Stories


UNLOCK INSIGHTS
Discover the untold stories of emerging ASX stocks.
Daily news and expert analysis, it's free to subscribe.
By proceeding, you confirm you understand that we handle personal information in accordance with our Privacy Policy.


