Fear and Greed: Who’s bearish (Peter Brandt) and who’s bullish (Glassnode) on Bitcoin right now?

Getty Images
There’s no small amount of disquiet and uncertainty in markets, at present. And for that, we largely have the US and its debt-payment issues to thank. It’s certainly giving crypto investors the heebie jeebies.
But who’s looking particularly bearish, or at least halfway bull-snortingly optimistic right now? There are still plenty on both sides of the ledger, although from what we’re seeing across Crypto Twitter and other social media, the bears have the edge.
Not that you’d know that from a mere glance at the market’s leading sentiment indicator, though, because that still appears to be a pretty even split…

How boring. But it certainly neatly graphically reflects the caution in the market from investors. Expect more of the same until the debt-ceiling negotiations become a little clearer.
In the meantime, here are a couple of slightly more interesting takes, based on technical chart-reading and data analysis from a couple of people who seem to know what they’re talking about.
In the red corner, weighing in at 696 Twitter followers and nearly 50 years of trading experience, we have Peter “I Once Called the Bitcoin Top and I’m Never Going to Let You Young Punks Forget That” Brandt…
Brandt waves the red flag
Peter Brandt, who is indeed something of a revered figure in the world of financial markets trading and analysis, has spotted something a little disconcerting regarding the potential price movements of Bitcoin (BTC) in the short term.
It’s a “pennant or flag”, which he says has “short term bearish implications unless negated by close above mid-point highs”.
This is known as a pennant or flag and has short term bearish implications unless negated by close above mid point highs. $BTC pic.twitter.com/kLz6aTHMrz
— Peter Brandt (@PeterLBrandt) May 24, 2023
In English, what that essentially means is he’s spotted a continuation pattern for Bitcoin that could well see the asset about to take a leg or two lower.
Bummer, crypto dudes. But… but hang on, he said “short term”, right? Is he also telling us there’s a chance that everything will work out fine beyond that?
That’s not necessarily what he’s saying, as being hindered by not actually being from the future, he’s not saying anything with 100% certainty. He did note this the other day, however…
Perhaps one more shake out break, then thrust higher. But hey, that’s just a guess, and guessing is the best we have to offer. If anyone is dogmatic about their brilliance, turn and run, protecting your wallet. pic.twitter.com/bnJN1zpzaH
— Peter Brandt (@PeterLBrandt) May 22, 2023
… as well as this:
“Shocking news just in. Charts and technical analysis are NOT reliable for price forecasting. To you hot shots who think you have something magic, let’s hear from you in 10 years.”
Okay then… let’s hear from someone else and look at some other data points… In the green corner, weighing in at about 508k Twitter followers, we have Glassnode and its pseudonymous co-founder…
Glassnode’s Negentropic reckons ‘bottom is in’
“Negentropic”, which is the pseudonym used by one of the founders of popular crypto/blockchain analytics firm Glassnode, is one of the more positive Crypto Twitter accounts that’s easy enough for us to dig up to potentially counter the bearish outlook.
As he notes in the tweet below, he is of the belief that a bottom has formed for BTC, and that it’s just a matter of time now before another rally.
He’s basing that on the 200-day SMA (simple moving average) support line holding strong, whereas another moving average momentum indicator, the 50-day SMA, is on the verge of crossing the 200 SMA, which would apparently be a bullish sign.
#Bitcoin bottom is in
Shorts getting exhausted after failing numerous attempts to break below 200SMA, which is a solid support.
50SMA bullish crossover over 200SMA, it's a matter of when #BTC goes off https://t.co/pfyjsmCGyE pic.twitter.com/ZmKVQiQwYz
— 𝗡𝗲𝗴𝗲𝗻𝘁𝗿𝗼𝗽𝗶𝗰 (@Negentropic_) May 22, 2023
Admittedly, he posted that one a couple of days ago, however, further tweets overt the past 48 hours maintains his generally bullish thesis for the leading digital asset from a technical standpoint.
Regarding the dippage we’re seeing from BTC and the crypto market as a whole so far this week, he writes:
Is the dip what we need to go higher? #Bitcoin
Over 3k $BTC waiting to be bought below $26k. Talk about a bottom and a 3-to-1 Reward to Risk ratiohttps://t.co/99QwUJIuBa pic.twitter.com/kmgZrzqoFi
— 𝗡𝗲𝗴𝗲𝗻𝘁𝗿𝗼𝗽𝗶𝗰 (@Negentropic_) May 24, 2023
Coinhead quite likes this chart he (courtesy of his market newsletter Swissblock) also posted – just in case you needed a reminder of how well Bitcoin has performed, compared with other asset classes, over the past 10 years.
Fade BTC if you must, but the asset, on the whole, has undeniably been a pretty amazing success story for a long time now.
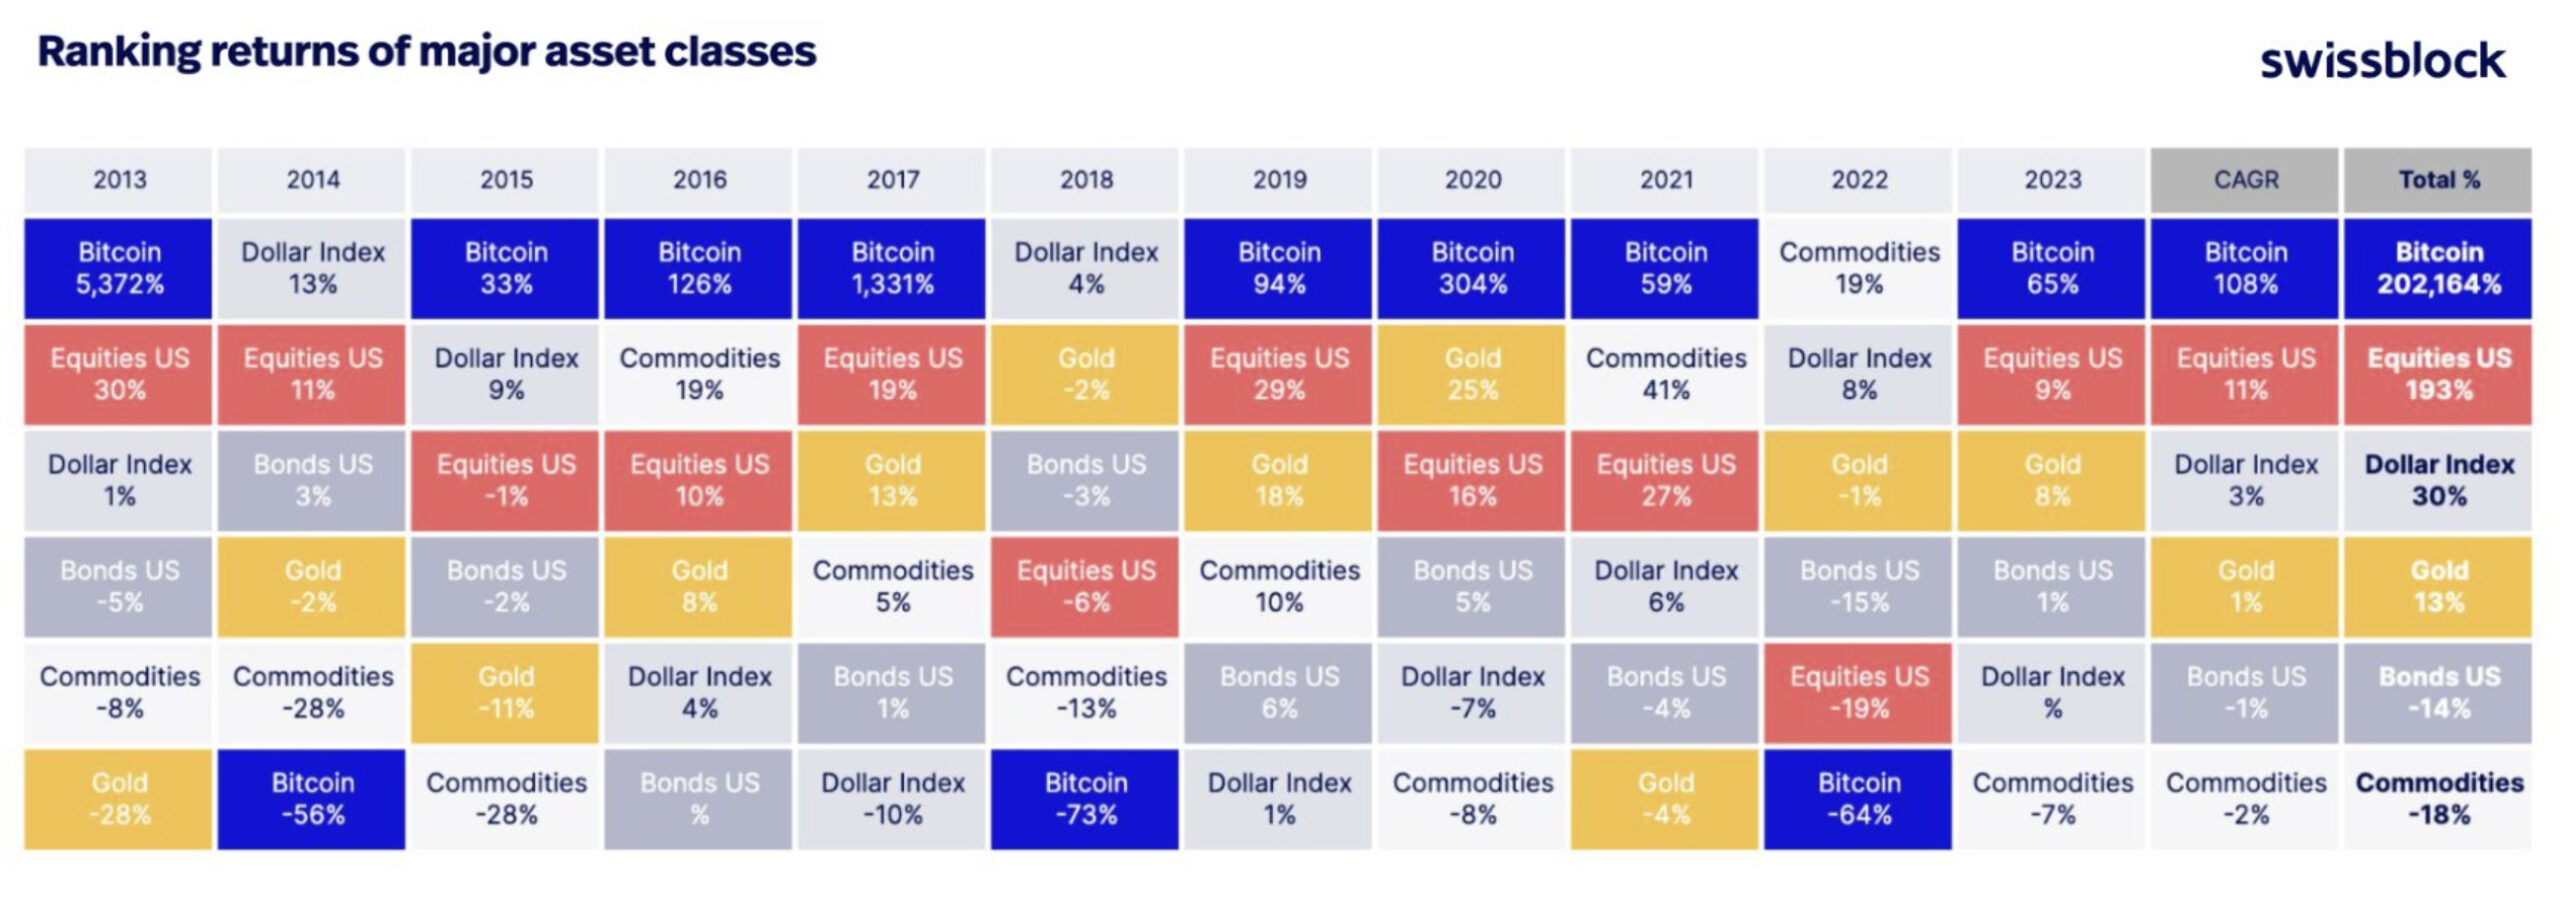
Even with the asset’s 4% dip over the past week, it’s still up more than 65% so far this year, according to bitcoinmonthlyreturn.com.
💥 Ranking returns of major asset classes:
A 10-year retrospective! 📈🔍 Let's explore the past decade:
Despite its (shrinking) volatility, Bitcoin has outperformed all major asset classes in 7 out of 10 years. 💯🚀 2023 kicks off with a strong start! Exciting times… pic.twitter.com/5vjIsyFbMu
— 𝗡𝗲𝗴𝗲𝗻𝘁𝗿𝗼𝗽𝗶𝗰 (@Negentropic_) May 24, 2023
Related Stories


UNLOCK INSIGHTS
Discover the untold stories of emerging ASX stocks.
Daily news and expert analysis, it's free to subscribe.
By proceeding, you confirm you understand that we handle personal information in accordance with our Privacy Policy.


