Despite market crash cryptocurrencies book positive YTD returns

Picture: Getty Images
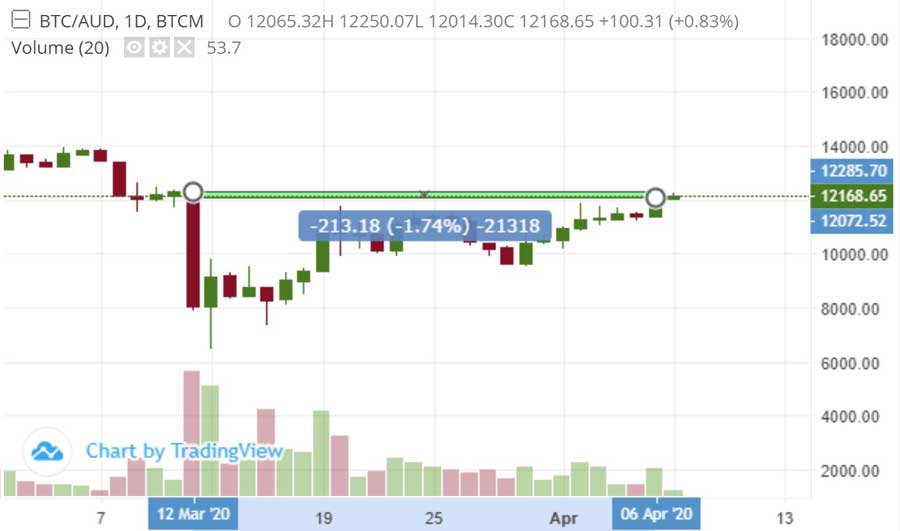
Digital assets rallied to recover the majority of losses sustained on March 12.
At the time, BTC Markets data showed that the four major coins — Bitcoin (BTC), Ripple (XRP), Ethereum (ETC) and Litecoin (LTC) — suffered price drops between 32 and 41 per cent in one day.
April 6 saw BTC close at $12,073, just 1.8 per cent down from the March 12 opening price. Alt-coins ETH and LTC remained down 6.3 percent and 3.4 per cent, with XRP showing the only real gain at 1.09 per cent.
| Asset | YTD return (Jan 1 – April 6) |
|---|---|
| BTC | 0.1782 |
| XRP | 0.1823 |
| ETC | 0.5172 |
| LTC | 0.2447 |
| S&P ASX Small Ordinaries (XSO) | -0.2519 |
Digital assets have outperformed the XSO index so far this year. Despite the market crash, digital assets have posted positive year-to-date (YTD) returns. ETH has led the way among the major digital assets with a YTD gain of $96.48.
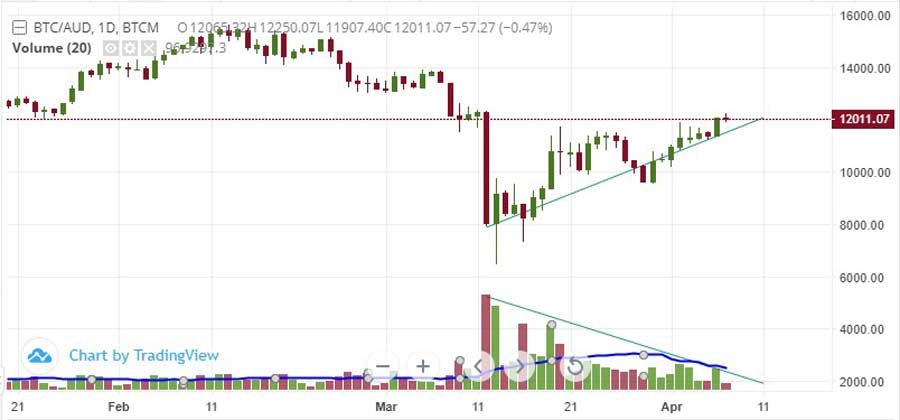
Volume
Volume decreased over the course of the recovery. BTC’s price moved up while volume moved down. As the asset’s recovery has been made on decreasing volume, there is some question if the uptrend can be sustained.
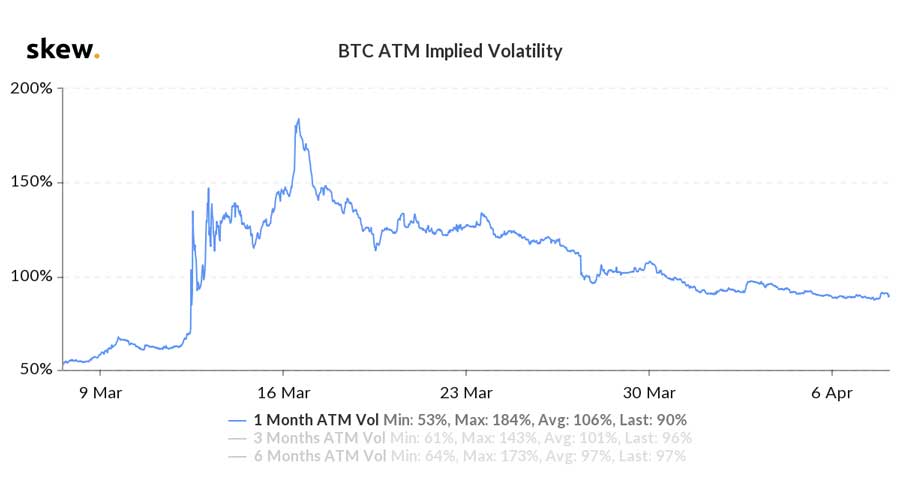
Volatility
BTC implied volatility has been trending down and currently sits at 90 per cent. Increased price stability can be expected as the index continues to move lower.
However, volatility is still considered high, compared to pre-March 12, as shown on the chart below.
Over the course of March into April, the average volatility has been 106 per cent. March opened at 57 per cent, with a peak on the 17th at 184 per cent.
By comparison, the S&P ASX 200 VIX index, which tracks the volatility of the Australian share market, is currently at 32 per cent, from a mid-March peak of 53 per cent. This is far outside its usual mid-teen range.
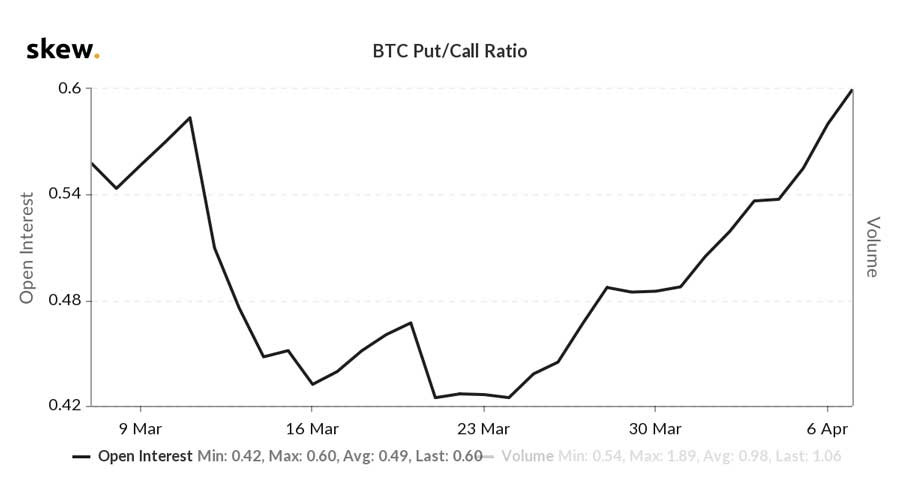
Put:call ratio
The put:call ratio can be used to measure market sentiment.
A put is the right to sell at a specific price and a call is the option to buy. A put:call ratio of 1 indicates that number buying calls is the same as buying puts.
A ratio of 2 means there are twice as many puts than calls being bought. This would signify a strong bearish sentiment. In traditional financial markets, the average ratio is 0.7.
The chart below shows the BTC put:call ratio in March. There was a pronounced decrease from early to mid-March, as traders waited for the asset price to climb.
Prices did climb, however the ratio increased and introduced more bearish sentiment into the marketplace. This may be backed by the decrease in trading volume. The put:call ratio currently sits at 0.6.
Related Topics
Related Stories


UNLOCK INSIGHTS
Discover the untold stories of emerging ASX stocks.
Daily news and expert analysis, it's free to subscribe.
By proceeding, you confirm you understand that we handle personal information in accordance with our Privacy Policy.


