CoinJar’s Three Ts: Ethereum upgrades, the DXY factor and a weekly close for the ages

Pic: DKosig / iStock / Getty Images Plus via Getty Images
Welcome to CoinJar’s Three Ts. Each fortnight we explore a big Theme, an interesting Trade and some good, old-fashioned TA (courtesy of Tom from trading gurus FX Evolution).
Ethereum rising?
With Bitcoin hitting its highest level in a month, things are mostly champagne and roses in crypto-land right now. But it might be worth paying more attention to crypto’s second-in-command, Ethereum.
The much-hyped EIP-1559 upgrade is due to go live in early August, bringing a new token burn dynamic to the network that should apply deflationary pressure to the market.
Add to that the increasing roll-out of the Optimism scaling solution (goodbye $50 gas fees!) and the imminent arrival of Serenity – AKA ETH 2.0, Ethereum’s proof-of-stake solution – and you have what some commentators are referring to as a Triple Halving event on the horizon.
Triple Halving$ETH will undergo a massive supply shock equivalent to a total of 3 halving events for $BTC
This is a 90% drop in sell pressure from miners thanks to changes to $ETH including POS, deflation, as well as liquidity
It will be known as the “triple halving” https://t.co/IuP2Ifgzz0 pic.twitter.com/G9SXmIzuiz
— croissant (@CroissantEth) July 18, 2021
Dollar dollar bounce y’all
For the past half a decade, the most consistent Bitcoin price correlation has been with the US dollar index ($DXY).
The relationship is simple. Strong dollar, weak Bitcoin; weak dollar, strong Bitcoin. It makes sense as Bitcoin has always presented itself as a weapon against inflation. If fiat currency is losing strength, Bitcoin becomes a more appealing place to park those dollars.
So when the US government started printing trillions of US dollars to mute the economic effects of the COVID-19 pandemic, it was little surprise that the DXY began to plunge – and the Bitcoin price went parabolic.
However, now we’re beginning to see signs of a turnaround in the DXY – a double bottom followed by a break of resistance – and if those trends continue it could spell continued stagnation or even downside for BTC.
I think we continue to see the dollar rally here towards 94.
Correlation with Crypto has been inverse so could line up with further potential #Bitcoin downside. https://t.co/YO3CJdMje7 pic.twitter.com/0nWpjd8qIV
— Mayne (@Tradermayne) July 19, 2021
But before you rush into any 100x shorts: DXY moves can take months if not years to play out, so there’s plenty of scope for Bitcoin upside in the interim. And hey – from another perspective that’s just a rising wedge ready to collapse…
Wyckoff to the races
And there we have it: some actual, high volume movement in the Bitcoin market.
While the more immediate cause of the impulse was likely a short squeeze – overleveraged short positions being liquidated in a self-perpetuating cascade upwards – for Tom from FX Evolution, what we’re seeing matches up well with a classic Wyckoff accumulation pattern.
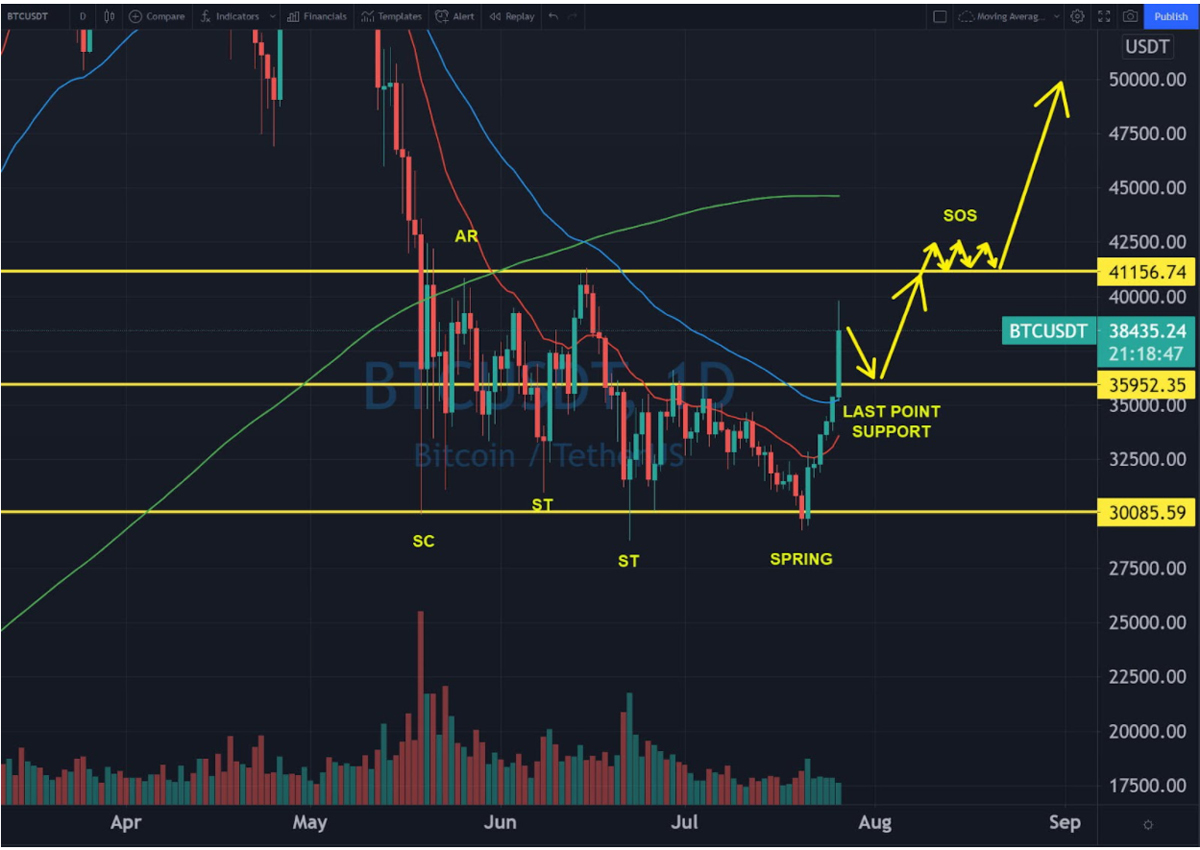
If the model holds, we should see a return to a newly established support around US$36k over the next few days before making another push for US$40k and above.
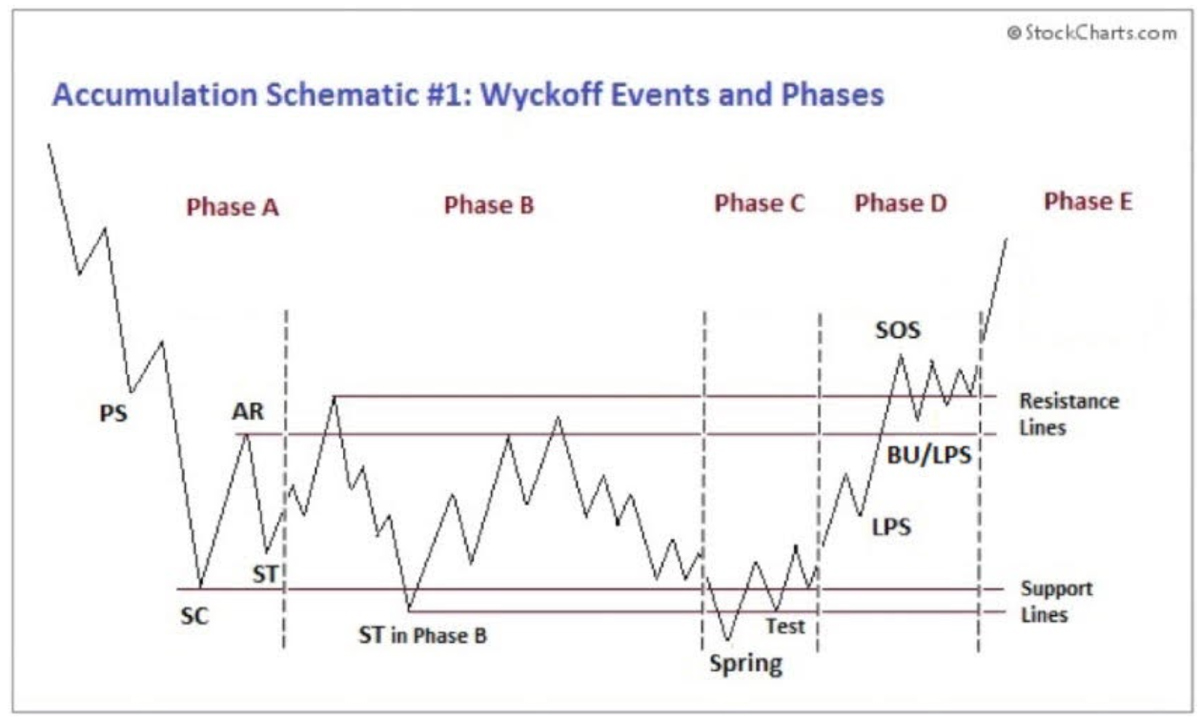
If you’re unfamiliar with Wyckoff schematics, they’re basically a way of mapping out trading movements and price manipulation at market tops and bottoms. You can find a good summary of the phases and terminology here.
The giant green candle we saw around the weekly close yesterday also signalled a reversion to the 20-week EMA (Exponential Moving Average), an important trendline for the Bitcoin price.
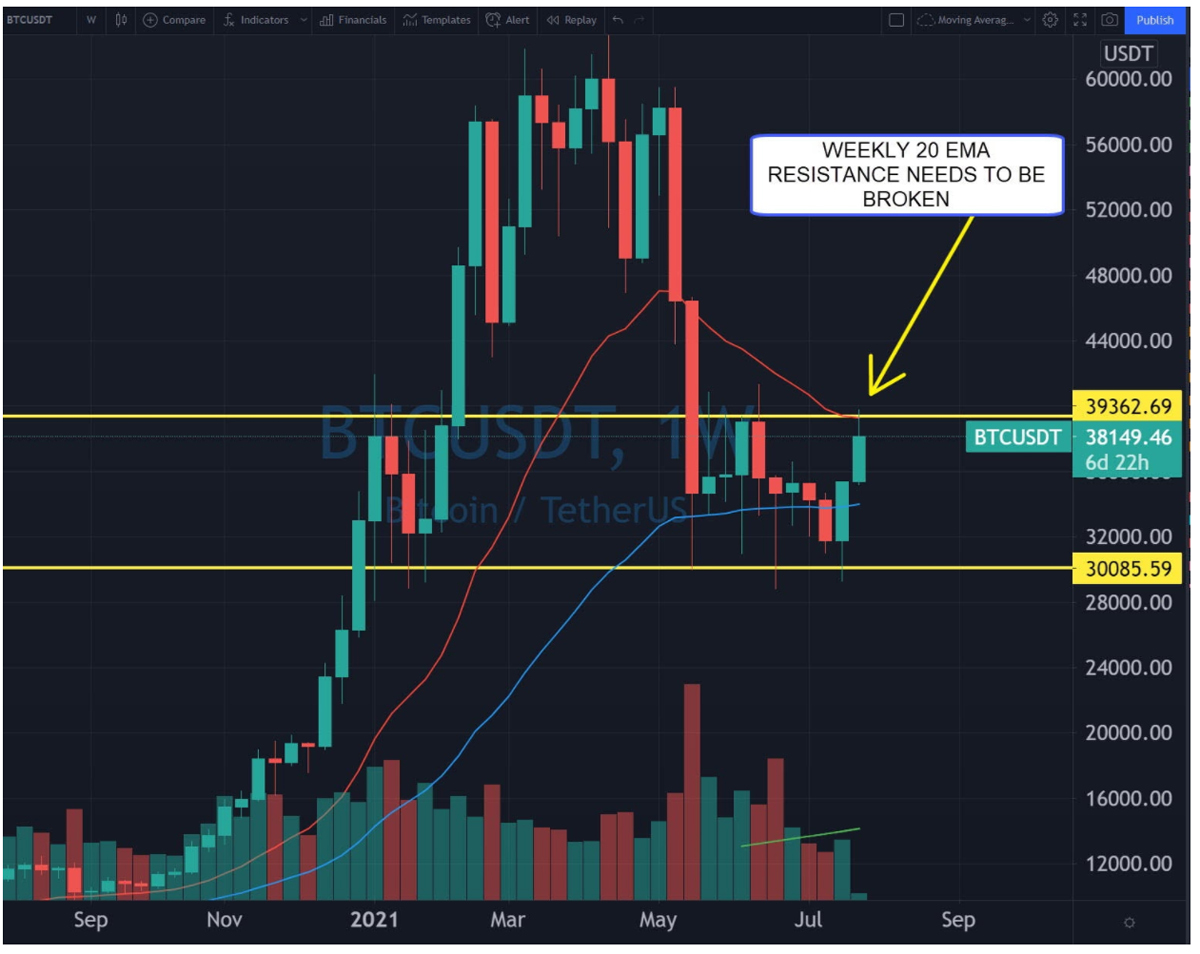
As we can see, price is now sandwiched firmly between the 20-week and 50-week EMAs.
While yesterday’s gains are certainly the most positive bit of price movement we’ve seen in months, we’ll need to see a break and close above the 20-week before we can more confidently declare a return to bullish conditions.
CoinJar is Australia’s leading cryptocurrency exchange. Established in 2013, CoinJar makes buying, selling, trading and spending cryptocurrency fast and simple, whether you’re a first-timer or a pro trader.
Related Topics
Related Stories


UNLOCK INSIGHTS
Discover the untold stories of emerging ASX stocks.
Daily news and expert analysis, it's free to subscribe.
By proceeding, you confirm you understand that we handle personal information in accordance with our Privacy Policy.


