

Mining
Monsters of Rock: Gold miners are enjoying stronger margins on rising prices, but costs are still like quicksand

Mining
Gold Digger: Michael 'Big Short' Burry long on gold ETF; Buffett into Barrick; World Bank bullish

Mining
Pic: Via Getty Images
Mining
Our Gold Digger column wraps all the news driving ASX stocks with exposure to precious metals.
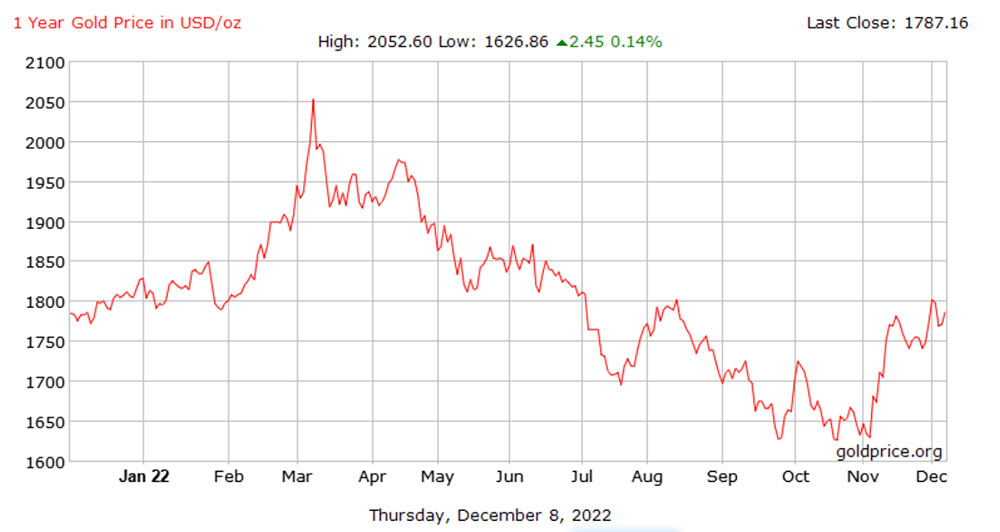
Over the last month, the gold price has staged a significant recovery from September lows.
After falling below US$1,620 on three occasions since September, the metal is trading near US$1,790 as we write, a recovery of nearly 11%.
Gold prices are now flirting with the US$1,800 level again as the dollar softens ahead of a key round of inflation data, OANDA analyst Ed Moya said this morning.
“It starts on Friday (US time) with an expected deceleration with wholesale price gains and later that morning the University of Michigan inflation expectations that are expected to remain steady,” he says.
“On Tuesday, we will get the November Inflation report that should see price pressures continue to ease and on Wednesday we get the Fed.
“The FOMC is expected to downshift to half-point pace but traders will care to see what they have to say about the trend of inflation and where rates could peak.”
Gold looks like it will find a home around the US$1800 level until we have better indications with the path of prices, Moya says.
“Key resistance remains the US$1830 level with decent support at the US$1750 region.”
Is this rally the real deal?
While recent momentum might suggest that gold is staging a structural turnaround into 2023, Metals Focus says this rally is “unlikely” to be sustainable.
It says much of the action has been exaggerated by the positioning of longs and shorts in the market before events, like a weak US CPI report, triggered short-covering or liquidations.
A short position is generally the sale of a stock/asset you do not own. Investors who sell short are betting the price of gold, for example, will decrease.
If the price drops, they can buy it back at the lower price and book a profit. But if the price rises and they’re forced to buy it back later at the higher price, they incur a loss.
‘Short covering’, in this case, refers to buying back borrowed gold to close out an open short position potentially at a loss, which forces the price even higher.
“Given the aggressive rate hikes this year, CME data suggests that money managers had maintained a net-short position on gold [expecting it fall] for ten consecutive weeks starting in early September. This in turn was led by the aggressive long positioning in the US dollar [expecting it to rise].
“Given the extended positioning both on the long side (for the dollar) and the short side (gold), much of the recent price moves in gold have been triggered by short covering rather than fresh buying,” Metals Focus says.
“To put this into context, gross money manager shorts (as of 29th November) have slumped by 60% since their peak of 11.7Moz at end-September,” Metals Focus.
“By contrast, gross longs have risen by just 16% during the same period.”
Metals Focus is also bucking the trend with its bearish predictions for gold in 2023.
“We believe that this rally is unlikely to be sustainable as the yellow metal has to contend with rising real yields in 2023, which will raise the opportunity cost of holding gold and, in turn, undermine investor sentiment once the ongoing relief rally in global financial markets fades,” it says.
Bloomberg Intelligence senior macro strategist Mike McGlone says the opposite.
As do a slew of experts in our biblically long (but indispensable) Commodity Predictions For 2023 yarn.
So, who’s right? Only time will tell.
Here’s how ASX-listed precious metals stocks are performing:
Scroll or swipe to reveal table. Click headings to sort. Best viewed on a laptop.
Stocks missing from this list? Email [email protected]
| CODE | COMPANY | 1 WEEK RETURN % | 1 MONTH RETURN % | 6 MONTH RETURN % | 1 YEAR RETURN % | PRICE [INTRADAY FRI] | MARKET CAP |
|---|---|---|---|---|---|---|---|
| ANL | Amani Gold | 50% | 50% | 0% | 0% | 0.0015 | $35,540,162 |
| CDR | Codrus Minerals | 48% | 208% | 130% | 43% | 0.2 | $4,851,600 |
| GMN | Gold Mountain | 43% | 11% | 67% | -38% | 0.01 | $15,781,492 |
| A1G | African Gold | 36% | 4% | -4% | -39% | 0.095 | $14,580,381 |
| PKO | Peako | 29% | 19% | -9% | -26% | 0.0155 | $5,877,837 |
| AL8 | Alderan Resource | 29% | 29% | -50% | -73% | 0.009 | $5,204,395 |
| CLA | Celsius Resource | 29% | 64% | -3% | -10% | 0.018 | $24,045,265 |
| AQX | Alice Queen | 25% | 25% | -50% | -75% | 0.0025 | $5,500,625 |
| LM8 | Lunnonmetals | 24% | 26% | 20% | 165% | 0.98 | $108,777,366 |
| CHN | Chalice Mining | 20% | 55% | 22% | -23% | 6.71 | $2,370,672,322 |
| POL | Polymetals Resources | 19% | 28% | 108% | 67% | 0.25 | $10,295,673 |
| EMC | Everest Metals Corp | 18% | -10% | -14% | -36% | 0.09 | $8,833,948 |
| NES | Nelson Resources. | 17% | 17% | -44% | -71% | 0.007 | $4,120,160 |
| RSG | Resolute Mining | 17% | 9% | -13% | -34% | 0.21 | $357,830,788 |
| BEZ | Besragoldinc | 15% | 52% | -9% | -51% | 0.06 | $15,126,824 |
| EMU | EMU NL | 14% | 60% | -47% | -64% | 0.008 | $5,498,145 |
| TMX | Terrain Minerals | 14% | 33% | -20% | 0% | 0.008 | $6,177,517 |
| MLS | Metals Australia | 13% | 34% | -25% | 28% | 0.051 | $30,958,846 |
| FAU | First Au | 13% | -10% | -65% | -59% | 0.0045 | $4,283,970 |
| RDS | Redstone Resources | 13% | 50% | 29% | -36% | 0.009 | $6,631,492 |
| ARV | Artemis Resources | 12% | -3% | -15% | -64% | 0.028 | $36,176,878 |
| BNZ | Benzmining | 12% | -2% | -22% | -28% | 0.47 | $33,501,244 |
| GBR | Greatbould Resources | 12% | 3% | 7% | -30% | 0.094 | $39,749,984 |
| REZ | Resourc & En Grp | 12% | 6% | -30% | -55% | 0.019 | $9,496,310 |
| KRM | Kingsrose Mining | 12% | 20% | 5% | -14% | 0.067 | $49,666,750 |
| GED | Golden Deeps | 11% | -17% | -38% | -23% | 0.01 | $11,552,267 |
| XAM | Xanadu Mines | 11% | 11% | 15% | 20% | 0.03 | $42,367,806 |
| CAZ | Cazaly Resources | 10% | 3% | -20% | -26% | 0.032 | $12,270,119 |
| GWR | GWR Group | 10% | 16% | -40% | -37% | 0.066 | $21,200,299 |
| RMX | Red Mount Min | 10% | 10% | -27% | -39% | 0.0055 | $8,211,819 |
| VKA | Viking Mines | 10% | 57% | 57% | -42% | 0.011 | $11,277,843 |
| E2M | E2 Metals | 10% | 26% | -3% | -40% | 0.17 | $35,843,818 |
| SMI | Santana Minerals | 10% | 25% | -14% | 143% | 0.74 | $107,119,871 |
| MHC | Manhattan Corp | 9% | 0% | -45% | -54% | 0.006 | $9,157,672 |
| PRX | Prodigy Gold NL | 9% | 9% | -25% | -61% | 0.012 | $20,974,594 |
| PUR | Pursuit Minerals | 9% | 9% | -37% | -54% | 0.012 | $11,978,150 |
| SRN | Surefire Rescs NL | 9% | 0% | -59% | 9% | 0.012 | $17,394,998 |
| GIB | Gibb River Diamonds | 9% | 24% | 24% | -34% | 0.062 | $13,113,586 |
| MVL | Marvel Gold | 9% | 4% | -31% | -60% | 0.025 | $17,612,359 |
| HAW | Hawthorn Resources | 8% | 51% | 30% | 34% | 0.13 | $43,357,030 |
| HAV | Havilah Resources | 8% | 8% | 16% | 100% | 0.33 | $101,324,547 |
| BGD | Bartongoldholdings | 8% | 33% | -5% | -2% | 0.2 | $17,248,461 |
| CDT | Castle Minerals | 8% | 23% | -16% | 17% | 0.027 | $23,987,832 |
| ASO | Aston Minerals | 8% | 40% | -27% | -24% | 0.095 | $100,217,784 |
| MTC | Metalstech | 8% | 4% | 6% | 43% | 0.415 | $70,240,655 |
| LEX | Lefroy Exploration | 8% | -2% | -7% | -16% | 0.28 | $40,844,907 |
| SFR | Sandfire Resources | 7% | 47% | -4% | -5% | 5.64 | $2,402,811,753 |
| MKG | Mako Gold | 7% | 10% | -44% | -63% | 0.045 | $18,866,054 |
| AUC | Ausgold | 7% | 9% | -16% | 4% | 0.047 | $97,414,778 |
| MEU | Marmota | 7% | 4% | -30% | 7% | 0.047 | $48,704,826 |
| MEI | Meteoric Resources | 7% | 14% | 14% | 0% | 0.016 | $24,420,758 |
| HXG | Hexagon Energy | 6% | 6% | -39% | -78% | 0.017 | $8,719,570 |
| M24 | Mamba Exploration | 6% | 48% | 70% | -11% | 0.17 | $6,748,000 |
| MM8 | Medallion Metals. | 6% | 0% | -40% | -4% | 0.17 | $23,792,360 |
| KCC | Kincora Copper | 6% | 5% | -27% | -40% | 0.069 | $5,208,251 |
| PNT | Panthermetals | 6% | -10% | -8% | 0% | 0.18 | $5,535,000 |
| NAG | Nagambie Resources | 6% | 3% | 42% | 14% | 0.075 | $35,083,672 |
| NXM | Nexus Minerals | 6% | 19% | -22% | -65% | 0.19 | $58,581,596 |
| CMM | Capricorn Metals | 5% | 22% | 25% | 63% | 4.69 | $1,816,810,849 |
| STN | Saturn Metals | 5% | -10% | -42% | -50% | 0.2 | $25,979,835 |
| TMZ | Thomson Res | 5% | 11% | -19% | -66% | 0.021 | $17,183,972 |
| AAR | Astral Resources | 5% | 17% | -17% | -21% | 0.068 | $45,247,879 |
| CYL | Catalyst Metals | 4% | -5% | -20% | -45% | 1.2 | $118,147,378 |
| MOH | Moho Resources | 4% | 0% | -33% | -60% | 0.024 | $4,776,231 |
| ALY | Alchemy Resource | 4% | -34% | 29% | 145% | 0.027 | $30,629,983 |
| BCN | Beacon Minerals | 4% | 13% | -10% | -11% | 0.027 | $97,675,972 |
| TBA | Tombola Gold | 4% | -4% | -51% | -13% | 0.027 | $34,403,445 |
| VMC | Venus Metals Cor | 4% | -16% | -27% | -21% | 0.135 | $24,040,622 |
| RND | Rand Mining | 4% | -3% | -2% | -4% | 1.4 | $79,626,345 |
| ANX | Anax Metals | 4% | -5% | -43% | -40% | 0.057 | $23,977,295 |
| AUT | Auteco Minerals | 4% | 40% | 16% | -17% | 0.059 | $113,730,997 |
| EM2 | Eagle Mountain | 3% | -11% | -61% | -72% | 0.16 | $45,831,501 |
| GSR | Greenstone Resources | 3% | 28% | -40% | 14% | 0.032 | $31,162,790 |
| MBK | Metal Bank | 3% | 13% | -32% | -51% | 0.034 | $9,400,508 |
| CEL | Challenger Exp | 3% | 16% | -18% | -35% | 0.18 | $182,859,469 |
| RED | Red 5 | 3% | 16% | -51% | -27% | 0.185 | $516,671,092 |
| KIN | KIN Min NL | 3% | -3% | -3% | -29% | 0.075 | $78,639,114 |
| SLR | Silver Lake Resource | 3% | 12% | -18% | -20% | 1.315 | $1,245,857,406 |
| TAR | Taruga Minerals | 3% | 26% | 56% | 15% | 0.039 | $26,523,661 |
| VAN | Vango Mining | 3% | 3% | -22% | -37% | 0.039 | $49,137,568 |
| CBY | Canterbury Resources | 3% | 0% | -18% | -52% | 0.04 | $5,360,941 |
| KZR | Kalamazoo Resources | 2% | -5% | -32% | -38% | 0.21 | $31,252,069 |
| RMS | Ramelius Resources | 2% | 18% | -19% | -34% | 0.9675 | $859,211,846 |
| FAL | Falconmetals | 2% | 18% | -11% | 0% | 0.235 | $41,595,000 |
| NCM | Newcrest Mining | 2% | 16% | -13% | -10% | 21.07 | $18,964,501,203 |
| CST | Castile Resources | 2% | 15% | -22% | -32% | 0.1325 | $32,656,828 |
| X64 | Ten Sixty Four | 2% | 7% | -23% | -23% | 0.565 | $127,900,249 |
| SPQ | Superior Resources | 2% | 2% | 45% | 263% | 0.058 | $96,969,564 |
| EVN | Evolution Mining | 2% | 35% | -20% | -27% | 2.91 | $5,321,547,325 |
| AQI | Alicanto Min | 2% | 20% | -13% | -50% | 0.06 | $26,682,817 |
| WGX | Westgold Resources. | 2% | -2% | -39% | -59% | 0.7675 | $374,161,957 |
| HRN | Horizon Gold | 2% | -2% | -11% | -16% | 0.32 | $40,058,125 |
| CAI | Calidus Resources | 1% | -9% | -55% | -39% | 0.35 | $153,276,097 |
| AWJ | Auric Mining | 1% | 4% | -18% | -30% | 0.077 | $7,226,036 |
| TUL | Tulla Resources | 1% | -1% | -34% | -25% | 0.395 | $79,234,130 |
| SBM | St Barbara | 1% | 27% | -48% | -54% | 0.6325 | $522,586,653 |
| SSR | SSR Mining Inc. | 1% | 15% | -20% | -11% | 22.79 | $420,984,332 |
| CWX | Carawine Resources | 1% | 7% | -34% | -52% | 0.092 | $18,107,207 |
| AGG | AngloGold Ashanti | 1% | 26% | 15% | -1% | 5.56 | $495,995,173 |
| TBR | Tribune Res | 1% | 31% | 1% | -18% | 4 | $209,872,308 |
| RRL | Regis Resources | 1% | 28% | 4% | 13% | 2.02 | $1,540,252,887 |
| AAU | Antilles Gold | 0% | 6% | -51% | -46% | 0.037 | $15,799,802 |
| ADG | Adelong Gold | 0% | -22% | -77% | -83% | 0.007 | $3,102,308 |
| ADT | Adriatic Metals | 0% | 17% | 32% | 17% | 3.18 | $695,740,426 |
| ADV | Ardiden | 0% | 33% | -20% | -20% | 0.008 | $22,680,851 |
| AME | Alto Metals | 0% | 1% | -10% | -34% | 0.069 | $39,377,704 |
| AVW | Avira Resources | 0% | -14% | -25% | -45% | 0.003 | $6,401,370 |
| AYM | Australia United Min | 0% | 0% | -33% | -50% | 0.004 | $7,370,310 |
| BAT | Battery Minerals | 0% | -11% | -20% | -69% | 0.004 | $11,700,969 |
| BRB | Breaker Res NL | 0% | 13% | 49% | -5% | 0.305 | $99,474,073 |
| CGN | Crater Gold Min | 0% | 0% | 0% | 0% | 0.017 | $21,063,474 |
| CLZ | Classic Min | 0% | -17% | -93% | -93% | 0.01 | $7,363,833 |
| DCX | Discovex Res | 0% | 0% | -48% | -37% | 0.003 | $9,907,704 |
| DEX | Duke Exploration | 0% | 0% | -42% | -71% | 0.053 | $5,587,240 |
| DTM | Dart Mining NL | 0% | -4% | -7% | -24% | 0.065 | $10,091,910 |
| EMR | Emerald Res NL | 0% | 3% | -8% | 4% | 1.125 | $670,853,861 |
| ENR | Encounter Resources | 0% | -3% | 10% | 18% | 0.165 | $58,661,754 |
| FFX | Firefinch | 0% | 0% | -31% | -24% | 0.2 | $236,248,644 |
| G50 | Gold50 | 0% | 150% | 28% | -4% | 0.25 | $14,235,750 |
| GCY | Gascoyne Res | 0% | 0% | -27% | -37% | 0.195 | $83,082,880 |
| GML | Gateway Mining | 0% | 5% | -48% | -58% | 0.063 | $14,238,691 |
| GMR | Golden Rim Resources | 0% | -15% | -47% | -61% | 0.033 | $10,673,055 |
| GRL | Godolphin Resources | 0% | 0% | -29% | -47% | 0.082 | $10,416,511 |
| GSN | Great Southern | 0% | -20% | 3% | -34% | 0.04 | $23,213,136 |
| KAU | Kaiser Reef | 0% | 3% | -15% | -8% | 0.17 | $22,795,003 |
| LRL | Labyrinth Resources | 0% | -6% | -32% | -51% | 0.017 | $15,720,602 |
| MAU | Magnetic Resources | 0% | 3% | -39% | -43% | 0.8 | $183,609,905 |
| MI6 | Minerals260 | 0% | 22% | 2% | -19% | 0.44 | $94,600,000 |
| MOM | Moab Minerals | 0% | -10% | -67% | -70% | 0.009 | $6,478,653 |
| NAE | New Age Exploration | 0% | 20% | 0% | -18% | 0.009 | $12,923,090 |
| NPM | Newpeak Metals | 0% | 0% | 0% | -33% | 0.001 | $9,096,667 |
| NSM | Northstaw | 0% | 1% | -48% | -68% | 0.098 | $11,772,446 |
| NST | Northern Star | 0% | 16% | 25% | 17% | 10.92 | $12,659,525,075 |
| OAU | Ora Gold | 0% | -14% | -45% | -54% | 0.006 | $5,905,388 |
| OZM | Ozaurum Resources | 0% | 0% | -59% | -45% | 0.072 | $5,019,552 |
| PF1 | Pathfinder Resources | 0% | 0% | 0% | 79% | 0.5 | $28,984,082 |
| PGO | Pacgold | 0% | -7% | -40% | -31% | 0.39 | $21,435,108 |
| PNM | Pacific Nickel Mines | 0% | 1% | -15% | -7% | 0.071 | $25,441,389 |
| PNX | PNX Metals | 0% | 25% | 0% | -14% | 0.005 | $22,220,289 |
| QML | Qmines | 0% | -14% | -18% | -50% | 0.18 | $16,237,626 |
| RML | Resolution Minerals | 0% | -11% | -20% | -50% | 0.008 | $8,557,970 |
| RVR | Red River Resources | 0% | 0% | -57% | -59% | 0.073 | $37,847,908 |
| S2R | S2 Resources | 0% | 18% | -7% | -6% | 0.165 | $60,668,725 |
| SBR | Sabre Resources | 0% | 0% | 0% | 0% | 0.0045 | $13,116,852 |
| SI6 | SI6 Metals | 0% | -17% | -38% | -44% | 0.005 | $8,224,670 |
| SIH | Sihayo Gold | 0% | -20% | -20% | -75% | 0.002 | $12,204,256 |
| SKY | SKY Metals | 0% | 0% | -45% | -50% | 0.05 | $18,839,174 |
| SVG | Savannah Goldfields | 0% | -18% | 0% | -6% | 0.18 | $31,067,719 |
| TLM | Talisman Mining | 0% | 8% | -18% | -7% | 0.14 | $26,283,530 |
| TRY | Troy Resources | 0% | 0% | 0% | 0% | 0.0295 | $62,920,961 |
| TSO | Tesoro Gold | 0% | 1% | -46% | -53% | 0.035 | $34,719,327 |
| WCN | White Cliff Min | 0% | -11% | -6% | 0% | 0.016 | $11,214,050 |
| WMC | Wiluna Mining Corp | 0% | 0% | -58% | -77% | 0.205 | $74,238,031 |
| FEG | Far East Gold | -1% | -18% | 66% | 0% | 0.54 | $70,067,757 |
| CHZ | Chesser Resources | -1% | 7% | -22% | -38% | 0.074 | $44,109,233 |
| ERM | Emmerson Resources | -1% | -1% | -24% | -56% | 0.074 | $40,308,524 |
| TGM | Theta Gold Mines | -1% | -8% | -18% | -59% | 0.074 | $45,806,671 |
| MEK | Meeka Metals | -1% | 14% | 6% | 52% | 0.067 | $72,597,407 |
| GUL | Gullewa | -2% | -3% | -12% | -21% | 0.06 | $11,722,386 |
| IVR | Investigator Res | -2% | 0% | 1% | -24% | 0.051 | $66,858,183 |
| MXR | Maximus Resources | -2% | -4% | -32% | -25% | 0.043 | $13,394,042 |
| SVL | Silver Mines | -2% | 14% | 8% | 5% | 0.205 | $277,743,911 |
| PRU | Perseus Mining | -2% | 17% | 13% | 42% | 2.205 | $3,104,141,267 |
| SFM | Santa Fe Minerals | -2% | -8% | -20% | -27% | 0.08 | $5,825,503 |
| MGV | Musgrave Minerals | -3% | -11% | -37% | -46% | 0.195 | $110,318,360 |
| OKR | Okapi Resources | -3% | -10% | -35% | -57% | 0.175 | $25,784,237 |
| AAJ | Aruma Resources | -3% | -7% | 1% | 3% | 0.069 | $10,516,421 |
| PRS | Prospech | -3% | 13% | -23% | -54% | 0.034 | $3,002,152 |
| KSN | Kingston Resources | -3% | 8% | -31% | -46% | 0.097 | $40,318,405 |
| BC8 | Black Cat Syndicate | -3% | 7% | -24% | -45% | 0.32 | $68,780,536 |
| TTM | Titan Minerals | -3% | 27% | 34% | -4% | 0.095 | $136,893,499 |
| GOR | Gold Road Res | -3% | 23% | 32% | 21% | 1.74 | $1,915,159,490 |
| KTA | Krakatoa Resources | -3% | 2% | -9% | 11% | 0.059 | $18,959,045 |
| ALK | Alkane Resources | -3% | 0% | -34% | -18% | 0.6375 | $377,239,333 |
| MZZ | Matador Mining | -3% | 33% | -22% | -62% | 0.14 | $45,705,571 |
| NVA | Nova Minerals | -4% | -13% | 17% | -44% | 0.68 | $142,569,666 |
| BYH | Bryah Resources | -4% | 8% | -33% | -47% | 0.027 | $7,593,844 |
| KAI | Kairos Minerals | -4% | -13% | 13% | 4% | 0.027 | $51,066,431 |
| IDA | Indiana Resources | -4% | 0% | -7% | -9% | 0.052 | $25,417,851 |
| SAU | Southern Gold | -4% | -7% | -32% | -54% | 0.026 | $6,933,183 |
| ADN | Andromeda Metals | -4% | 23% | -44% | -70% | 0.048 | $149,280,405 |
| AZS | Azure Minerals | -4% | -25% | -26% | -29% | 0.24 | $71,812,413 |
| PNR | Pantoro | -4% | -11% | -60% | -63% | 0.12 | $222,352,572 |
| HCH | Hot Chili | -4% | 4% | -19% | -53% | 0.95 | $112,278,494 |
| KCN | Kingsgate Consolid. | -4% | -3% | 5% | -1% | 1.65 | $369,605,157 |
| KCN | Kingsgate Consolid. | -4% | -3% | 5% | -1% | 1.65 | $369,605,157 |
| LYN | Lycaonresources | -4% | 23% | -30% | -4% | 0.345 | $11,192,375 |
| A8G | Australasian Metals | -4% | 0% | -34% | -53% | 0.225 | $9,263,361 |
| BGL | Bellevue Gold | -4% | 47% | 30% | 42% | 1.12 | $1,204,656,457 |
| HRZ | Horizon | -4% | 16% | -48% | -47% | 0.066 | $41,107,850 |
| YRL | Yandal Resources | -4% | 0% | -43% | -72% | 0.11 | $17,358,339 |
| LCL | Los Cerros | -5% | 52% | -33% | -67% | 0.041 | $33,638,546 |
| KAL | Kalgoorliegoldmining | -5% | 1% | -9% | -31% | 0.1 | $7,743,460 |
| OBM | Ora Banda Mining | -5% | 3% | 147% | 29% | 0.079 | $114,170,844 |
| TAM | Tanami Gold NL | -5% | 3% | -26% | -41% | 0.039 | $43,478,591 |
| TRM | Truscott Mining Corp | -5% | 15% | -19% | 30% | 0.039 | $6,519,125 |
| DEG | De Grey Mining | -5% | 11% | 17% | 13% | 1.235 | $1,974,876,147 |
| GMD | Genesis Minerals | -5% | 2% | -22% | -15% | 1.185 | $487,598,702 |
| HMX | Hammer Metals | -5% | 3% | 24% | 60% | 0.072 | $60,710,144 |
| AWV | Anova Metals | -6% | 6% | 42% | -6% | 0.017 | $27,167,601 |
| VRC | Volt Resources | -6% | -11% | -11% | -35% | 0.017 | $62,070,782 |
| NWM | Norwest Minerals | -6% | -9% | 25% | -37% | 0.05 | $10,883,262 |
| RXL | Rox Resources | -6% | -13% | -48% | -57% | 0.165 | $30,270,210 |
| ASR | Asra Minerals | -6% | -30% | -56% | -27% | 0.016 | $23,428,185 |
| HMG | Hamelingold | -6% | -16% | 23% | 14% | 0.16 | $17,600,000 |
| M2R | Miramar | -6% | -1% | -10% | -55% | 0.094 | $6,644,084 |
| BTR | Brightstar Resources | -6% | -21% | -35% | -68% | 0.015 | $10,989,432 |
| AXE | Archer Materials | -6% | 1% | -8% | -44% | 0.655 | $166,808,029 |
| IGO | IGO | -6% | -4% | 23% | 47% | 14.97 | $11,275,717,736 |
| BNR | Bulletin Res | -7% | -20% | -35% | 36% | 0.1075 | $30,722,066 |
| BMR | Ballymore Resources | -7% | -13% | -28% | -36% | 0.14 | $13,484,444 |
| PDI | Predictive Disc | -7% | 17% | 11% | -18% | 0.205 | $356,023,550 |
| SVY | Stavely Minerals | -7% | 41% | -43% | -59% | 0.205 | $66,205,704 |
| CY5 | Cygnus Gold | -7% | -14% | 179% | 144% | 0.475 | $81,189,273 |
| CXU | Cauldron Energy | -7% | -16% | -29% | -66% | 0.009 | $5,467,899 |
| MKR | Manuka Resources. | -7% | -10% | -37% | -58% | 0.13 | $60,184,628 |
| NML | Navarre Minerals | -7% | -15% | -35% | -45% | 0.039 | $53,201,529 |
| RDN | Raiden Resources | -7% | -24% | -41% | -69% | 0.0065 | $10,754,786 |
| TCG | Turaco Gold | -7% | 21% | -39% | -57% | 0.052 | $22,241,267 |
| AGC | AGC | -8% | -9% | -26% | -32% | 0.061 | $4,266,819 |
| STK | Strickland Metals | -8% | 10% | -32% | -29% | 0.046 | $66,097,492 |
| GTR | Gti Energy | -8% | -21% | -42% | -59% | 0.011 | $16,560,319 |
| ICL | Iceni Gold | -8% | 86% | -15% | -43% | 0.11 | $15,383,571 |
| XTC | Xantippe Res | -8% | -21% | -45% | 10% | 0.0055 | $40,726,149 |
| AM7 | Arcadia Minerals | -8% | -6% | 2% | 32% | 0.245 | $11,674,473 |
| WAF | West African Res | -9% | 6% | -16% | -13% | 1.12 | $1,149,055,362 |
| TIE | Tietto Minerals | -9% | -4% | 84% | 75% | 0.745 | $825,838,530 |
| KWR | Kingwest Resources | -9% | -3% | -75% | -86% | 0.031 | $9,578,712 |
| GBZ | GBM Rsources | -9% | -25% | -55% | -64% | 0.041 | $21,947,858 |
| ZAG | Zuleika Gold | -9% | -5% | -38% | 0% | 0.02 | $10,431,013 |
| BMO | Bastion Minerals | -10% | -5% | -59% | -73% | 0.057 | $5,770,413 |
| LCY | Legacy Iron Ore | -10% | 19% | -17% | -24% | 0.019 | $121,729,698 |
| SMS | Starminerals | -10% | -12% | -52% | -66% | 0.065 | $1,922,700 |
| ARL | Ardea Resources | -10% | -5% | -19% | 84% | 0.9 | $154,352,495 |
| BBX | BBX Minerals | -10% | 13% | -55% | -58% | 0.07 | $35,530,668 |
| MRZ | Mont Royal Resources | -11% | -11% | -41% | -58% | 0.17 | $13,011,707 |
| TG1 | Techgen Metals | -11% | -15% | -47% | -51% | 0.085 | $4,653,661 |
| RDT | Red Dirt Metals | -11% | -23% | 2% | -29% | 0.4625 | $199,740,395 |
| GNM | Great Northern | -11% | -20% | 0% | -33% | 0.004 | $6,836,204 |
| IPT | Impact Minerals | -11% | 14% | -11% | -39% | 0.008 | $19,850,964 |
| SLZ | Sultan Resources | -11% | -27% | -47% | -56% | 0.071 | $5,913,192 |
| ARN | Aldoro Resources | -11% | -23% | 32% | -37% | 0.27 | $30,486,326 |
| DCN | Dacian Gold | -12% | -15% | -39% | -36% | 0.115 | $146,016,113 |
| MRR | Minrex Resources | -12% | -12% | -7% | -10% | 0.038 | $41,224,965 |
| WWI | West Wits Mining | -12% | -6% | -38% | -53% | 0.015 | $30,675,565 |
| FG1 | Flynngold | -12% | -22% | -25% | -45% | 0.097 | $6,213,922 |
| MCT | Metalicity | -13% | 0% | -13% | -62% | 0.0035 | $12,222,138 |
| KNB | Koonenberrygold | -13% | 4% | -11% | -47% | 0.082 | $6,212,028 |
| GSM | Golden State Mining | -13% | 15% | -22% | -46% | 0.047 | $5,733,696 |
| MDI | Middle Island Res | -14% | -29% | -69% | -48% | 0.05 | $6,120,911 |
| WRM | White Rock Min | -14% | 10% | -37% | -68% | 0.079 | $18,689,062 |
| CTO | Citigold Corp | -14% | -14% | 0% | -33% | 0.006 | $17,001,955 |
| PGD | Peregrine Gold | -15% | -13% | -13% | 6% | 0.38 | $14,725,718 |
| SNG | Siren Gold | -15% | 3% | -49% | -39% | 0.175 | $20,461,958 |
| AMI | Aurelia Metals | -15% | 38% | -54% | -65% | 0.145 | $173,241,210 |
| RGL | Riversgold | -15% | -34% | -17% | 60% | 0.029 | $27,418,564 |
| GAL | Galileo Mining | -15% | -17% | -41% | 333% | 0.91 | $182,803,057 |
| ICG | Inca Minerals | -16% | -10% | -74% | -72% | 0.027 | $13,022,757 |
| ZNC | Zenith Minerals | -16% | -9% | -31% | 9% | 0.255 | $89,585,217 |
| CPM | Coopermetals | -17% | -21% | -40% | 39% | 0.25 | $10,255,000 |
| FML | Focus Minerals | -17% | 9% | -5% | -31% | 0.175 | $50,147,763 |
| PUA | Peak Minerals | -17% | -17% | -58% | -63% | 0.005 | $5,206,854 |
| MAT | Matsa Resources | -18% | -3% | -29% | -27% | 0.037 | $16,474,185 |
| G88 | Golden Mile Res | -18% | 5% | -52% | -57% | 0.023 | $4,910,154 |
| DRE | Dreadnought Resources | -20% | -12% | 132% | 100% | 0.088 | $270,486,616 |
| NMR | Native Mineral Res | -21% | -31% | -25% | -49% | 0.135 | $15,612,729 |
| MEG | Megado Minerals | -23% | -40% | -62% | -57% | 0.04 | $5,500,000 |
| AVM | Advance Metals | -25% | -25% | -31% | -47% | 0.009 | $4,338,397 |
| THR | Thor Mining PLC | -25% | -33% | -54% | -57% | 0.006 | $8,653,277 |
| MTH | Mithril Resources | -33% | -40% | -50% | -81% | 0.003 | $10,290,816 |
| DTR | Dateline Resources | -34% | -39% | -69% | -44% | 0.045 | $23,172,565 |
Mining
Mining
Mining

Mining

Mining

Mining


Get the latest Stockhead news delivered free to your inbox.