
Pic: nespix / iStock / Getty Images Plus via Getty Images
What you should look for when investing in software stocks
Tech
Pic: nespix / iStock / Getty Images Plus via Getty Images
Tech
At first glance, software seems compelling.
Unlike mining or finance stocks, you can directly see and use the asset you are investing in.
Their stories of how the founders and developers came up with their idea are often compelling, and they can grow quicker and faster with less costs than businesses with a real world presence.
Also – who wants to miss out on the next Microsoft, Uber or Spotify?
But software stocks are far less simple. They involve a long and usually costly development process and once launched, weeks and months of trial and error persuading users they are better than existing solutions to the problem they are trying to fix – a problem which they may not even realise they have.
Here’s a quick guide to investing in software stocks.
By software we can mean computer software or apps for tablets or smartphones.
In all cases they are written in a coding language (such as Python or Java) by computer programmers and tested before being launched.
There are two ‘app’ platforms – Android and iOS, designed by Google and Apple respectively. Some coding languages (‘hybrid’) allow one code to be written that is applicable across both. Others are unique (‘native’) to the operating system and in which case there will need to be separate code written for both operating system.
While most ‘software stocks’ will move into both, the one they decide to start in will depend on several factors. iOS is perceived as a ‘premium’ brand because of its association with Apple’s iPhones. iPhone users generally earn more and spend more money per app.
However, Android has at least 3 times more users than iOS – likely because of the wider variety of devices you can access them on, and in many cases, devices that cost a lot less than Apple devices.
Although software development is costly and comprehensive, it is almost certain that software will be developed by the time the company lists. While they’ll require ongoing maintenance, it will either be managed within the Company or the web/app developer may be kept on in case maintenance work is needed.
If it’s the latter, they will be paid a retainer smaller than during the development process – likely a flat fee with additional hourly rates for specific work.
While many mining stocks will list before they have begun exploration, some even before feasibility studies, software and apps will be complete and likely have some traction. That is to say they will have a user base, some cash at bank and at least modest revenue, making set targets more achievable – particularly if they can indicate they achieved similar goals in the past.
Also unlike many other stocks, you can see first-hand the impact your stock is having.
If it is an app; most likely you will be able to download it from the App Store or Google Play and use it for yourself. Even if you do not need it, you may have a family member or a friend with the problem the app is trying to solve.
Of course, when you invest you want a financial return but it’s also great to make a positive difference in society, right?
It’s important to note that sometimes, apps and software may only be made available to revenue partners, to ensure revenue can be generated.
Every software company dreams of a larger company acquiring them. Facebook spent US$19 billion on swallowing up WhatsApp when it had only 20 employees. Apple has made dozens and dozens of acquisitions from Chomp (a search engine that searched for apps on what they did rather than what they were called) to Beddit (sleep tracking hardware); as have Microsoft and Amazon.
But it is equally likely that a larger company may try to crush it by adopting its features. For instance, Facebook bought Instagram and has ever since fended off constant allegations it copies Snapchat’s features. That scenario is more likely than the former, especially in the early stages of development.
While many businesses can protect their work with patents or claiming IP, it’s very difficult in the software industry. Only once the Company has a reputation, solid user base, revenue growth and team will bigger companies realise it’s perhaps easier to cough up and buy the product than dedicate their own team to creating a similar product.

And as with any other company, users should look for revenue and a path to profitability.
Some may not mention profitability – they will just hope they will be acquired. But what happens if the acquisition never eventuates?
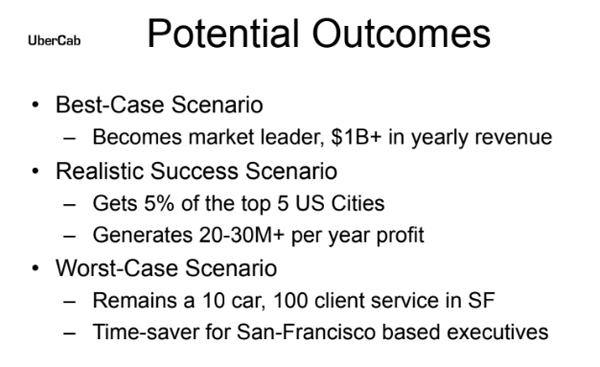
Few apps that aspire to be acquired even cover such scenarios. Uber has shown that a tech firm can survive off continual capital raises while staying private.
But once they go public, investors have to see profitability or at least a clear path to it.
Additionally software can have problems and need regular maintenance. There is a risk the Company will not hire the right people or firm to do the job and be left significantly out of pocket for no benefit.
Look no further than Appster to see the consequences of poor service among app developers.
It aspired in 2018 to be a $100m-a-year company. It ended the year liquidated with numerous clients being left out of pocket.
There also comes the risks of the industry the software is trying to disrupt. Suppose your software stock wanted to monitor the growth of sugar canes. Sugar cane farms in Australia face weather risks (particularly in the stormy season), large costs of maintenance and they usually sell to only one or two large monopsony buyers which could easily decide to stop buying.
What should you look for when deciding to invest in an software? The best investment opportunities will have these four traits:

The software sector is quickly growing and is one of the easiest to see in action first-hand.
But like every sector, it has its own unique risks – in addition to the general risks of investing in equities.
Here’s a table of ASX software stocks>>>
Scroll or swipe to reveal table. Click headings to sort. Best viewed on a laptop
| Ticker | Name | Share Price (16 January) | Market Cap | One Year Total Return % | 6 Month Total Return % | 1 Month Total Return % | 1 Week Total Return % |
|---|---|---|---|---|---|---|---|
| 8CO | 8COMMON | 0.031 | $4,955,487.50 | -26.1905 | -38 | -11.4286 | -11.4286 |
| 9SP | 9 SPOKES INTERNATIONAL | 0.013 | $7,429,068.00 | -78.2609 | -51.6129 | -21.0526 | -11.7647 |
| ADA | ADACEL TECHNOLOGIES | 0.67 | $51,765,120.00 | -71.3591 | -61.6667 | -1.4925 | -1.4925 |
| ADJ | ADSLOT | 0.046 | $57,120,252.00 | 17.9487 | 43.75 | 2.2222 | 12.1951 |
| ALU | ALTIUM | 23.87 | $3,052,664,576.00 | 67.5807 | 9.678 | 7.5333 | 6.9438 |
| AO1 | ASSETOWL | 0.019 | $1,787,701.38 | -81.037 | -42.8571 | -16.6667 | 0 |
| BID | BIDENERGY | 1.49 | $156,272,096.00 | 1596.8326 | 172.3311 | 51.5152 | 2.7397 |
| BTH | BIGTINCAN HOLDINGS | 0.34 | $70,977,864.00 | -26.5957 | 6.1538 | 16.9492 | 13.1148 |
| BRN | BRAINCHIP HOLDINGS | 0.088 | $92,389,752.00 | -59.0698 | -41.3333 | -23.4783 | -8.3333 |
| BVS | BRAVURA SOLUTIONS | 4.15 | $901,976,064.00 | 131.3989 | 31.2308 | 11.6402 | 3.1785 |
| BIQ | BUILDINGIQ INC-CDI | 0.04 | $9,968,953.00 | -63.6364 | -39.3939 | 8.1081 | 0 |
| CAG | CAPE RANGE | 1.51 | $125,487,448.00 | 571.1111 | 302.6667 | -11.9534 | 1.0033 |
| CWL | CHANT WEST HOLDINGS | 0.055 | $6,815,809.00 | -8.3333 | 25 | -8.3333 | 0 |
| CL1 | CLASS | 1.37 | $154,137,296.00 | -57.1766 | -38.8841 | -13.8614 | -13.4328 |
| CXZ | CONNEXION TELEMATICS | 0.012 | $11,790,312.00 | 30 | 160 | 30 | -7.1429 |
| COO | CORUM GROUP | 0.026 | $6,660,357.50 | -33.3333 | 13.0435 | -16.129 | -16.129 |
| DCC | DIGITALX | 0.045 | $22,985,520.00 | -87.8947 | -49.4505 | -8 | -11.5385 |
| DTS | DRAGONTAIL SYSTEMS | 0.17 | $42,160,000.00 | -32 | 13.3333 | -2.8571 | 0 |
| DSE | DROPSUITE | 0.03 | $14,407,416.00 | -46.5517 | -77.037 | 14.8148 | 19.2308 |
| DUB | DUBBER CORP | 0.4 | $59,376,068.00 | -15.7895 | -10.1124 | -11.1111 | 0 |
| ELO | ELMO SOFTWARE | 5.32 | $334,966,304.00 | -1.3011 | -6.8421 | -1.4842 | -0.9328 |
| EOL | ENERGY ONE | 1.14 | $23,652,644.00 | 60.66 | 34.8397 | 6.7308 | 5.7143 |
| EVS | ENVIROSUITE | 0.072 | $23,284,976.00 | -4.1096 | 34.6154 | 34.6154 | 2.9412 |
| ESV | ESERVGLOBAL | 0.091 | $110,187,408.00 | -59.5556 | -39.3333 | 4.5977 | 18.1818 |
| FAM | FAMILY INSIGHTS GROUP | 0.002 | $4,155,776.75 | -79.1667 | -33.3333 | 0 | 0 |
| FGO | FLAMINGO AI | 0.016 | $17,922,044.00 | -78.9474 | -55.5556 | -15.7895 | -11.1111 |
| GSW | GETSWIFT | 0.415 | $76,352,344.00 | -86.9085 | 15.2778 | 2.4691 | 7.7922 |
| GOO | GOOROO VENTURES | 0.055 | $5,209,964.00 | -29.9557 | -18.9487 | -17.7741 | 5.7692 |
| HSN | HANSEN TECHNOLOGIES | 3.48 | $695,597,952.00 | -4.2003 | 13.4939 | 2.6471 | 1.1594 |
| HSC | HOMESTAY CARE | 0.038 | $26,409,974.00 | 74.954 | 49.9605 | -2.5641 | 8.5714 |
| ID8 | IDENTITII | 0.68 | $37,023,116.00 | 1.4925 | -2.8571 | ||
| IME | IMEXHS | 0.033 | $29,621,030.00 | 13.3333 | 13.3333 | 36 | 3.0303 |
| IFM | INFOMEDIA | 1.225 | $382,722,464.00 | 49.1709 | 27.8764 | 13.3641 | 3.7975 |
| IRI | INTEGRATED RESEARCH | 2.2 | $374,569,248.00 | -43.4027 | -8.9099 | 29.6188 | 32.3353 |
| IHR | INTELLIHR HOLDINGS | 0.175 | $14,224,518.00 | -50 | 35 | 50 | |
| IAM | INTIGER GROUP | 0.009 | $13,423,167.00 | -30.7692 | -50 | -10 | -10 |
| IOD | IODM | 0.018 | $8,915,726.00 | 80 | 28.5714 | 5.8823 | 0 |
| IRE | IRESS | 11.52 | $1,999,307,392.00 | 3.3093 | -1.196 | 6.7718 | 5.4029 |
| ISD | ISENTIA GROUP | 0.295 | $59,000,000.00 | -78.4704 | -62.4204 | 5.3571 | 1.7241 |
| ISX | ISIGNTHIS | 0.15 | $161,538,528.00 | -6.25 | -25 | -9.0909 | 3.4483 |
| IXU | IXUP | 0.1 | $16,636,594.00 | -79.1667 | -64.2857 | 5.2632 | -9.0909 |
| JAN | JANISON EDUCATION GROUP | 0.365 | $52,387,096.00 | -18.8889 | -15.1163 | -12.0482 | -3.9474 |
| JCS | JCURVE SOLUTIONS | 0.042 | $13,769,990.00 | -2.3256 | 35.4839 | 0 | 2.439 |
| KNO | KNOSYS | 0.055 | $7,877,956.50 | 0 | -15.3846 | -11.2903 | -8.3333 |
| KYK | KYCKR | 0.07 | $10,567,542.00 | -72 | -54.8387 | -12.5 | 0 |
| LNU | LINIUS TECHNOLOGIES | 0.052 | $50,657,268.00 | -71.8919 | -26.7606 | -5.4545 | 1.9608 |
| LVH | LIVEHIRE | 0.57 | $144,527,536.00 | -54.6875 | 22.1053 | 23.4043 | 9.434 |
| LVT | LIVETILES | 0.37 | $190,292,416.00 | -17.9775 | -32.4074 | 28.0702 | 0 |
| LVE | LOVE GROUP GLOBAL | 0.092 | $4,072,547.25 | 10 | 32 | -17.5 | 0 |
| MTL | MANALTO | 0.001 | $3,642,388.75 | -85.7143 | 0 | 0 | 0 |
| MNW | MINT PAYMENTS | 0.029 | $23,559,102.00 | -38.2979 | -3.3333 | 11.5385 | 16 |
| MBM | MOBECOM | 0.11 | $23,878,932.00 | -72.5 | -45 | -12 | -12 |
| MOQ | MOQ | 0.2 | $32,264,140.00 | -9.0909 | -27.2727 | -13.0435 | -11.1111 |
| MPW | MSL SOLUTIONS | 0.14 | $34,977,652.00 | -44 | -26.3158 | -9.6774 | 0 |
| MYQ | MYFIZIQ | 0.285 | $25,896,952.00 | -79.0541 | -6.0606 | 8.7719 | 6.8966 |
| MYO | MYOB GROUP | 3.365 | $1,985,095,424.00 | -2.5664 | 12.6447 | -5.3521 | 0.2985 |
| NET | NETLINKZ | 0.027 | $38,565,016.00 | -10 | -18.1818 | -6.8965 | -10 |
| NOR | NORWOOD SYSTEMS | 0.004 | $5,769,283.00 | -80.9524 | -42.8571 | 0 | 0 |
| NOV | NOVATTI GROUP | 0.175 | $26,776,416.00 | -48.5294 | -16.6667 | -5.4054 | 0 |
| OCL | OBJECTIVE CORPORATION | 2.79 | $258,613,584.00 | -5.3511 | -0.7179 | 7.3077 | 3.3333 |
| OMN | ONEMARKET | 0.605 | $62,877,128.00 | -40.3941 | -11.0294 | 1.6807 | |
| OOK | OOKAMI | 0.011 | $3,605,134.00 | -90 | -38.8889 | 0 | 0 |
| ODA | ORCODA | 0.18 | $16,105,686.00 | -52 | -31.4286 | -10 | -7.6923 |
| OLV | OTHERLEVELS HOLDINGS LIMITED | 0.024 | $6,704,193.50 | -20 | -46.6667 | -17.2414 | 0 |
| PYG | PAYGROUP | 0.76 | $39,270,316.00 | -1.2987 | -11.1111 | 0 | |
| PIL | PEPPERMINT INNOVATION | 0.016 | $15,801,319.00 | -27.2727 | -20 | 14.2857 | 6.6667 |
| 3DP | POINTERRA | 0.052 | $25,018,710.00 | -67.3333 | 28.9474 | 22.5 | 16.6667 |
| PPS | PRAEMIUM | 0.76 | $285,577,632.00 | -6.4516 | -30.2885 | 11.5385 | 3.5714 |
| RKN | RECKON | 0.685 | $78,173,432.00 | -55.02 | -21.9684 | 4.5802 | -0.7246 |
| RFN | REFFIND | 0.007 | $3,608,500.00 | -85.1064 | -22.2222 | 0 | 40 |
| RD1 | REGISTRY DIRECT | 0.025 | $3,231,999.75 | -78.0255 | 38.8889 | -16.6667 | -16.6667 |
| RUL | RPMGLOBAL HOLDINGS | 0.585 | $126,405,352.00 | -24.026 | -0.8475 | 1.7391 | -2.5 |
| SCL | SCHROLE GROUP | 0.015 | $9,470,553.00 | -44.4444 | 7.1429 | 7.1429 | 0 |
| SNS | SENSEN NETWORKS | 0.092 | $36,832,788.00 | -45.8824 | -45.8824 | -16.3636 | 4.5455 |
| S3R | SERPENTINE TECHNOLOGIES | 0.003 | $1,444,192.25 | -76.9231 | 0 | 0 | -25 |
| SRO | SHAREROOT | 0.002 | $3,138,908.75 | -71.4286 | -60 | -33.3333 | 33.3333 |
| SIS | SIMBLE SOLUTIONS | 0.08 | $8,156,618.50 | -50 | -11.1111 | 5.2632 | |
| STC | SINETECH | 0.0025 | $1,764,541.00 | -82.1429 | -64.2857 | 25 | 25 |
| SKF | SKYFII | 0.155 | $48,385,268.00 | 19.2308 | 19.2308 | 3.3333 | -3.125 |
| SYT | SYNTONIC | 0.007 | $20,874,772.00 | -58.8235 | -56.25 | -22.2222 | 0 |
| TBL | TAMBLA | 0.011 | $10,886,610.00 | 37.5 | -15.3846 | 10 | 10 |
| TCN | TECHNICHE | 0.035 | $7,585,896.00 | -12.5 | -16.6667 | -12.5 | -2.7778 |
| TNE | TECHNOLOGY ONE | 6.64 | $2,045,423,232.00 | 34.6047 | 50.5831 | 5.1948 | 5.8824 |
| TKF | TIKFORCE | 0.001 | $223,032.72 | -94.8718 | -75 | 0 | 0 |
| TTL | TRANSCENDENCE TECHNOLOGIES L | 0.013 | $2,432,089.25 | -69.5652 | -36.3636 | -22.2222 | 0 |
| TYM | TYMLEZ GROUP | 0.195 | $24,829,194.00 | 42.8571 | 5.2632 | ||
| UBN | URBANISE.COM | 0.038 | $25,934,914.00 | -11.6279 | 40.7407 | -15.5556 | -2.5641 |
| VLT | VAULT INTELLIGENCE | 0.18 | $19,554,234.00 | -34.4828 | -24 | 5.5556 | 18.75 |
| WTC | WISETECH GLOBAL | 19.665 | $5,752,580,096.00 | 38.4036 | 6.6732 | 6.3545 | 6.177 |
| XRO | XERO | 43.24 | $5,906,845,184.00 | 41.3551 | -8.5116 | 8.1461 | -2.6884 |
| XPE | XPED | 0.003 | $4,520,492.50 | -57.1429 | 0 | 20 | 50 |
| XF1 | XREF | 0.46 | $75,249,424.00 | -32.0896 | -11.6505 | -5.2083 | 7.0588 |
| YOJ | YOJEE | 0.058 | $50,846,400.00 | -80.339 | -55.3846 | -14.7059 | 0 |


Get the latest Stockhead news delivered free to your inbox.


