
Pic: ADragan, iStock / Getty Images Plus
Gold Digger: Why should punters care how green their gold is? Because big institutional investors do
Mining
Pic: ADragan, iStock / Getty Images Plus
Mining
Our Gold Digger column wraps all the news driving ASX stocks with exposure to precious metals.
To create max value for shareholders, miners know they need good Environmental, Social and Governance (ESG) credentials.
Failing to maintain good relationships with governments and local communities or meet environmental expectations can lead to large fines, production disruption, or even mine closures.
An investor’s worst nightmare.
In the last few years there has also been rapid growth in ESG-related investing, with several large fund management groups now refusing to invest in some types of mining companies — like coal producers — because of their environmental impact.
Major gold miners are responding to this increased scrutiny.
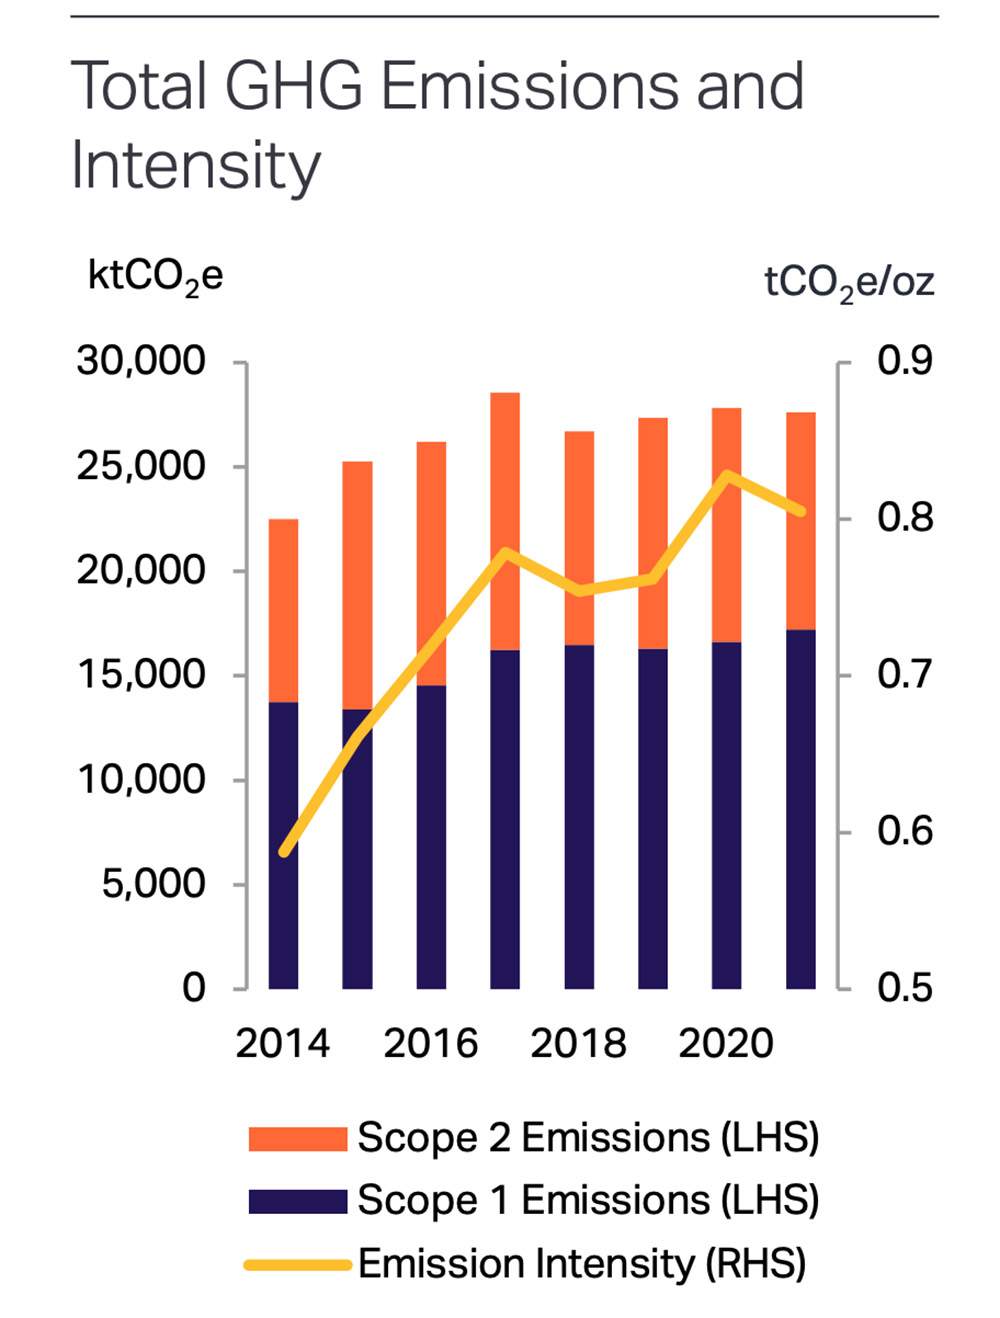
Metals Focus’ Gold ESG Focus 2022 report features analysis of ESG metrics from 16 of the world’s biggest gold miners, including Newcrest (ASX:NCM), from 2014-2021.
It shows an overall reduction in emissions and water usage and increases in payments to governments and spending on community projects.
Combined scope 1 (from on-site activities) and 2 (incudes power purchased from grid) greenhouse gas emissions from the gold miners covered in the report fell by 1% y/y in 2021, Metals Focus says.
“The average emissions intensity of gold production also fell, dropping by 3% y/y to 0.81 tCO2e/oz,” it says.
“This was driven by companies’ actions to cut emissions alongside increased operational efficiencies following disruption from the COVID-19 pandemic in 2020.
“This emission intensity figure, combined with global gold output of 3,577t in 2021, implies that direct emissions from the entire gold mining industry were approximately 93 MtCO2e during the year.
“This represents 0.3% of global emissions, which the International Energy Agency (IEA) estimated at 36,000 MtCO2e in 2021.”
Meanwhile, water consumption plummeted, largely thanks to some tricky accounting.
Water is widely used in gold processing, in dust suppression in mining areas, and is a necessity for workers on site.
In 2021, water withdrawals fell by 5% y/y in 2021, while water consumption dropped by 34%.
This fall in consumption was largely due to a change in reporting by Newcrest, “who excluded sea water use at Lihir in Papua New Guinea from their consumption figures in 2021 having previous included it”, Metals Focus says.
Payments to governments increased by 39% y/y to $9.4bn, while spending on community projects increased by 7% to $260m, Metals Focus says.
“This was mainly due to significantly less disruption from the COVID-19 pandemic alongside sustained high gold prices, both of which boosted profits and led to increased tax and royalty payments,” it says.
“Local procurement spend also increased, rising by 32% to $16.1bn, as several gold miners increased spending on development or expansion projects.”
Our CEO Darren Stralow on stage at the @MinResWA Net Zero Emission Mining WA Conference, discussing the work we have been doing to decarbonise the Bellevue Project. $BGL is committed to decarbonisation by 2026 and all staff are aligned to achieve this goal.https://t.co/1ncmhQ4iTs
— Bellevue Gold Limited (@BellevueGold) September 1, 2022
Bellevue Gold’s (ASX:BGL) new 200,000ozpa gold mine in WA’s northern Goldfields is expected to produce at one of the lowest carbon intensities in the Australian gold industry, if not the world.
Corporate sustainability head Luke Gleeson says a mix of solar, wind and support from gas generation giving it a renewable mix of up to 80% on opening.
“We’re looking at anywhere between 0.12-0.2t of carbon an ounce,” Gleeson said early August.
“The sector’s running at about 0.79t/oz of carbon at the moment, so we’ll be in the bottom quartile on carbon intensity and emissions intensity.”
With major funds like BlackRock (~17%) on the top of Bellevue’s register, Gleeson thinks this approach to carbon emissions and social responsibility is crucial to appeal to large institutional investors.
“You only need to look as far as guys like Larry Fink and Evy Hambro, who runs the gold fund at BlackRock, they’re right behind the vision of what we’re looking at doing,” Gleeson says.
“One of the things you’ve always seen in mining is a cost curve, the other thing you’ll see more of is a carbon curve.
“What I mean by that is the world doesn’t want every last tonne of nickel, copper or lithium if it’s up that intensity curve.”
Tom Palmer, who runs one of the largest gold mining companies in Newmont, has mentioned that ESG is going to change the investor landscape in gold, Gleeson says.
“He’s 100% right, so we’re positioning Bellevue to be insulated from that effect,” he says.
“Potentially we’ll have the ability to be able to sell a product that could effectively trade at a premium.”
Here’s how ASX-listed precious metals stocks are performing:
Scroll or swipe to reveal table. Click headings to sort. Best viewed on a laptop.
Stocks missing from this list? Email [email protected]
| CODE | COMPANY | 1 WEEK RETURN % | 1 MONTH RETURN % | 6 MONTH RETURN % | 1 YEAR RETURN % | PRICE | MARKET CAP |
|---|---|---|---|---|---|---|---|
| SIH | Sihayo Gold Limited | 50% | 20% | -50% | -70% | 0.003 | $18,306,384.27 |
| DTM | Dart Mining NL | 47% | 46% | 17% | 0% | 0.115 | $16,907,520.00 |
| DRE | Dreadnought Resources Ltd | 40% | 106% | 268% | 233% | 0.14 | $425,744,697.14 |
| PNM | Pacific Nickel Mines | 36% | 33% | 14% | 88% | 0.105 | $27,127,585.60 |
| MOH | Moho Resources | 35% | 59% | -26% | -44% | 0.035 | $5,814,541.74 |
| TMX | Terrain Minerals | 29% | 29% | 29% | 0% | 0.009 | $6,846,849.08 |
| SI6 | SI6 Metals Limited | 29% | 20% | -10% | -22% | 0.009 | $13,393,701.71 |
| BEZ | Besragoldinc | 22% | 10% | -46% | 0% | 0.044 | $7,733,248.20 |
| TG1 | Techgen Metals Ltd | 21% | 43% | 82% | 14% | 0.2 | $8,399,599.04 |
| AVM | Advance Metals Ltd | 20% | 20% | -25% | -29% | 0.012 | $5,256,651.42 |
| LNY | Laneway Res Ltd | 20% | 20% | 14% | 57% | 0.006 | $35,959,090.26 |
| TSC | Twenty Seven Co. Ltd | 20% | 0% | -25% | 0% | 0.003 | $7,982,441.72 |
| CY5 | Cygnus Gold Limited | 19% | 55% | 55% | 114% | 0.31 | $41,211,888.20 |
| OKR | Okapi Resources | 18% | 33% | -13% | -46% | 0.26 | $34,664,406.24 |
| AQI | Alicanto Min Ltd | 18% | 5% | -37% | -50% | 0.06 | $23,022,817.02 |
| REZ | Resourc & En Grp Ltd | 15% | 0% | -48% | -21% | 0.023 | $11,495,533.15 |
| CTO | Citigold Corp Ltd | 14% | 14% | -11% | -20% | 0.008 | $19,835,613.64 |
| TRM | Truscott Mining Corp | 11% | -18% | 25% | 38% | 0.04 | $6,314,821.76 |
| GAL | Galileo Mining Ltd | 11% | 2% | 469% | 270% | 1.11 | $220,110,209.90 |
| HAW | Hawthorn Resources | 11% | 5% | 5% | 67% | 0.092 | $30,683,436.40 |
| TSO | Tesoro Gold Ltd | 11% | -5% | -42% | -61% | 0.041 | $34,139,231.16 |
| MXR | Maximus Resources | 11% | 2% | -20% | -35% | 0.052 | $15,945,288.40 |
| AL8 | Alderan Resource Ltd | 10% | 22% | -42% | -79% | 0.011 | $5,847,226.88 |
| MEG | Megado Minerals Ltd | 10% | 41% | 43% | 15% | 0.11 | $11,995,367.78 |
| CXU | Cauldron Energy Ltd | 10% | 22% | -48% | -66% | 0.011 | $5,889,524.05 |
| ZAG | Zuleika Gold Ltd | 10% | -4% | -33% | -24% | 0.022 | $11,474,113.75 |
| HCH | Hot Chili Ltd | 10% | 29% | -33% | -62% | 0.885 | $106,903,459.37 |
| BNZ | Benzmining | 9% | 47% | -5% | -27% | 0.55 | $28,968,227.20 |
| OZM | Ozaurum Resources | 9% | 0% | 4% | 0% | 0.125 | $8,714,500.00 |
| NVA | Nova Minerals Ltd | 8% | 2% | 54% | -28% | 0.9 | $165,786,102.20 |
| NAE | New Age Exploration | 8% | 17% | -46% | -36% | 0.007 | $10,051,292.37 |
| CLA | Celsius Resource Ltd | 8% | -13% | -42% | -46% | 0.014 | $20,921,152.60 |
| RDT | Red Dirt Metals Ltd | 7% | 45% | 5% | 231% | 0.58 | $178,164,339.21 |
| PRS | Prospech Limited | 7% | 15% | -36% | -67% | 0.03 | $1,955,430.15 |
| NSM | Northstaw | 7% | -12% | -50% | -53% | 0.15 | $6,019,050.00 |
| LEX | Lefroy Exploration | 7% | 3% | -9% | -35% | 0.31 | $44,491,773.74 |
| POL | Polymetals Resources | 7% | 7% | 24% | 7% | 0.155 | $6,383,317.26 |
| BGD | Bartongoldholdings | 7% | -11% | -35% | -18% | 0.16 | $13,753,475.68 |
| HXG | Hexagon Energy | 7% | -6% | -70% | -78% | 0.016 | $7,693,738.52 |
| AAR | Astral Resources NL | 6% | 10% | -23% | 5% | 0.085 | $52,463,773.03 |
| ARN | Aldoro Resources | 6% | 28% | -31% | -51% | 0.255 | $25,394,765.84 |
| G88 | Golden Mile Res Ltd | 6% | 30% | -38% | -33% | 0.035 | $6,723,176.26 |
| GTR | Gti Energy Ltd | 6% | 12% | -10% | -2% | 0.019 | $27,098,704.42 |
| BMR | Ballymore Resources | 5% | 5% | 29% | 0% | 0.2 | $14,328,225.80 |
| VRC | Volt Resources Ltd | 5% | 18% | 43% | -33% | 0.02 | $66,413,275.54 |
| WCN | White Cliff Min Ltd | 5% | 75% | -19% | 91% | 0.021 | $13,725,670.60 |
| ICL | Iceni Gold | 5% | 17% | -9% | -50% | 0.105 | $13,460,624.94 |
| LYN | Lycaonresources | 5% | 26% | -10% | 0% | 0.315 | $10,054,406.25 |
| LCY | Legacy Iron Ore | 5% | 0% | 11% | 50% | 0.021 | $128,136,523.98 |
| PKO | Peako Limited | 5% | 24% | 17% | -19% | 0.021 | $6,169,082.02 |
| SFM | Santa Fe Minerals | 5% | 0% | -60% | 4% | 0.085 | $6,189,597.07 |
| DEX | Duke Exploration | 5% | -16% | -63% | -77% | 0.065 | $5,863,724.88 |
| KSN | Kingston Resources | 5% | -11% | -46% | -52% | 0.087 | $37,205,696.25 |
| NWM | Norwest Minerals | 5% | 53% | 28% | -5% | 0.069 | $10,836,443.22 |
| CYL | Catalyst Metals | 4% | 2% | -28% | -31% | 1.305 | $128,485,273.14 |
| NMR | Native Mineral Res | 4% | -13% | -42% | -45% | 0.13 | $6,217,837.99 |
| FML | Focus Minerals Ltd | 4% | -16% | -52% | -48% | 0.13 | $37,252,623.85 |
| KAL | Kalgoorliegoldmining | 4% | 4% | -21% | 0% | 0.135 | $9,778,671.00 |
| IDA | Indiana Resources | 3% | 16% | 7% | 10% | 0.064 | $30,803,508.42 |
| DTR | Dateline Resources | 3% | -1% | 18% | 7% | 0.098 | $52,900,186.36 |
| TLM | Talisman Mining | 3% | 3% | -3% | 0% | 0.165 | $30,977,017.01 |
| SAU | Southern Gold | 3% | 6% | -36% | -47% | 0.035 | $7,253,177.70 |
| RGL | Riversgold | 3% | 24% | 73% | 20% | 0.036 | $27,131,647.76 |
| KIN | KIN Min NL | 3% | -15% | -25% | -37% | 0.075 | $74,702,546.03 |
| A1G | African Gold Ltd. | 2% | -15% | -62% | -50% | 0.085 | $10,149,877.88 |
| AWJ | Auric Mining | 2% | 12% | -8% | -37% | 0.085 | $5,166,838.73 |
| GRL | Godolphin Resources | 2% | 1% | -26% | -44% | 0.089 | $9,172,632.54 |
| GUL | Gullewa Limited | 2% | -5% | -15% | -33% | 0.061 | $11,645,089.10 |
| STK | Strickland Metals | 1% | -14% | -14% | 28% | 0.05 | $66,540,383.05 |
| MAU | Magnetic Resources | 1% | 6% | -27% | -37% | 1.01 | $225,310,444.00 |
| IGO | IGO Limited | 1% | 16% | 10% | 33% | 12.8 | $9,852,054,247.13 |
| NPM | Newpeak Metals | 0% | 0% | 0% | 0% | 0.001 | $8,853,750.03 |
| FFX | Firefinch Ltd | 0% | 0% | -17% | 2% | 0.2 | $236,248,644.20 |
| GED | Golden Deeps | 0% | 55% | 70% | 55% | 0.017 | $18,483,627.42 |
| AQX | Alice Queen Ltd | 0% | 0% | -63% | -76% | 0.003 | $6,461,083.37 |
| PNX | PNX Metals Limited | 0% | 0% | -20% | -41% | 0.004 | $17,776,231.23 |
| GIB | Gibb River Diamonds | 0% | 28% | -9% | -6% | 0.059 | $12,479,057.26 |
| BNR | Bulletin Res Ltd | 0% | 22% | -10% | 109% | 0.14 | $40,962,754.00 |
| FAU | First Au Ltd | 0% | -13% | -22% | -46% | 0.007 | $6,519,876.64 |
| MVL | Marvel Gold Limited | 0% | 7% | -40% | -48% | 0.029 | $20,425,261.73 |
| PRX | Prodigy Gold NL | 0% | 14% | -36% | -60% | 0.016 | $7,574,158.88 |
| AAU | Antilles Gold Ltd | 0% | -4% | -38% | -35% | 0.05 | $20,609,536.05 |
| AWV | Anova Metals Ltd | 0% | 8% | -32% | -46% | 0.013 | $19,475,224.60 |
| MCT | Metalicity Limited | 0% | 67% | -20% | -42% | 0.005 | $15,564,177.03 |
| M2R | Miramar | 0% | 14% | -31% | -41% | 0.12 | $7,702,399.56 |
| TRY | Troy Resources Ltd | 0% | 0% | 0% | 0% | 0.0295 | $50,138,963.94 |
| KGM | Kalnorth Gold Ltd | 0% | 0% | 0% | 0% | 0.013 | $11,625,120.78 |
| CGN | Crater Gold Min Ltd | 0% | 0% | 0% | 0% | 0.017 | $21,063,473.65 |
| ADV | Ardiden Ltd | 0% | 0% | -36% | -43% | 0.008 | $21,346,682.85 |
| VKA | Viking Mines Ltd | 0% | 0% | -42% | -63% | 0.007 | $7,176,809.02 |
| LCL | Los Cerros Limited | 0% | -6% | -70% | -76% | 0.033 | $22,772,709.93 |
| MTH | Mithril Resources | 0% | -8% | -45% | -65% | 0.006 | $17,641,398.25 |
| DDD | 3D Resources Limited | 0% | 0% | -33% | -50% | 0.002 | $8,863,744.18 |
| RMX | Red Mount Min Ltd | 0% | 17% | -13% | -22% | 0.007 | $11,496,547.01 |
| XTC | Xantippe Res Ltd | 0% | 29% | 13% | 350% | 0.009 | $73,131,611.92 |
| GMN | Gold Mountain Ltd | 0% | 40% | -13% | -67% | 0.007 | $8,352,044.19 |
| HMG | Hamelingoldlimited | 0% | 5% | -14% | 0% | 0.15 | $16,500,000.00 |
| HMG | Hamelingoldlimited | 0% | 5% | -14% | 0% | 0.15 | $16,500,000.00 |
| PF1 | Pathfinder Resources | 0% | 0% | 16% | 79% | 0.5 | $26,560,505.00 |
| ARV | Artemis Resources | 0% | 36% | -51% | -61% | 0.034 | $47,203,253.46 |
| KCC | Kincora Copper | 0% | -9% | -54% | -66% | 0.062 | $4,562,215.38 |
| AUT | Auteco Minerals | 0% | -8% | -45% | -51% | 0.044 | $90,961,295.39 |
| TAM | Tanami Gold NL | 0% | -17% | -25% | -37% | 0.044 | $51,704,270.02 |
| WMC | Wiluna Mining Corp | 0% | 0% | -76% | -77% | 0.205 | $74,238,030.68 |
| BAT | Battery Minerals Ltd | 0% | -17% | -50% | -64% | 0.005 | $14,626,211.73 |
| KAI | Kairos Minerals Ltd | 0% | 8% | 33% | -10% | 0.028 | $54,994,617.75 |
| VAN | Vango Mining Ltd | 0% | -14% | -3% | -40% | 0.038 | $47,877,630.02 |
| AVW | Avira Resources Ltd | 0% | 33% | -20% | -20% | 0.004 | $8,475,160.00 |
| BRV | Big River Gold Ltd | 0% | 3% | 69% | 16% | 0.355 | $88,245,456.25 |
| LRL | Labyrinth Resources | 0% | 0% | -41% | -43% | 0.024 | $20,960,802.12 |
| XAM | Xanadu Mines Ltd | 0% | 27% | 22% | 22% | 0.033 | $45,192,326.88 |
| MBK | Metal Bank Ltd | 0% | -20% | -33% | -58% | 0.004 | $10,431,272.64 |
| S2R | S2 Resources | 0% | 7% | -19% | 16% | 0.145 | $51,674,353.98 |
| ICG | Inca Minerals Ltd | 0% | -2% | -51% | -57% | 0.049 | $26,504,210.65 |
| M24 | Mamba Exploration | 0% | 0% | -39% | -41% | 0.1 | $4,217,500.30 |
| DLC | Delecta Limited | 0% | 0% | 0% | 83% | 0.0275 | $13,253,984.40 |
| SNG | Siren Gold | 0% | -12% | -17% | -17% | 0.22 | $22,403,393.02 |
| E2M | E2 Metals | 0% | -6% | -28% | -44% | 0.145 | $29,869,848.45 |
| ANL | Amani Gold Ltd | 0% | 0% | -25% | -25% | 0.0015 | $35,540,161.69 |
| LM8 | Lunnonmetalslimited | -1% | -6% | 4% | 61% | 0.915 | $97,789,753.03 |
| EMR | Emerald Res NL | -1% | 5% | 5% | 41% | 1.155 | $685,493,635.37 |
| FEG | Far East Gold | -1% | 29% | 0% | 0% | 0.465 | $54,306,558.45 |
| HAV | Havilah Resources | -1% | 38% | 109% | 87% | 0.365 | $120,322,899.80 |
| ZNC | Zenith Minerals Ltd | -2% | -7% | -11% | 56% | 0.32 | $106,876,306.49 |
| BYH | Bryah Resources Ltd | -2% | -10% | -43% | -49% | 0.027 | $8,377,604.22 |
| STN | Saturn Metals | -2% | -22% | -30% | -36% | 0.27 | $35,722,273.68 |
| PNT | Panthermetalsltd | -2% | 9% | 9% | 0% | 0.245 | $7,105,000.00 |
| MEU | Marmota Limited | -2% | -8% | 12% | 14% | 0.048 | $50,177,597.42 |
| RND | Rand Mining Ltd | -2% | -5% | -5% | -3% | 1.42 | $80,763,864.62 |
| CAZ | Cazaly Resources | -3% | -3% | -7% | -15% | 0.039 | $14,462,049.93 |
| DCN | Dacian Gold Ltd | -3% | -11% | -54% | -57% | 0.0975 | $117,271,787.89 |
| CEL | Challenger Exp Ltd | -3% | -4% | -44% | -31% | 0.19 | $200,404,148.10 |
| AXE | Archer Materials | -3% | -3% | -28% | -55% | 0.74 | $191,319,749.39 |
| AME | Alto Metals Limited | -3% | 28% | -9% | -15% | 0.073 | $39,021,238.38 |
| HRZ | Horizon | -3% | 1% | -40% | -33% | 0.072 | $44,741,887.49 |
| AAJ | Aruma Resources Ltd | -3% | 13% | -18% | -19% | 0.07 | $10,202,497.70 |
| MDI | Middle Island Res | -3% | -25% | -41% | -32% | 0.068 | $8,324,439.10 |
| KAU | Kaiser Reef | -3% | -8% | -13% | -26% | 0.165 | $21,423,717.81 |
| ENR | Encounter Resources | -3% | 14% | 27% | -4% | 0.165 | $52,340,776.29 |
| YRL | Yandal Resources | -3% | 3% | -45% | -69% | 0.16 | $18,574,648.48 |
| ARL | Ardea Resources Ltd | -3% | -17% | 36% | 103% | 0.93 | $159,553,505.68 |
| TBA | Tombola Gold Ltd | -3% | 3% | 11% | -24% | 0.031 | $34,941,207.71 |
| KTA | Krakatoa Resources | -3% | 27% | 41% | -13% | 0.062 | $21,372,014.85 |
| TCG | Turaco Gold Limited | -3% | 2% | -43% | -52% | 0.06 | $25,663,000.14 |
| OBM | Ora Banda Mining Ltd | -3% | -5% | 18% | -37% | 0.058 | $82,439,238.18 |
| TTM | Titan Minerals | -3% | 4% | -53% | -53% | 0.056 | $78,972,349.85 |
| QML | Qmines Limited | -3% | -20% | -45% | -59% | 0.14 | $11,592,992.88 |
| CHZ | Chesser Resources | -3% | -6% | -16% | -49% | 0.084 | $49,990,464.35 |
| ADT | Adriatic Metals | -4% | 1% | -1% | -23% | 2.15 | $452,937,608.10 |
| NST | Northern Star | -4% | -6% | -26% | -25% | 7.42 | $8,680,190,353.90 |
| MGV | Musgrave Minerals | -4% | 0% | -12% | -22% | 0.26 | $139,664,966.74 |
| BBX | BBX Minerals Ltd | -4% | 3% | -43% | -61% | 0.077 | $37,423,653.58 |
| RXL | Rox Resources | -4% | 0% | -41% | -43% | 0.25 | $43,079,941.49 |
| RXL | Rox Resources | -4% | 0% | -41% | -43% | 0.25 | $43,079,941.49 |
| CST | Castile Resources | -4% | -17% | -31% | -44% | 0.12 | $28,395,983.76 |
| BCN | Beacon Minerals | -4% | -20% | -31% | -31% | 0.024 | $93,919,204.28 |
| GMD | Genesis Minerals | -4% | -19% | -32% | 56% | 1.145 | $385,516,647.05 |
| GML | Gateway Mining | -4% | 1% | -30% | -46% | 0.091 | $20,566,997.45 |
| WRM | White Rock Min Ltd | -4% | -22% | -56% | -74% | 0.09 | $16,530,222.96 |
| SVL | Silver Mines Limited | -4% | -9% | -22% | -18% | 0.1675 | $219,611,464.31 |
| GWR | GWR Group Ltd | -4% | -9% | -45% | -56% | 0.086 | $27,624,632.33 |
| MAT | Matsa Resources | -5% | -9% | -37% | -29% | 0.041 | $14,717,139.42 |
| CWX | Carawine Resources | -5% | -9% | -52% | -57% | 0.1 | $13,783,434.70 |
| TUL | Tulla Resources | -5% | -15% | -20% | 1% | 0.495 | $80,108,436.00 |
| CHN | Chalice Mining Ltd | -5% | -7% | -44% | -35% | 4.34 | $1,644,418,737.78 |
| HRN | Horizon Gold Ltd | -5% | -9% | -7% | 10% | 0.39 | $48,820,839.99 |
| MTC | Metalstech Ltd | -5% | -21% | 49% | 53% | 0.29 | $46,666,085.20 |
| GBZ | GBM Rsources Ltd | -5% | -11% | -50% | -50% | 0.057 | $31,058,377.56 |
| AZS | Azure Minerals | -5% | -14% | -50% | -45% | 0.19 | $59,039,786.99 |
| OKU | Oklo Resources Ltd | -5% | 0% | 54% | 19% | 0.14 | $71,890,748.26 |
| A8G | Australasian Metals | -5% | 14% | -41% | 44% | 0.28 | $11,527,738.32 |
| ERM | Emmerson Resources | -5% | -8% | -25% | 25% | 0.09 | $50,113,300.50 |
| WWI | West Wits Mining Ltd | -5% | -5% | -58% | -72% | 0.018 | $38,190,715.77 |
| MM8 | Medallion Metals. | -5% | -3% | -20% | -20% | 0.18 | $25,191,910.62 |
| GSN | Great Southern | -5% | -5% | -25% | -31% | 0.036 | $20,035,052.89 |
| BC8 | Black Cat Syndicate | -5% | -10% | -37% | -42% | 0.355 | $79,044,644.75 |
| FG1 | Flynngold | -6% | 1% | -32% | -40% | 0.099 | $6,342,043.95 |
| SVY | Stavely Minerals Ltd | -6% | 0% | -61% | -65% | 0.155 | $50,057,971.68 |
| CDT | Castle Minerals | -6% | 11% | -42% | 131% | 0.03 | $30,984,282.50 |
| BGL | Bellevue Gold Ltd | -6% | -6% | -21% | -18% | 0.7725 | $820,621,145.18 |
| KZR | Kalamazoo Resources | -6% | 5% | -25% | -40% | 0.22 | $31,942,762.28 |
| ANX | Anax Metals Ltd | -6% | 4% | -15% | -37% | 0.072 | $29,205,227.52 |
| GSR | Greenstone Resources | -7% | 47% | 97% | 188% | 0.069 | $74,795,211.92 |
| OGC | OceanaGold Corp. | -7% | -13% | -14% | -14% | 2.2 | $154,681,839.40 |
| NAG | Nagambie Resources | -7% | -9% | 28% | -15% | 0.068 | $34,893,938.74 |
| MRR | Minrex Resources Ltd | -7% | 2% | -7% | 253% | 0.053 | $55,977,464.56 |
| AGC | AGC Ltd | -7% | -8% | -30% | -47% | 0.066 | $4,470,000.74 |
| AGC | AGC Ltd | -7% | -8% | -30% | -47% | 0.066 | $4,470,000.74 |
| PGD | Peregrine Gold | -7% | 80% | 47% | 73% | 0.72 | $27,879,520.32 |
| SBR | Sabre Resources | -7% | 30% | 44% | 63% | 0.0065 | $16,738,386.05 |
| KRM | Kingsrose Mining Ltd | -7% | -4% | -26% | 16% | 0.052 | $38,378,852.47 |
| MI6 | Minerals260Limited | -7% | 10% | -27% | 0% | 0.32 | $70,400,000.00 |
| RVR | Red River Resources | -7% | -11% | -43% | -28% | 0.125 | $62,215,738.56 |
| TBR | Tribune Res Ltd | -7% | -2% | -24% | -28% | 3.61 | $191,508,481.05 |
| KNB | Koonenberrygold | -8% | -8% | -38% | 0% | 0.074 | $5,532,172.51 |
| PGO | Pacgold | -8% | -36% | -37% | 75% | 0.43 | $23,633,580.45 |
| GBR | Greatbould Resources | -8% | 5% | -33% | 13% | 0.097 | $41,018,600.78 |
| MZZ | Matador Mining Ltd | -8% | -12% | -61% | -72% | 0.115 | $35,261,391.13 |
| AUC | Ausgold Limited | -8% | -6% | 7% | 18% | 0.046 | $93,355,828.89 |
| NML | Navarre Minerals Ltd | -8% | -20% | -54% | -50% | 0.045 | $66,142,440.85 |
| KCN | Kingsgate Consolid. | -8% | -11% | 26% | 95% | 1.515 | $338,620,293.09 |
| MRZ | Mont Royal Resources | -8% | -7% | -13% | -15% | 0.28 | $20,445,965.06 |
| MEI | Meteoric Resources | -8% | -15% | -27% | -69% | 0.011 | $16,789,271.08 |
| RML | Resolution Minerals | -8% | 22% | -39% | -50% | 0.011 | $10,580,954.30 |
| X64 | Ten Sixty Four Ltd | -8% | -11% | -29% | -36% | 0.55 | $127,655,528.56 |
| SMI | Santana Minerals Ltd | -8% | -5% | 91% | 720% | 0.82 | $114,662,016.84 |
| ALK | Alkane Resources Ltd | -8% | -11% | -32% | -28% | 0.71 | $416,908,394.00 |
| RRL | Regis Resources | -8% | -12% | -20% | -39% | 1.52 | $1,158,964,794.88 |
| EM2 | Eagle Mountain | -9% | -9% | -59% | -72% | 0.215 | $57,676,988.55 |
| DEG | De Grey Mining | -9% | 1% | -23% | -28% | 0.91 | $1,290,761,042.49 |
| ALY | Alchemy Resource Ltd | -9% | 50% | 62% | 53% | 0.021 | $20,967,629.25 |
| PNR | Pantoro Limited | -9% | -4% | -45% | -11% | 0.1775 | $283,710,502.08 |
| DCX | Discovex Res Ltd | -9% | 0% | -42% | 5% | 0.005 | $16,512,840.49 |
| IVR | Investigator Res Ltd | -9% | -17% | -33% | -38% | 0.04 | $53,292,546.28 |
| CBY | Canterbury Resources | -9% | -9% | -50% | -65% | 0.04 | $4,927,941.20 |
| THR | Thor Mining PLC | -9% | 0% | -23% | -23% | 0.01 | $10,755,643.90 |
| MKR | Manuka Resources. | -9% | -17% | -52% | -54% | 0.145 | $41,472,955.25 |
| SSR | SSR Mining Inc. | -9% | -18% | -29% | -16% | 19.07 | $360,933,107.70 |
| GOR | Gold Road Res Ltd | -10% | -12% | -18% | -6% | 1.22 | $1,310,987,186.42 |
| NXM | Nexus Minerals Ltd | -10% | 2% | -32% | 53% | 0.23 | $66,855,372.13 |
| GMR | Golden Rim Resources | -10% | -16% | -58% | -56% | 0.046 | $14,440,016.22 |
| PUA | Peak Minerals Ltd | -10% | -10% | -25% | -47% | 0.009 | $9,372,336.76 |
| ASR | Asra Minerals Ltd | -10% | 0% | -31% | -36% | 0.018 | $27,820,969.15 |
| OAU | Ora Gold Limited | -10% | -10% | -50% | -47% | 0.009 | $8,858,081.55 |
| GNM | Great Northern | -10% | -10% | -25% | -55% | 0.0045 | $7,690,729.39 |
| MKG | Mako Gold | -10% | -11% | -27% | -31% | 0.062 | $23,698,979.32 |
| TAR | Taruga Minerals | -10% | 4% | -19% | -47% | 0.026 | $15,029,254.24 |
| BRB | Breaker Res NL | -10% | 8% | -14% | 0% | 0.215 | $70,055,799.74 |
| NCM | Newcrest Mining | -11% | -12% | -33% | -33% | 16.9 | $15,192,026,431.47 |
| SBM | St Barbara Limited | -11% | -25% | -36% | -46% | 0.8675 | $726,097,017.05 |
| ASO | Aston Minerals Ltd | -11% | 0% | -39% | -41% | 0.088 | $97,990,722.19 |
| MHC | Manhattan Corp Ltd | -11% | -20% | -43% | -11% | 0.008 | $12,210,229.54 |
| GSM | Golden State Mining | -11% | 19% | -34% | -55% | 0.056 | $6,552,795.42 |
| RDS | Redstone Resources | -11% | -11% | -20% | -20% | 0.008 | $5,894,659.17 |
| AGG | AngloGold Ashanti | -11% | -8% | -37% | -18% | 3.9 | $357,723,137.65 |
| TIE | Tietto Minerals | -11% | 1% | -15% | 44% | 0.475 | $482,297,332.65 |
| VMC | Venus Metals Cor Ltd | -11% | -11% | -11% | -3% | 0.155 | $24,812,195.87 |
| RSG | Resolute Mining | -12% | -4% | -2% | -42% | 0.265 | $298,139,229.63 |
| SMS | Starmineralslimited | -12% | -32% | -61% | 0% | 0.075 | $2,218,500.00 |
| MLS | Metals Australia | -12% | -15% | -2% | 30% | 0.052 | $30,958,845.74 |
| TMZ | Thomson Res Ltd | -12% | -12% | -63% | -80% | 0.022 | $18,056,538.98 |
| SLR | Silver Lake Resource | -12% | -15% | -32% | -14% | 1.21 | $1,142,134,362.95 |
| HMX | Hammer Metals Ltd | -12% | -29% | -31% | -37% | 0.051 | $40,182,903.54 |
| G50 | Gold50Limited | -12% | 7% | -38% | -43% | 0.145 | $8,122,610.15 |
| CMM | Capricorn Metals | -12% | -14% | -11% | 41% | 3.4 | $1,305,457,399.35 |
| KWR | Kingwest Resources | -12% | -11% | -68% | -12% | 0.057 | $16,340,155.44 |
| SLZ | Sultan Resources Ltd | -13% | 11% | -34% | -36% | 0.105 | $8,744,860.85 |
| AMI | Aurelia Metals Ltd | -13% | -6% | -46% | -31% | 0.245 | $303,172,117.92 |
| GCY | Gascoyne Res Ltd | -13% | 38% | 21% | 6% | 0.345 | $146,982,162.63 |
| GCY | Gascoyne Res Ltd | -13% | 38% | 21% | 6% | 0.345 | $146,982,162.63 |
| BMO | Bastion Minerals | -13% | -23% | -44% | -53% | 0.1 | $7,592,926.00 |
| SRN | Surefire Rescs NL | -13% | -24% | 0% | -7% | 0.013 | $20,557,725.20 |
| PDI | Predictive Disc Ltd | -14% | -21% | -14% | 42% | 0.185 | $315,913,378.91 |
| CDR | Codrus Minerals Ltd | -14% | 20% | -23% | -50% | 0.085 | $3,400,000.00 |
| NES | Nelson Resources. | -14% | -8% | -48% | -73% | 0.012 | $3,531,565.97 |
| CAI | Calidus Resources | -14% | -20% | -26% | -2% | 0.565 | $249,535,571.85 |
| BTR | Brightstar Resources | -15% | -15% | -43% | -37% | 0.017 | $10,996,634.77 |
| PRU | Perseus Mining Ltd | -15% | -16% | -16% | -8% | 1.415 | $1,965,873,890.88 |
| CPM | Coopermetalslimited | -15% | -5% | -30% | 0% | 0.45 | $16,734,000.60 |
| EVN | Evolution Mining Ltd | -15% | -18% | -47% | -46% | 2.17 | $4,017,266,741.25 |
| EMU | EMU NL | -15% | -8% | -31% | -62% | 0.011 | $6,047,959.32 |
| WAF | West African Res Ltd | -16% | -12% | 9% | 10% | 1.16 | $1,194,604,799.31 |
| SPQ | Superior Resources | -16% | 21% | 11% | 300% | 0.052 | $88,463,461.74 |
| AYM | Australia United Min | -17% | -17% | -17% | -55% | 0.005 | $9,212,887.43 |
| IPT | Impact Minerals | -18% | -13% | -40% | -40% | 0.007 | $17,369,593.89 |
| RED | Red 5 Limited | -18% | -10% | -27% | 5% | 0.225 | $531,486,948.15 |
| PUR | Pursuit Minerals | -19% | -24% | -38% | -78% | 0.013 | $12,912,889.52 |
| SKY | SKY Metals Ltd | -19% | -8% | -34% | -40% | 0.054 | $20,346,307.38 |
| SFR | Sandfire Resources | -19% | -13% | -33% | -37% | 3.94 | $1,664,526,485.58 |
| AM7 | Arcadia Minerals | -20% | 71% | 18% | 36% | 0.265 | $11,907,962.46 |
| RDN | Raiden Resources Ltd | -20% | 0% | -50% | -69% | 0.008 | $11,876,414.96 |
| RMS | Ramelius Resources | -21% | -26% | -49% | -53% | 0.73 | $637,528,055.12 |
| MEK | Meeka Metals Limited | -24% | 35% | 33% | 47% | 0.069 | $70,915,631.76 |
| WGX | Westgold Resources. | -26% | -31% | -61% | -52% | 0.86 | $416,788,002.40 |
| ADN | Andromeda Metals Ltd | -38% | -39% | -70% | -64% | 0.058 | $177,270,480.62 |
The explorer unveiled a new 100,000oz gold, 3.6Moz silver resource at the Sihorbo South prospect, part of the Hutabargot Julu project in Indonesia.
While modest in size, this resource will be the first of many, SIH says.
“South Sihorbo is one of multiple gold-silver targets identified within this vein field that are considered by the Company to be under-drilled or had no previous scout drilling,” it says.
“This initial maiden resource announced for Sihorbo South is the first delivered in the greater Hutabargot Julu project area.
“The mineral resource inventory is expected to grow with additional exploration drilling.”
Revered Stockhead columnist Barry Fitzgerald picked DTM as the ‘most under the radar ASX lithium stock right now’ having recently signed up Chile’s lithium king SQM to a lithium joint venture at its Dorchap project in northeast Victoria.
$US28 billion market cap SQM is one of the big three in the lithium business.
But DTM is also hunting gold deposits, with rock chips from its Granite Flat copper, gold and porphyry project grading up to 27.9g/t Au, 30g/t Ag and 2.83% Cu.
The company is currently drilling on its Granite Flat tenements with results due in the coming weeks.


Get the latest Stockhead news delivered free to your inbox.