
Mining
Monsters of Rock: Beam me up! Vulcan rockets 25% on lithium production start, budding price rebound

Mining
Gold Digger: Gold vs Bitcoin, analysts vs analysts – store of value narratives get in the ring
Mining

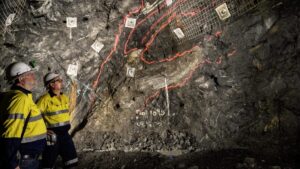
Pic: Getty
Mining
Investors generally buy gold as a way of diversifying risk when s..t hits the proverbial fan.
That’s why the precious metal appears to perform well in times of war or political instability. Conversely, stocks and bonds perform best in a stable political climate.
We are seeing this right now, as the threat of war between Russia and Ukraine grows.
The Aussie market has kicked off the session in the red as expected, with the #ASX200 down 64pts or 0.9% to 7232. Financials, healthcare, tech & miners (with exception of gold miners) are lower.
— CommSec (@CommSec) February 17, 2022
There’s a strong historical precedent for this behaviour.
For example, the Iranian Revolution, the Iran-Iraq war, the Soviet Union invasion of Afghanistan, and the Iranian hostage crisis saw gold rise:
More recently in August 2017 we saw the price of precious metals rise quite sharply as the US and North Korea engaged in some half-arsed sabre rattling.
In 2020, gold jumped to its highest level in almost seven years as Iran and the US threatened to cross swords.
It important to note that there’s a fair bit of evidence to suggest these gold price runs are not usually sustained by the drums of war alone. Prices have a tendency to snap back to the mean once markets have digested or disregarded the bad news.
But gold in 2022 has other things going for it, like rampant global inflation and resultant rate tightening cycle. This could be the spark gold needs.
This graphic highlights how gold performs during a rate tightening cycle, underperforming stocks and the dollar leading up to rate hikes, but outperforming when the cycle gets underway, as we’ve seen over the previous 4 cycles, so if history repeats, we’ll see gold price upside. pic.twitter.com/IpBpMoqDEx
— Gavin Wendt (@MineLifeReport) February 16, 2022
A month ago, no one wanted to touch gold, says Edward Moya, senior market analyst at OANDA.
“Now gold has suddenly become the flavour of the month, now that investors are scrambling for safe havens as geopolitical risks intensify and fears grow that the central banks might go overboard with tightening monetary policy,” he says.
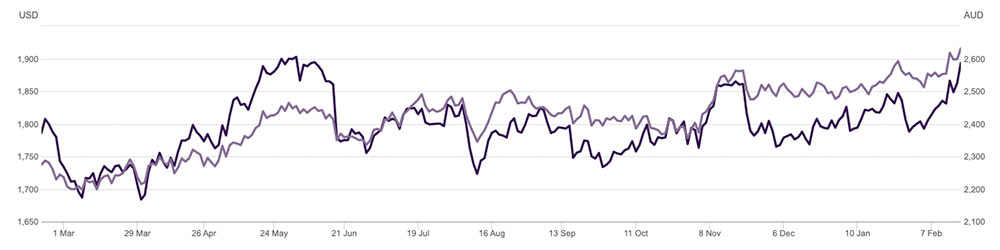
“A sea of red on Wall Street has sent gold above the $US1900 level and investors might see further bullish momentum if the Ukraine situation intensifies.
“Earlier de-escalation in Russia-Ukraine tensions in the week have been completely undone and now it seems the risks of an invasion are growing.
“Gold has key resistance around the $US1920 to $US1930 zone, but if the haven bid remains strong, bullish momentum could support a move towards the $US1970 level.”
Next stop: $US2,000/oz.
&Nbsp;
Here’s how ASX-listed gold & silver stocks are performing:
Scroll or swipe to reveal table. Click headings to sort. Best viewed on a laptop
>> Stocks missing from this list? Email [email protected]
| CODE | COMPANY | 1 WEEK RETURN % | 1 MONTH RETURN % | 6 MONTH RETURN % | 1 YEAR RETURN % | PRICE | MARKET CAP |
|---|---|---|---|---|---|---|---|
| ANL | Amani Gold | 50% | 0% | 50% | -25% | 0.0015 | $34,400,161.69 |
| BNR | Bulletin Res | 32% | 50% | 200% | 134% | 0.165 | $51,400,783.80 |
| BRV | Big River Gold | 23% | 13% | -16% | -19% | 0.295 | $66,063,499.50 |
| DTM | Dart Mining NL | 22% | 4% | -17% | -41% | 0.1 | $10,706,219.98 |
| NMR | Native Mineral Res | 20% | 23% | 13% | 7% | 0.27 | $12,135,321.00 |
| G50 | Gold50Limited | 20% | 8% | 0% | 0% | 0.27 | $15,124,860.27 |
| CHZ | Chesser Resources | 20% | 4% | -20% | -35% | 0.12 | $51,687,351.54 |
| RML | Resolution Minerals | 19% | 12% | 0% | -42% | 0.019 | $13,167,331.98 |
| RVR | Red River Resources | 16% | 10% | 26% | -10% | 0.22 | $111,469,864.92 |
| SMI | Santana Minerals | 15% | 40% | 327% | 213% | 0.47 | $61,013,152.48 |
| SLR | Silver Lake Resource | 14% | 5% | 37% | 29% | 1.8125 | $1,615,139,110.44 |
| DCN | Dacian Gold | 14% | 0% | -15% | -49% | 0.205 | $211,590,027.29 |
| MML | Medusa Mining | 14% | 13% | -2% | -4% | 0.795 | $162,205,914.78 |
| BGL | Bellevue Gold | 14% | 16% | 2% | -2% | 0.9425 | $954,000,304.93 |
| OBM | Ora Banda Mining | 13% | 15% | -46% | -74% | 0.068 | $60,401,919.31 |
| CDR | Codrus Minerals | 13% | 0% | -19% | 0% | 0.13 | $5,200,000.00 |
| KCC | Kincora Copper | 13% | -13% | -29% | 0% | 0.135 | $9,158,139.88 |
| ALK | Alkane Resources | 12% | 7% | -3% | 25% | 0.9425 | $512,201,741.20 |
| NST | Northern Star | 12% | 6% | 1% | -10% | 9.69 | $10,993,929,718.56 |
| CEL | Challenger Exp | 12% | 12% | 23% | -11% | 0.325 | $303,630,664.98 |
| OGC | OceanaGold Corp. | 12% | 8% | -3% | 10% | 2.41 | $165,228,328.45 |
| EVN | Evolution Mining | 12% | 5% | 6% | -1% | 4.15 | $7,478,671,346.64 |
| XAM | Xanadu Mines | 12% | -6% | 0% | -40% | 0.029 | $36,644,334.75 |
| AGG | AngloGold Ashanti | 11% | 8% | 27% | 5% | 6.08 | $524,541,658.20 |
| AWV | Anova Metals | 11% | 11% | -17% | -9% | 0.02 | $25,795,695.60 |
| SBR | Sabre Resources | 11% | 11% | 25% | -29% | 0.005 | $10,174,068.25 |
| S2R | S2 Resources | 11% | -5% | 43% | 14% | 0.2 | $71,274,971.00 |
| ARL | Ardea Resources | 10% | 12% | 73% | 52% | 0.795 | $110,370,024.11 |
| DLC | Delecta Limited | 10% | -8% | 83% | 57% | 0.011 | $13,253,995.76 |
| GCY | Gascoyne Res | 10% | 4% | -16% | -46% | 0.28 | $96,301,561.72 |
| LRL | Labyrinth Resources | 10% | 22% | -4% | 15% | 0.045 | $36,681,403.71 |
| AVW | Avira Resources | 9% | 20% | 50% | 20% | 0.006 | $10,312,740.00 |
| CBY | Canterbury Resources | 9% | -16% | -19% | -36% | 0.074 | $9,116,691.22 |
| GML | Gateway Mining | 8% | 0% | -28% | -57% | 0.013 | $29,381,382.77 |
| RRL | Regis Resources | 8% | 0% | -18% | -35% | 2.02 | $1,498,230,951.53 |
| BRB | Breaker Res NL | 8% | 8% | 35% | 35% | 0.27 | $83,089,436.90 |
| WGX | Westgold Resources. | 8% | 12% | 24% | 8% | 2.165 | $893,541,948.60 |
| NCM | Newcrest Mining | 8% | 0% | -4% | 0% | 24.46 | $19,508,302,378.35 |
| GUL | Gullewa Limited | 7% | -8% | -19% | -10% | 0.072 | $13,706,863.20 |
| GOR | Gold Road Res | 7% | 3% | 21% | 26% | 1.485 | $1,278,780,978.20 |
| SBM | St Barbara Limited | 7% | 8% | -8% | -32% | 1.49 | $1,039,457,126.79 |
| CPM | Coopermetalslimited | 7% | 79% | 0% | 0% | 0.6 | $15,941,800.00 |
| DEG | De Grey Mining | 7% | -9% | 9% | 54% | 1.2425 | $1,695,662,172.63 |
| RMS | Ramelius Resources | 7% | 2% | 0% | 13% | 1.515 | $1,253,371,482.51 |
| HMX | Hammer Metals | 7% | 4% | -1% | -14% | 0.077 | $65,199,569.84 |
| NML | Navarre Minerals | 7% | 9% | 6% | -34% | 0.093 | $125,549,837.98 |
| GBR | Greatbould Resources | 7% | -3% | 105% | 298% | 0.16 | $55,371,550.40 |
| MGV | Musgrave Minerals | 6% | 2% | 7% | 6% | 0.33 | $174,581,208.43 |
| BDC | Bardoc Gold | 6% | 4% | 24% | 8% | 0.505 | $145,361,976.50 |
| AME | Alto Metals Limited | 6% | -13% | -3% | 12% | 0.086 | $45,411,226.03 |
| KZR | Kalamazoo Resources | 6% | -3% | -7% | -27% | 0.345 | $46,462,199.68 |
| PRU | Perseus Mining | 6% | 10% | 14% | 41% | 1.65 | $1,954,653,018.45 |
| SSR | SSR Mining Inc. | 6% | 11% | 15% | 23% | 25.32 | $492,455,400.29 |
| TLM | Talisman Mining | 6% | 12% | 9% | 100% | 0.19 | $32,854,411.98 |
| GSR | Greenstone Resources | 5% | 34% | 105% | 70% | 0.039 | $31,476,068.87 |
| EMR | Emerald Res NL | 5% | -2% | 34% | 41% | 1.115 | $591,537,547.70 |
| IDA | Indiana Resources | 5% | -7% | 3% | -9% | 0.062 | $26,966,711.52 |
| KAU | Kaiser Reef | 5% | 8% | 4% | -44% | 0.21 | $25,792,349.94 |
| AQI | Alicanto Min | 5% | -13% | -22% | -5% | 0.105 | $40,184,929.79 |
| DTR | Dateline Resources | 5% | 13% | -7% | 74% | 0.087 | $37,662,130.93 |
| CMM | Capricorn Metals | 5% | 10% | 74% | 123% | 3.72 | $1,363,700,189.11 |
| RGL | Riversgold | 5% | 16% | -37% | -50% | 0.022 | $8,888,928.31 |
| ICG | Inca Minerals | 5% | 0% | 10% | 59% | 0.11 | $50,527,223.04 |
| MKR | Manuka Resources. | 5% | 11% | 10% | -31% | 0.34 | $33,492,050.79 |
| BCN | Beacon Minerals | 5% | 5% | 5% | -2% | 0.0345 | $125,694,274.72 |
| CY5 | Cygnus Gold Limited | 4% | 4% | 34% | 10% | 0.1875 | $21,827,283.28 |
| GBZ | GBM Rsources | 4% | 0% | 9% | 0% | 0.125 | $66,408,419.22 |
| RED | Red 5 Limited | 4% | 14% | 56% | 53% | 0.3125 | $718,689,998.86 |
| OZM | Ozaurum Resources | 4% | 0% | -11% | -34% | 0.125 | $6,865,920.00 |
| ICL | Iceni Gold | 4% | -30% | -32% | 0% | 0.13 | $16,548,535.64 |
| FML | Focus Minerals | 4% | 6% | 10% | -20% | 0.275 | $51,169,598.20 |
| G88 | Golden Mile Res | 4% | 24% | -2% | 17% | 0.056 | $9,516,008.04 |
| MDI | Middle Island Res | 4% | -7% | 43% | -46% | 0.14 | $16,526,459.97 |
| STN | Saturn Metals | 4% | 12% | -12% | 9% | 0.43 | $53,367,654.48 |
| AZS | Azure Minerals | 4% | 10% | 96% | 19% | 0.44 | $124,294,288.40 |
| NSM | Northstaw | 3% | 3% | -5% | -40% | 0.3 | $12,038,100.00 |
| MZZ | Matador Mining | 3% | -10% | -27% | -13% | 0.31 | $65,947,330.28 |
| BNZ | Benzmining | 3% | 3% | -17% | -35% | 0.65 | $31,214,400.28 |
| BMO | Bastion Minerals | 3% | -11% | 3% | 0% | 0.17 | $12,907,974.20 |
| SVL | Silver Mines Limited | 2% | 0% | -2% | -18% | 0.21 | $264,825,589.32 |
| WRM | White Rock Min | 2% | -4% | -44% | -63% | 0.22 | $31,538,028.20 |
| PRS | Prospech Limited | 2% | -10% | -41% | -67% | 0.053 | $3,454,593.27 |
| WAF | West African Res | 2% | -7% | 17% | 48% | 1.2125 | $1,225,131,582.00 |
| PGD | Peregrine Gold | 2% | -22% | 38% | 0% | 0.58 | $23,633,239.36 |
| NVA | Nova Minerals | 2% | -15% | -17% | -43% | 0.915 | $162,182,056.50 |
| PNR | Pantoro Limited | 2% | -7% | 57% | 65% | 0.33 | $429,897,102.89 |
| WMC | Wiluna Mining Corp | 1% | -8% | 9% | -15% | 1.075 | $227,163,565.88 |
| MAU | Magnetic Resources | 1% | -1% | -9% | -2% | 1.44 | $323,053,659.36 |
| TIE | Tietto Minerals | 1% | 30% | 78% | 51% | 0.605 | $431,370,812.89 |
| RSG | Resolute Mining | 1% | -12% | -37% | -53% | 0.3075 | $331,179,456.00 |
| CAI | Calidus Resources | 0% | -2% | 42% | 63% | 0.7025 | $272,180,209.52 |
| CYL | Catalyst Metals | 0% | 0% | -1% | -4% | 1.9 | $187,065,873.70 |
| NPM | Newpeak Metals | 0% | 0% | -50% | -71% | 0.001 | $8,849,750.03 |
| GED | Golden Deeps | 0% | 0% | 0% | -8% | 0.011 | $8,534,365.84 |
| AQX | Alice Queen | 0% | -11% | -43% | -74% | 0.008 | $12,262,784.08 |
| SLZ | Sultan Resources | 0% | -24% | -11% | -21% | 0.155 | $12,909,080.30 |
| PNX | PNX Metals Limited | 0% | -12% | -29% | -29% | 0.0055 | $22,220,289.04 |
| TMX | Terrain Minerals | 0% | 14% | 0% | 0% | 0.008 | $5,886,088.07 |
| FAU | First Au | 0% | -17% | -17% | -47% | 0.01 | $7,839,109.49 |
| IVR | Investigator Res | 0% | -3% | -5% | -33% | 0.061 | $79,938,819.42 |
| MOH | Moho Resources | 0% | -16% | -13% | -29% | 0.054 | $7,026,949.48 |
| SIH | Sihayo Gold Limited | 0% | 0% | -16% | -38% | 0.008 | $29,483,691.30 |
| PAK | Pacific American Hld | 0% | -6% | 7% | -17% | 0.017 | $8,123,915.83 |
| CTO | Citigold Corp | 0% | 0% | -10% | -25% | 0.009 | $25,502,931.82 |
| MHC | Manhattan Corp | 0% | 19% | 45% | -16% | 0.016 | $24,420,459.09 |
| TRY | Troy Resources | 0% | 0% | -6% | -56% | 0.037 | $31,631,563.33 |
| KGM | Kalnorth Gold | 0% | 0% | 0% | 0% | 0.013 | $11,625,120.78 |
| CGN | Crater Gold Min | 0% | 0% | 0% | -32% | 0.017 | $21,063,473.65 |
| TSC | Twenty Seven Co. | 0% | 0% | 14% | -33% | 0.004 | $10,643,255.62 |
| MTH | Mithril Resources | 0% | -7% | -28% | -35% | 0.013 | $33,543,029.53 |
| DDD | 3D Resources Limited | 0% | 0% | -25% | -27% | 0.003 | $12,541,116.28 |
| WWI | West Wits Mining | 0% | 18% | -18% | -36% | 0.045 | $79,043,995.82 |
| MEG | Megado | 0% | -1% | -22% | -55% | 0.086 | $3,702,196.63 |
| HMG | Hamelingoldlimited | 0% | 13% | 0% | 0% | 0.175 | $19,250,000.00 |
| TBA | Tombola Gold | 0% | 0% | -36% | -54% | 0.03 | $22,497,454.85 |
| TCG | Turaco Gold Limited | 0% | 0% | -8% | 100% | 0.12 | $51,326,000.28 |
| AUC | Ausgold Limited | 0% | 4% | 27% | -11% | 0.047 | $75,880,303.43 |
| TAM | Tanami Gold NL | 0% | -3% | -23% | -29% | 0.06 | $68,155,628.67 |
| KLA | Kirkland Lake Gold | 0% | -5% | -5% | 4% | 52.69 | $52,690,000.00 |
| THR | Thor Mining PLC | 0% | 25% | 15% | -6% | 0.015 | $14,937,577.49 |
| POL | Polymetals Resources | 0% | -13% | -4% | 0% | 0.135 | $5,407,636.41 |
| OKU | Oklo Resources | 0% | -9% | -13% | -45% | 0.105 | $52,972,130.30 |
| NAG | Nagambie Resources | 0% | -15% | -29% | -17% | 0.05 | $24,996,617.30 |
| VAN | Vango Mining | 0% | -22% | -40% | -39% | 0.039 | $46,617,692.38 |
| MAT | Matsa Resources | 0% | 8% | 3% | -35% | 0.064 | $22,614,141.06 |
| NES | Nelson Resources. | 0% | -22% | -41% | -73% | 0.025 | $4,663,012.68 |
| PKO | Peako Limited | 0% | 0% | -37% | -27% | 0.019 | $5,860,627.92 |
| OAU | Ora Gold Limited | 0% | -6% | -14% | -25% | 0.017 | $17,684,020.24 |
| GNM | Great Northern | 0% | 0% | -45% | -50% | 0.006 | $10,254,305.86 |
| TRM | Truscott Mining Corp | 0% | -6% | 0% | 39% | 0.032 | $4,862,129.41 |
| KNB | Koonenberrygold | 0% | -7% | 0% | 0% | 0.14 | $11,117,434.20 |
| AWJ | Auric Mining | 0% | 0% | -23% | -39% | 0.11 | $5,606,935.70 |
| ENR | Encounter Resources | 0% | -3% | 0% | 23% | 0.145 | $45,938,439.77 |
| AYM | Australia United Min | 0% | -25% | -14% | -45% | 0.006 | $11,055,464.91 |
| SFR | Sandfire Resources | 0% | 5% | 19% | 50% | 7.4 | $2,992,867,818.90 |
| AMI | Aurelia Metals | -1% | 4% | 41% | 18% | 0.4525 | $544,304,841.08 |
| SKY | SKY Metals | -1% | -24% | 2% | -45% | 0.091 | $34,664,079.24 |
| RXL | Rox Resources | -1% | 25% | 9% | -20% | 0.43 | $68,344,607.21 |
| PF1 | Pathfinder Resources | -1% | 13% | 33% | 33% | 0.405 | $22,045,219.15 |
| TSO | Tesoro Resources | -1% | -21% | -31% | -68% | 0.072 | $47,280,317.04 |
| CWX | Carawine Resources | -1% | -3% | -25% | -23% | 0.165 | $20,675,152.05 |
| DGO | DGO Gold Limited | -2% | -14% | -22% | -2% | 2.55 | $208,692,780.00 |
| BC8 | Black Cat Syndicate | -2% | -2% | 10% | -15% | 0.59 | $84,484,686.60 |
| SAU | Southern Gold | -2% | -2% | -9% | -39% | 0.059 | $12,799,725.36 |
| TBR | Tribune Res | -2% | -6% | -17% | -14% | 4.68 | $246,075,281.13 |
| KAI | Kairos Minerals | -2% | -23% | -9% | -23% | 0.0255 | $49,052,337.28 |
| TTM | Titan Minerals | -2% | 18% | 2% | -10% | 0.1175 | $162,117,861.30 |
| E2M | E2 Metals | -2% | -22% | -21% | -39% | 0.23 | $35,360,735.06 |
| MEU | Marmota Limited | -2% | -2% | 2% | -2% | 0.045 | $44,103,659.22 |
| MKG | Mako Gold | -2% | -16% | -2% | -10% | 0.088 | $32,872,777.77 |
| AAU | Antilles Gold | -2% | 12% | 10% | 3% | 0.087 | $26,752,436.57 |
| HRN | Horizon Gold | -2% | -2% | 19% | -5% | 0.43 | $45,877,566.88 |
| EM2 | Eagle Mountain | -2% | -5% | -15% | 77% | 0.62 | $143,501,615.00 |
| KWR | Kingwest Resources | -3% | -7% | 200% | 15% | 0.195 | $46,164,874.75 |
| LCY | Legacy Iron Ore | -3% | -20% | 28% | -31% | 0.0185 | $115,322,871.58 |
| GSN | Great Southern | -3% | -14% | -2% | -32% | 0.054 | $28,215,455.56 |
| KSN | Kingston Resources | -3% | 13% | -8% | -26% | 0.175 | $74,298,499.02 |
| DEX | Duke Exploration | -3% | 6% | -36% | -43% | 0.17 | $15,335,895.84 |
| KAL | Kalgoorliegoldmining | -3% | 10% | 0% | 0% | 0.16 | $11,227,363.00 |
| ASO | Aston Minerals | -3% | 48% | 29% | 308% | 0.155 | $152,671,588.64 |
| GSM | Golden State Mining | -3% | -12% | -35% | -37% | 0.088 | $7,394,830.67 |
| TNR | Torian Resources | -3% | -6% | 16% | -33% | 0.029 | $37,519,322.96 |
| CLA | Celsius Resource | -3% | 12% | 8% | -38% | 0.028 | $28,457,408.19 |
| QML | Qmines Limited | -3% | -2% | -18% | 0% | 0.28 | $18,227,374.32 |
| CDT | Castle Minerals | -4% | 34% | 293% | 511% | 0.055 | $53,964,611.15 |
| ADT | Adriatic Metals | -4% | -13% | -19% | -1% | 2.27 | $489,787,791.48 |
| GRL | Godolphin Resources | -4% | -11% | -17% | -48% | 0.125 | $10,513,921.38 |
| HRZ | Horizon | -4% | 0% | 4% | 14% | 0.125 | $70,996,900.00 |
| AM7 | Arcadia Minerals | -4% | -16% | 30% | 0% | 0.24 | $8,748,125.00 |
| AL8 | Alderan Resource | -4% | -14% | -51% | -76% | 0.024 | $9,788,019.84 |
| SNG | Siren Gold | -4% | -13% | -4% | -47% | 0.24 | $21,532,180.37 |
| ARV | Artemis Resources | -4% | -7% | 13% | -21% | 0.071 | $95,794,837.90 |
| AAR | Anglo Australian | -4% | -4% | 47% | 5% | 0.115 | $68,560,612.49 |
| CAZ | Cazaly Resources | -4% | -7% | -14% | 2% | 0.043 | $16,260,783.75 |
| DRE | Drednought Resources | -5% | 1% | 2% | 133% | 0.042 | $116,386,025.59 |
| GMR | Golden Rim Resources | -5% | -19% | -13% | -30% | 0.105 | $24,350,503.12 |
| CXU | Cauldron Energy | -5% | -19% | -34% | -46% | 0.021 | $10,808,459.86 |
| PNM | Pacific Nickel Mines | -5% | -5% | 94% | 84% | 0.105 | $28,466,464.85 |
| MRZ | Mont Royal Resources | -5% | -23% | 27% | 15% | 0.305 | $19,634,144.81 |
| LEX | Lefroy Exploration | -5% | -2% | -23% | 46% | 0.3 | $43,762,400.40 |
| M2R | Miramar | -5% | 11% | 8% | -19% | 0.195 | $8,966,703.60 |
| AGC | AGC | -5% | -5% | -34% | -40% | 0.093 | $6,434,091.98 |
| CST | Castile Resources | -5% | 3% | -21% | 12% | 0.185 | $37,944,922.99 |
| ADN | Andromeda Metals | -5% | -16% | 9% | -39% | 0.18 | $434,652,233.05 |
| EMU | EMU NL | -5% | 0% | -33% | -65% | 0.018 | $9,896,660.71 |
| SVY | Stavely Minerals | -5% | -11% | 10% | -36% | 0.445 | $122,651,882.44 |
| KRM | Kingsrose Mining | -5% | -18% | 45% | 45% | 0.071 | $53,216,382.85 |
| HAW | Hawthorn Resources | -5% | -18% | 91% | 23% | 0.086 | $30,683,436.40 |
| GWR | GWR Group | -6% | -13% | -42% | -44% | 0.165 | $50,453,488.32 |
| TRN | Torrens Mining | -6% | 10% | -15% | -8% | 0.165 | $11,494,714.77 |
| MXR | Maximus Resources | -6% | -11% | -18% | -53% | 0.066 | $20,981,780.69 |
| MEI | Meteoric Resources | -6% | -11% | -59% | -75% | 0.016 | $24,420,757.94 |
| MCT | Metalicity Limited | -6% | -11% | -20% | -43% | 0.008 | $17,765,071.99 |
| HCH | Hot Chili | -6% | -25% | -25% | -27% | 1.43 | $155,713,858.74 |
| LCL | Los Cerros Limited | -6% | -6% | -22% | -13% | 0.1175 | $76,621,962.60 |
| SPQ | Superior Resources | -6% | -15% | 229% | 254% | 0.046 | $73,152,477.97 |
| ANX | Anax Metals | -6% | 0% | 11% | 42% | 0.091 | $36,438,962.56 |
| SRN | Surefire Rescs NL | -6% | 36% | 0% | -40% | 0.015 | $16,564,656.14 |
| A1G | African Gold . | -6% | 7% | 35% | 25% | 0.225 | $27,464,375.44 |
| RND | Rand Mining | -7% | -2% | -6% | -18% | 1.43 | $81,332,624.23 |
| AGS | Alliance Resources | -7% | -5% | -14% | -31% | 0.135 | $28,082,313.09 |
| ARN | Aldoro Resources | -7% | -1% | -35% | 41% | 0.395 | $35,367,742.66 |
| IPT | Impact Minerals | -7% | 0% | 0% | -38% | 0.013 | $28,333,128.87 |
| ALY | Alchemy Resource | -7% | 8% | -5% | -30% | 0.013 | $11,904,311.13 |
| MBK | Metal Bank | -7% | 8% | -15% | -51% | 0.0065 | $15,646,908.96 |
| MTC | Metalstech | -7% | -22% | 57% | 94% | 0.255 | $43,332,793.40 |
| M24 | Mamba Exploration | -7% | -14% | 3% | -22% | 0.19 | $8,013,250.57 |
| ERM | Emmerson Resources | -7% | -19% | 71% | 79% | 0.125 | $62,414,811.13 |
| LYN | Lycaonresources | -8% | -8% | 0% | 0% | 0.37 | $10,260,000.00 |
| PUA | Peak Minerals | -8% | -14% | -29% | -52% | 0.012 | $13,537,819.76 |
| LNY | Laneway Res | -8% | 0% | 50% | 0% | 0.006 | $28,359,065.60 |
| RDS | Redstone Resources | -8% | -25% | 9% | 0% | 0.012 | $8,627,988.76 |
| ZNC | Zenith Minerals | -8% | -9% | 69% | 209% | 0.355 | $120,366,454.25 |
| FFX | Firefinch | -8% | -8% | 19% | 143% | 0.6675 | $789,351,254.00 |
| A8G | Australasian Metals | -8% | -19% | 271% | 0% | 0.52 | $20,888,656.88 |
| REZ | Resourc & En Grp | -8% | -27% | 59% | 5% | 0.046 | $22,991,066.29 |
| PUR | Pursuit Minerals | -8% | -15% | -62% | -38% | 0.023 | $21,747,631.46 |
| HAV | Havilah Resources | -8% | -13% | -15% | -23% | 0.17 | $55,765,216.26 |
| CHN | Chalice Mining | -8% | -12% | 21% | 76% | 7.38 | $2,588,121,125.46 |
| GIB | Gibb River Diamonds | -9% | -21% | 19% | -21% | 0.063 | $14,382,642.26 |
| GTR | Gti Resources | -9% | -16% | 33% | 3% | 0.021 | $23,704,405.79 |
| AAJ | Aruma Resources | -9% | 25% | 24% | 42% | 0.105 | $13,225,957.82 |
| MVL | Marvel Gold Limited | -9% | -19% | -12% | -4% | 0.052 | $31,694,371.63 |
| BGD | Bartongoldholdings | -9% | 21% | 41% | 0% | 0.26 | $22,318,398.96 |
| HXG | Hexagon Energy | -9% | -32% | -28% | -42% | 0.052 | $24,553,057.82 |
| FG1 | Flynngold | -9% | -11% | 3% | 0% | 0.155 | $10,249,768.00 |
| XTC | Xantippe Res | -9% | -9% | 400% | 400% | 0.01 | $52,744,263.32 |
| SI6 | SI6 Metals Limited | -9% | -9% | -17% | -60% | 0.01 | $14,281,439.85 |
| BAT | Battery Minerals | -9% | -17% | -23% | -68% | 0.01 | $23,474,645.71 |
| STK | Strickland Metals | -9% | -14% | 59% | 165% | 0.059 | $72,950,851.50 |
| SFM | Santa Fe Minerals | -9% | -5% | 138% | 70% | 0.195 | $14,199,663.86 |
| TMZ | Thomson Res | -10% | 2% | -40% | -56% | 0.066 | $37,744,082.31 |
| AZL | Arizona Lithium | -10% | 8% | 268% | 250% | 0.14 | $269,698,471.43 |
| AXE | Archer Materials | -10% | -17% | -51% | 21% | 1.025 | $252,518,551.14 |
| RMX | Red Mount Min | -10% | -25% | 0% | -31% | 0.009 | $16,423,638.58 |
| BYH | Bryah Resources | -10% | -10% | 0% | -11% | 0.054 | $12,441,394.63 |
| RDN | Raiden Resources | -10% | -18% | -22% | -25% | 0.018 | $24,755,891.47 |
| PDI | Predictive Disc | -10% | -15% | 55% | 281% | 0.225 | $315,792,208.00 |
| MM8 | Medallion Metals. | -10% | -12% | 16% | 0% | 0.22 | $23,328,724.32 |
| OKR | Okapi Resources | -11% | -19% | -24% | 47% | 0.28 | $33,955,860.17 |
| RDT | Red Dirt Metals | -11% | -27% | 241% | 173% | 0.545 | $139,059,782.93 |
| NXM | Nexus Minerals | -11% | -21% | 180% | 293% | 0.35 | $101,386,435.85 |
| TG1 | Techgen Metals | -12% | -28% | -34% | 0% | 0.115 | $5,007,349.09 |
| VMC | Venus Metals Cor | -12% | 6% | 6% | -14% | 0.19 | $29,460,343.19 |
| KCN | Kingsgate Consolid. | -12% | -31% | 96% | 57% | 1.47 | $322,021,259.12 |
| NAE | New Age Exploration | -12% | -6% | 36% | 36% | 0.015 | $21,538,483.65 |
| NWM | Norwest Minerals | -12% | -22% | -27% | -36% | 0.052 | $9,933,401.45 |
| VKA | Viking Mines | -13% | -7% | -42% | -72% | 0.014 | $14,353,618.03 |
| AUT | Auteco Minerals | -13% | 12% | -10% | -13% | 0.084 | $141,807,030.62 |
| TAR | Taruga Minerals | -13% | -29% | -32% | -32% | 0.034 | $17,410,040.20 |
| VRC | Volt Resources | -13% | -20% | -29% | 5% | 0.02 | $56,201,820.26 |
| MRR | Minrex Resources | -13% | 14% | 267% | 159% | 0.066 | $45,525,646.21 |
| LM8 | Lunnonmetalslimited | -13% | 19% | 42% | 0% | 0.85 | $65,110,132.60 |
| PRX | Prodigy Gold NL | -13% | -21% | -37% | -37% | 0.026 | $16,313,572.97 |
| WCN | White Cliff Min | -14% | 7% | 150% | 58% | 0.03 | $18,567,338.37 |
| KTA | Krakatoa Resources | -14% | -13% | -21% | -36% | 0.042 | $13,851,366.10 |
| BMR | Ballymore Resources | -15% | -11% | 0% | 0% | 0.17 | $12,491,273.77 |
| BEZ | Besragoldinc | -16% | -8% | 0% | 0% | 0.092 | $15,466,496.40 |
| DCX | Discovex Res | -17% | -9% | 100% | 25% | 0.01 | $23,117,976.68 |
| YRL | Yandal Resources | -17% | -19% | -41% | -26% | 0.3 | $32,505,634.84 |
| ZAG | Zuleika Gold | -17% | 75% | 9% | -20% | 0.035 | $14,475,768.06 |
| SMS | Starmineralslimited | -17% | -19% | 0% | 0% | 0.17 | $4,462,500.00 |
| BTR | Brightstar Resources | -18% | -52% | 5% | -43% | 0.0295 | $16,405,826.07 |
| MLSDA | Metals Australia | -23% | 15% | 15% | 15% | 0.046 | $11,000,970.46 |
| BBX | BBX Minerals | -24% | -21% | -46% | -56% | 0.13 | $66,703,113.88 |
| ADV | Ardiden | -24% | -24% | 18% | -28% | 0.013 | $28,188,359.63 |
| GMN | Gold Mountain | -32% | -28% | -56% | -70% | 0.0115 | $12,841,790.04 |
The large gold miners have all had a good week; and rightly so.
Two weeks ago Newcrest’s (ASX:NCM) shares were at December 2019 levels, when gold was selling for $US1,510/oz.
Northern Star (ASX:NST) was at May 2019 levels, when gold was worth a paltry $US1,280/oz. MADNESS.
Still, Aussies gold shares are yet to move with any great urgency. Is this a buying opportunity?
Such a meek response by market to #Gold price
WAKE UP AUSTRALIA!!!
— Ton Ton (@TonTon98796526) February 18, 2022
Mining
Mining
Mining


Get the latest Stockhead news delivered free to your inbox.