Is it time to go against the flow? Pic: Getty
Gold Digger: Is gold the ‘ultimate contrarian investment’ right now?
Mining
Is it time to go against the flow? Pic: Getty
Mining
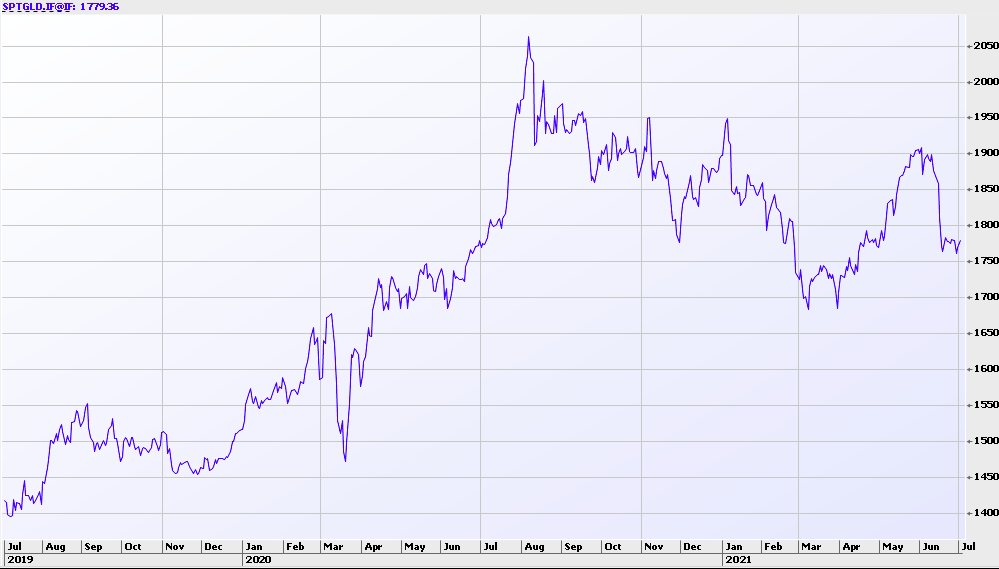
Gold had its worst month since November 2016 in June, down 7% to $US1,779/oz.
Mining and exploration stocks have followed suit. This bearish trend creates a buying opportunity, experts say.
Boutique investment advisory firm head Frank Holmes says gold is the “ultimate contrarian investment” right now.
Contrarian investors purposefully go against prevailing market trends by selling when others are buying, and buying when other are selling.
The theory is that markets are subject to “herding behaviour” amplified by fear and greed, making markets regularly over-and under-priced.
Right now, gold is under-priced, Holmes says.
“Bloomberg reports that the S&P 500-to-gold ratio is nearing its highest level in over 15 years,” he says.
“As of this week, it takes close to two and a half ounces of gold to buy one ‘share’ of the S&P 500. That’s up significantly from September 2011 when two-thirds of an ounce of gold was enough to get you entry.
All of this points to the fact that gold is extremely undervalued right now, and no one seems to be paying much attention, he says.
“What I do know is that all of the traditional drivers of the gold price are firmly in place [record money printing and high inflation — making the yellow metal very attractive.”
Here’s how ASX-listed gold & silver stocks are performing:
Scroll or swipe to reveal table. Click headings to sort. Best viewed on a laptop
| CODE | COMPANY | 1 WEEK RETURN % | 1 MONTH RETURN % | 6 MONTH RETURN % | 1 YEAR RETURN % | PRICE | MARKET CAP |
|---|---|---|---|---|---|---|---|
| EMU | EMU NL | 29 | -23 | -26 | 107 | 0.031 | $ 13,695,434.52 |
| LNY | Laneway Res | 25 | 0 | -29 | -17 | 0.005 | $ 18,875,329.67 |
| MHC | Manhattan Corp | 25 | 7 | -40 | -17 | 0.015 | $ 21,367,901.70 |
| AWJ | Auric Mining | 25 | -9 | 0.15 | $ 6,588,379.35 | ||
| ARN | Aldoro Resources | 25 | 15 | 130 | 394 | 0.38 | $ 30,193,576.13 |
| NAG | Nagambie Resources | 23 | 21 | 115 | 65 | 0.086 | $ 43,494,114.10 |
| CEL | Challenger Exp | 22 | -2 | 34 | 22 | 0.275 | $ 212,404,431.90 |
| TBA | Tombola Gold | 20 | 7 | 0 | 55 | 0.048 | $ 24,943,310.06 |
| AMI | Aurelia Metals | 20 | 3 | 2 | -13 | 0.4375 | $ 543,285,545.00 |
| GTR | Gti Resources | 18 | 18 | 13 | -24 | 0.026 | $ 16,112,949.95 |
| PNM | Pacific Nickel Mines | 18 | 18 | 23 | 195 | 0.059 | $ 12,678,807.12 |
| PGD | Peregrine Gold | 18 | 11 | 0.4 | $ 11,039,809.40 | ||
| DLC | Delecta Limited | 17 | 0 | 17 | 0 | 0.007 | $ 6,556,037.83 |
| SI6 | SI6 Metals Limited | 17 | 8 | -50 | 133 | 0.014 | $ 19,505,643.70 |
| MVL | Marvel Gold Limited | 16 | 8 | 12 | 135 | 0.057 | $ 27,975,423.19 |
| GSN | Great Southern | 16 | -4 | -38 | -66 | 0.05 | $ 20,475,918.90 |
| KTA | Krakatoa Resources | 15 | 6 | -17 | 20 | 0.054 | $ 15,063,300.00 |
| CDT | Castle Minerals | 14 | -6 | 78 | 45 | 0.016 | $ 12,452,513.91 |
| VMC | Venus Metals Cor | 14 | -4 | 0 | -37 | 0.2 | $ 30,215,736.60 |
| AYM | Australia United Min | 14 | 14 | 0 | 100 | 0.008 | $ 14,740,619.88 |
| OKU | Oklo Resources | 14 | 2 | -39 | -58 | 0.125 | $ 63,003,726.50 |
| AAU | Antilles Gold | 14 | 23 | 42 | 61 | 0.084 | $ 20,695,864.22 |
| EM2 | Eagle Mountain | 13 | -8 | 103 | 517 | 0.925 | $ 197,602,889.25 |
| MDI | Middle Island Res | 13 | 18 | -68 | -74 | 0.13 | $ 15,302,277.75 |
| ARV | Artemis Resources | 13 | 2 | -47 | -5 | 0.061 | $ 74,044,861.41 |
| PUR | Pursuit Minerals | 13 | -8 | 238 | 1424 | 0.071 | $ 64,540,974.12 |
| RVR | Red River Resources | 13 | 7 | -20 | 174 | 0.225 | $ 119,088,104.41 |
| TSC | Twenty Seven Co. | 13 | 13 | -25 | -10 | 0.0045 | $ 10,642,758.24 |
| MBK | Metal Bank | 13 | -10 | -25 | 4 | 0.009 | $ 10,701,614.74 |
| SBR | Sabre Resources | 13 | -25 | -50 | 80 | 0.0045 | $ 7,573,786.42 |
| TAR | Taruga Minerals | 12 | -41 | 6 | 38 | 0.055 | $ 27,801,207.83 |
| HWK | Hawkstone Mng | 12 | -3 | 211 | 115 | 0.028 | $ 44,712,934.23 |
| MEU | Marmota Limited | 12 | 4 | 2 | -27 | 0.047 | $ 43,584,016.05 |
| AAR | Anglo Australian | 12 | -7 | -32 | -45 | 0.085 | $ 50,654,721.02 |
| TRM | Truscott Mining Corp | 12 | 15 | 111 | 124 | 0.038 | $ 5,340,720.22 |
| PKO | Peako Limited | 12 | 9 | 65 | 307 | 0.038 | $ 9,161,541.44 |
| AGC | AGC | 12 | -12 | 0.145 | $ 9,820,456.18 | ||
| NUS | Nusantara Resources | 11 | 3 | 19 | 1 | 0.34 | $ 77,952,822.38 |
| AGS | Alliance Resources | 11 | 0 | -14 | -11 | 0.15 | $ 31,202,570.10 |
| PUA | Peak Minerals | 11 | -5 | -31 | -9 | 0.02 | $ 12,294,053.04 |
| TSO | Tesoro Resources | 11 | -12 | -48 | 92 | 0.15 | $ 77,426,222.33 |
| NES | Nelson Resources. | 11 | -7 | -38 | 29 | 0.062 | $ 8,582,918.33 |
| ASO | Aston Minerals | 10 | -27 | 300 | 290 | 0.16 | $ 162,213,562.93 |
| STK | Strickland Metals | 10 | 39 | 25 | 93 | 0.043 | $ 32,351,111.50 |
| CLA | Celsius Resource | 9 | -19 | -24 | 150 | 0.035 | $ 36,652,982.84 |
| RXLDB | Rox Resources | 9 | 6 | -38 | -63 | 0.475 | $ 69,347,349.28 |
| GBZ | GBM Rsources | 9 | -4 | -11 | 56 | 0.125 | $ 54,155,772.75 |
| LCL | Los Cerros Limited | 9 | 9 | 52 | 342 | 0.19 | $ 89,958,975.79 |
| HRZ | Horizon | 8 | 0 | 18 | 4 | 0.13 | $ 73,836,776.00 |
| WCN | White Cliff Min | 8 | -24 | -48 | 0 | 0.013 | $ 6,723,553.19 |
| AQX | Alice Queen | 8 | -7 | -54 | -59 | 0.013 | $ 14,839,039.74 |
| PRU | Perseus Mining | 8 | 6 | 16 | 15 | 1.5125 | $ 1,858,082,158.05 |
| TRY | Troy Resources | 8 | -9 | -59 | -52 | 0.041 | $ 35,050,268.97 |
| KAU | Kaiser Reef | 8 | -7 | -33 | -7 | 0.275 | $ 25,654,213.81 |
| GED | Golden Deeps | 8 | 17 | 40 | 56 | 0.014 | $ 10,847,920.16 |
| FAU | First Au | 8 | -22 | -26 | -13 | 0.014 | $ 7,375,545.05 |
| NSM | Northstaw | 7 | -6 | -37 | 0.3 | $ 12,000,000.00 | |
| LCY | Legacy Iron Ore | 7 | -9 | -67 | 650 | 0.015 | $ 96,071,077.76 |
| CWX | Carawine Resources | 7 | -6 | 7 | 26 | 0.24 | $ 27,766,925.01 |
| AAJ | Aruma Resources | 7 | 0 | -28 | -13 | 0.065 | $ 6,993,421.18 |
| BRV | Big River Gold | 6 | 12 | 9 | 69 | 0.42 | $ 92,118,895.26 |
| ADV | Ardiden | 6 | -15 | -53 | 42 | 0.0085 | $ 17,194,833.73 |
| MOH | Moho Resources | 6 | -11 | -22 | -36 | 0.07 | $ 7,229,278.14 |
| CAZ | Cazaly Resources | 6 | -16 | 15 | 51 | 0.053 | $ 18,478,163.35 |
| BNZ | Benzmining | 6 | -17 | -30 | 0.8 | $ 30,343,512.80 | |
| CGN | Crater Gold Min | 6 | 0 | 6 | 100 | 0.018 | $ 22,094,925.61 |
| TBR | Tribune Res | 6 | 1 | -16 | -27 | 5.06 | $ 253,420,811.91 |
| MZZ | Matador Mining | 6 | -6 | 26 | 45 | 0.465 | $ 96,497,696.46 |
| MAT | Matsa Resources | 6 | -9 | -25 | -52 | 0.075 | $ 23,065,280.39 |
| M2R | Miramar | 6 | -3 | -32 | 0.19 | $ 8,970,853.80 | |
| CAI | Calidus Resources | 5 | 5 | -3 | -16 | 0.49 | $ 195,964,890.03 |
| GML | Gateway Mining | 5 | -13 | -33 | -5 | 0.02 | $ 36,169,076.40 |
| CYL | Catalyst Metals | 5 | 3 | -2 | -25 | 2.08 | $ 204,455,103.84 |
| ANX | Anax Metals | 5 | -11 | 93 | 283 | 0.085 | $ 29,765,630.65 |
| TIE | Tietto Minerals | 5 | -10 | -13 | -39 | 0.325 | $ 150,541,200.48 |
| SBM | St Barbara Limited | 5 | -3 | -22 | -44 | 1.845 | $ 1,274,442,820.20 |
| AUC | Ausgold Limited | 5 | -13 | -4 | 0 | 0.045 | $ 71,340,729.35 |
| PDI | Predictive Disc | 4 | -4 | 52 | 8 | 0.093 | $ 114,164,257.95 |
| ARL | Ardea Resources | 4 | 9 | 38 | 104 | 0.56 | $ 72,772,231.74 |
| SPQ | Superior Resources | 4 | 14 | 14 | 150 | 0.0125 | $ 16,576,029.49 |
| MRZ | Mont Royal Resources | 4 | -23 | -6 | 38 | 0.255 | $ 9,658,562.33 |
| RED | Red 5 Limited | 4 | 10 | -24 | -14 | 0.1925 | $ 457,533,033.17 |
| S2R | S2 Resources | 4 | -10 | 0 | 33 | 0.13 | $ 40,935,853.27 |
| AQI | Alicanto Min | 4 | 0 | 35 | 118 | 0.135 | $ 44,262,107.24 |
| OZM | Ozaurum Resources | 4 | -18 | 0.135 | $ 6,502,500.00 | ||
| FML | Focus Minerals | 4 | -7 | -19 | 17 | 0.275 | $ 46,600,884.08 |
| DCN | Dacian Gold | 4 | -5 | -32 | -39 | 0.28 | $ 245,868,904.44 |
| AUT | Auteco Minerals | 4 | -11 | -15 | -41 | 0.085 | $ 138,375,851.69 |
| SVY | Stavely Minerals | 4 | -23 | -45 | -30 | 0.435 | $ 112,213,424.36 |
| CHN | Chalice Mining | 4 | -18 | 89 | 654 | 7.39 | $ 2,421,064,603.14 |
| RRL | Regis Resources | 3 | -5 | -30 | -52 | 2.535 | $ 1,923,058,563.15 |
| WGX | Westgold Resources. | 3 | -13 | -26 | -11 | 1.9625 | $ 837,114,158.25 |
| BTR | Brightstar Resources | 3 | -18 | -45 | 725 | 0.033 | $ 13,632,273.68 |
| OBM | Ora Banda Mining | 3 | -21 | -46 | -35 | 0.165 | $ 159,356,539.49 |
| TAM | Tanami Gold NL | 3 | -8 | -20 | 14 | 0.067 | $ 82,256,793.22 |
| PF1 | Pathfinder Resources | 3 | 1 | 45 | 0.34 | $ 16,906,224.60 | |
| ERM | Emmerson Resources | 3 | -16 | -14 | -35 | 0.068 | $ 33,880,217.25 |
| WRM | White Rock Min | 3 | -7 | -13 | -45 | 0.52 | $ 46,554,532.96 |
| XAM | Xanadu Mines | 3 | -15 | 3 | -13 | 0.039 | $ 52,735,945.50 |
| CXU | Cauldron Energy | 3 | 0 | -5 | 144 | 0.039 | $ 17,783,980.97 |
| MRR | Minrex Resources | 3 | -18 | 3 | 58 | 0.0205 | $ 11,298,309.63 |
| GUL | Gullewa Limited | 3 | -6 | -37 | -9 | 0.082 | $ 14,954,594.20 |
| AGG | AngloGold Ashanti | 2 | -22 | -16 | -40 | 5.1 | $ 447,822,980.30 |
| HRN | Horizon Gold | 2 | -5 | -6 | 11 | 0.44 | $ 46,944,487.04 |
| SFM | Santa Fe Minerals | 2 | -10 | -4 | 45 | 0.09 | $ 6,553,691.01 |
| HMX | Hammer Metals | 2 | -8 | 188 | 104 | 0.092 | $ 72,598,726.71 |
| CST | Castile Resources | 2 | -8 | -14 | 41 | 0.24 | $ 45,933,327.83 |
| WAF | West African Res | 2 | -8 | -3 | 11 | 1.01 | $ 900,830,841.84 |
| AZS | Azure Minerals | 2 | -7 | -51 | 168 | 0.255 | $ 75,481,001.65 |
| MAU | Magnetic Resources | 2 | 6 | 35 | 24 | 1.585 | $ 331,623,704.80 |
| SVL | Silver Mines Limited | 2 | -18 | 15 | 141 | 0.265 | $ 311,140,025.56 |
| KRM | Kingsrose Mining | 2 | -7 | 54 | 29 | 0.054 | $ 38,690,389.66 |
| MEI | Meteoric Resources | 2 | -2 | -25 | 47 | 0.056 | $ 70,998,743.11 |
| BDC | Bardoc Gold | 2 | -12 | -18 | -25 | 0.067 | $ 116,262,244.19 |
| BNR | Bulletin Res | 1 | -1 | -14 | -15 | 0.068 | $ 12,191,929.03 |
| BCN | Beacon Minerals | 1 | -1 | 0 | -4 | 0.0345 | $ 125,423,415.08 |
| RND | Rand Mining | 1 | -1 | -18 | -29 | 1.48 | $ 84,176,422.28 |
| KZR | Kalamazoo Resources | 1 | -12 | -34 | -52 | 0.39 | $ 50,797,452.09 |
| GBR | Greatbould Resources | 1 | -14 | 83 | 234 | 0.086 | $ 31,061,004.57 |
| MKG | Mako Gold | 1 | -8 | -18 | -25 | 0.086 | $ 22,122,777.77 |
| AME | Alto Metals Limited | 1 | -6 | -2 | 25 | 0.091 | $ 40,973,635.98 |
| NST | Northern Star | 1 | -13 | -21 | -30 | 10.04 | $ 11,799,781,302.66 |
| SSR | SSR Mining Inc. | 1 | -12 | -21 | 20.73 | $ 394,724,001.00 | |
| WMX | Wiluna Mining Corp | 1 | -10 | -32 | -33 | 0.95 | $ 147,198,988.26 |
| VRC | Volt Resources | 0 | 9 | 250 | 75 | 0.035 | $ 85,389,555.48 |
| ICG | Inca Minerals | 0 | -23 | 122 | 525 | 0.12 | $ 47,837,317.28 |
| MSR | Manas Res | 0 | 10 | 83 | 83 | 0.011 | $ 36,471,859.58 |
| DRE | Drednought Resources | 0 | 8 | 27 | 271 | 0.026 | $ 66,643,877.55 |
| ALK | Alkane Resources | 0 | 20 | 20 | -8 | 1.145 | $ 666,835,456.00 |
| TMZ | Thomson Res | 0 | -10 | 18 | 465 | 0.13 | $ 57,909,688.75 |
| EMR | Emerald Res NL | 0 | -19 | 6 | 61 | 0.9 | $ 474,165,430.44 |
| MLS | Metals Australia | 0 | 0 | 0 | 0 | 0.002 | $ 8,454,376.09 |
| KGM | Kalnorth Gold | 0 | 0 | 0 | 86 | 0.013 | $ 11,625,120.78 |
| THR | Thor Mining PLC | 0 | 0 | 0 | 183 | 0.017 | $ 9,269,053.86 |
| TNR | Torian Resources | 0 | -10 | 0 | 54 | 0.028 | $ 24,342,840.26 |
| ANL | Amani Gold | 0 | -33 | 0 | -33 | 0.001 | $ 12,386,996.75 |
| PNR | Pantoro Limited | 0 | -9 | -2 | -23 | 0.215 | $ 302,805,619.02 |
| KAI | Kairos Minerals | 0 | -9 | -6 | -42 | 0.032 | $ 53,647,026.37 |
| CTO | Citigold Corp | 0 | 0 | -8 | 120 | 0.011 | $ 30,580,000.00 |
| TTM | Titan Minerals | 0 | -12 | -8 | 38 | 0.11 | $ 131,037,029.91 |
| BAT | Battery Minerals | 0 | -19 | -15 | 70 | 0.017 | $ 35,748,068.06 |
| KSN | Kingston Resources | 0 | -4 | -15 | 16 | 0.22 | $ 62,422,128.12 |
| RMX | Red Mount Min | 0 | 11 | -17 | 67 | 0.01 | $ 12,568,224.89 |
| GMR | Golden Rim Resources | 0 | -20 | -20 | -38 | 0.008 | $ 21,362,797.43 |
| XTC | Xantippe Res | 0 | 0 | -20 | 0 | 0.002 | $ 8,149,128.80 |
| NVA | Nova Minerals | 0 | -11 | -22 | 116 | 0.125 | $ 210,118,330.88 |
| GSM | Golden State Mining | 0 | -9 | -23 | -78 | 0.15 | $ 11,998,511.91 |
| DCX | Discovex Res | 0 | 0 | -25 | -33 | 0.006 | $ 15,411,984.46 |
| BAR | Barra Resources | 0 | -10 | -27 | 19 | 0.019 | $ 12,874,553.92 |
| GMN | Gold Mountain | 0 | -20 | -27 | -54 | 0.032 | $ 24,567,197.57 |
| IPT | Impact Minerals | 0 | -13 | -28 | 0 | 0.014 | $ 28,333,128.87 |
| VKA | Viking Mines | 0 | -33 | -29 | 230 | 0.02 | $ 19,403,910.19 |
| GRL | Godolphin Resources | 0 | -9 | -36 | -23 | 0.15 | $ 12,616,563.30 |
| AVW | Avira Resources | 0 | -17 | -38 | 67 | 0.005 | $ 6,875,200.00 |
| SIH | Sihayo Gold Limited | 0 | -8 | -39 | -58 | 0.011 | $ 40,540,075.54 |
| RML | Resolution Minerals | 0 | -4 | -42 | -74 | 0.022 | $ 9,848,951.51 |
| NPM | Newpeak Metals | 0 | 0 | -43 | 0 | 0.002 | $ 11,408,322.60 |
| SAU | Southern Gold | 0 | -5 | -44 | -50 | 0.07 | $ 14,933,012.92 |
| MCT | Metalicity Limited | 0 | -23 | -44 | -72 | 0.01 | $ 21,247,770.33 |
| A8G | Australasian Gold | 0 | -15 | 0.145 | $ 4,801,666.45 | ||
| RMS | Ramelius Resources | 0 | -11 | 3 | -13 | 1.735 | $ 1,436,740,474.49 |
| BGL | Bellevue Gold | -1 | 9 | -16 | -8 | 0.945 | $ 820,141,962.23 |
| SLR | Silver Lake Resource | -1 | -12 | -5 | -23 | 1.705 | $ 1,533,941,048.10 |
| MML | Medusa Mining | -1 | -3 | 10 | 15 | 0.845 | $ 176,692,305.85 |
| MGV | Musgrave Minerals | -1 | -16 | -1 | -27 | 0.3675 | $ 191,960,261.64 |
| NCM | Newcrest Mining | -1 | -10 | -1 | -22 | 25.46 | $ 21,086,074,053.60 |
| NML | Navarre Minerals | -1 | -14 | -53 | -21 | 0.095 | $ 66,736,526.50 |
| GWR | GWR Group | -2 | 27 | -26 | 400 | 0.325 | $ 99,919,526.19 |
| BC8 | Black Cat Syndicate | -2 | -14 | -11 | -32 | 0.62 | $ 88,708,920.93 |
| G88 | Golden Mile Res | -2 | -10 | -2 | -8 | 0.055 | $ 7,701,008.04 |
| CMM | Capricorn Metals | -2 | -1 | 6 | 4 | 1.895 | $ 661,536,815.31 |
| SNG | Siren Gold | -2 | -19 | -61 | 0.27 | $ 16,211,171.00 | |
| RSG | Resolute Mining | -2 | -13 | -34 | -57 | 0.525 | $ 596,102,061.24 |
| MM8 | Medallion Metals | -2 | -9 | 0.255 | $ 21,052,222.36 | ||
| EVN | Evolution Mining | -2 | -14 | -9 | -24 | 4.56 | $ 7,859,868,591.00 |
| PRX | Prodigy Gold NL | -2 | -26 | -9 | -16 | 0.042 | $ 24,386,359.45 |
| M24 | Mamba Exploration | -2 | -16 | 0.21 | $ 7,770,000.00 | ||
| SLZ | Sultan Resources | -2 | -31 | -7 | 41 | 0.205 | $ 14,602,221.69 |
| OKR | Okapi Resources | -2 | -13 | 3 | 25 | 0.2 | $ 10,669,726.20 |
| IDA | Indiana Resources | -3 | 3 | 22 | 160 | 0.073 | $ 23,264,832.53 |
| BMO | Bastion Minerals | -3 | -10 | 0.18 | $ 10,341,766.80 | ||
| VAN | Vango Mining | -3 | -1 | 8 | -38 | 0.068 | $ 74,533,238.11 |
| BRB | Breaker Res NL | -3 | -11 | -18 | -45 | 0.165 | $ 52,134,548.64 |
| LEX | Lefroy Exploration | -3 | -24 | 317 | 380 | 0.96 | $ 115,415,680.32 |
| TIN | Tnt Mines Limited | -3 | 7 | -45 | 7 | 0.16 | $ 16,391,944.00 |
| STN | Saturn Metals | -3 | -13 | -35 | -44 | 0.425 | $ 47,797,416.75 |
| PRS | Prospech Limited | -3 | -20 | -30 | 0 | 0.14 | $ 9,102,882.46 |
| RDN | Raiden Resources | -4 | 13 | -10 | 286 | 0.027 | $ 31,216,037.40 |
| NMR | Native Mineral Res | -4 | -12 | -39 | 0.26 | $ 7,491,510.00 | |
| TRN | Torrens Mining | -4 | 79 | 0.26 | $ 17,735,883.88 | ||
| ONX | Orminex | -4 | -4 | 85 | 33 | 0.048 | $ 26,298,937.15 |
| KCC | Kincora Copper | -4 | -19 | 0.24 | $ 16,679,990.16 | ||
| DTR | Dateline Resources | -4 | 19 | 52 | 153 | 0.095 | $ 35,888,739.00 |
| KCN | Kingsgate Consolid. | -4 | -8 | -9 | 100 | 0.83 | $ 193,423,178.70 |
| MTC | Metalstech | -4 | 0 | 15 | 62 | 0.235 | $ 36,147,144.93 |
| NXM | Nexus Minerals | -4 | -14 | -47 | 17 | 0.069 | $ 17,334,768.64 |
| FFR | Firefly Resources | -4 | 0 | -25 | 100 | 0.11 | $ 33,807,348.30 |
| SKY | SKY Metals | -4 | -35 | -42 | -56 | 0.11 | $ 27,791,481.08 |
| AL8 | Alderan Resource | -4 | -24 | -63 | -65 | 0.044 | $ 13,109,408.05 |
| MKR | Manuka Resources. | -4 | -22 | -14 | 0.32 | $ 30,848,786.24 | |
| E2M | E2 Metals | -5 | 2 | -48 | 69 | 0.305 | $ 45,047,521.80 |
| TLM | Talisman Mining | -5 | -7 | 106 | 14 | 0.2 | $ 37,325,677.00 |
| AWV | Anova Metals | -5 | -9 | -23 | -26 | 0.02 | $ 28,661,884.00 |
| KWR | Kingwest Resources | -5 | -14 | -54 | -46 | 0.079 | $ 15,960,148.09 |
| DGO | DGO Gold Limited | -5 | -18 | 5 | -25 | 2.93 | $ 226,539,383.84 |
| OAU | Ora Gold Limited | -5 | -17 | -17 | 19 | 0.019 | $ 16,841,904.44 |
| CBY | Canterbury Resources | -5 | -5 | -12 | -34 | 0.092 | $ 10,291,598.12 |
| HCH | Hot Chili | -6 | -11 | -19 | 70 | 0.034 | $ 105,541,764.05 |
| WWI | West Wits Mining | -6 | -14 | 17 | 232 | 0.083 | $ 116,287,681.62 |
| YRL | Yandal Resources | -6 | -16 | 14 | 81 | 0.49 | $ 55,378,630.94 |
| PNX | PNX Metals Limited | -6 | -11 | 14 | -20 | 0.008 | $ 32,869,741.60 |
| ZAG | Zuleika Gold | -6 | -18 | -40 | 11 | 0.031 | $ 12,302,801.19 |
| A1G | African Gold . | -6 | -16 | 0 | 89 | 0.23 | $ 21,937,882.56 |
| HXG | Hexagon Energy | -6 | -13 | 36 | 74 | 0.075 | $ 31,220,967.89 |
| MTH | Mithril Resources | -6 | -6 | -32 | -35 | 0.015 | $ 37,603,728.66 |
| REZ | Resourc & En Grp | -6 | 3 | -36 | 76 | 0.03 | $ 12,950,423.67 |
| AOP | Apollo Consolidated | -6 | -5 | -6 | -17 | 0.29 | $ 87,486,177.00 |
| GOR | Gold Road Res | -6 | -15 | -2 | -23 | 1.3 | $ 1,153,953,635.78 |
| ALY | Alchemy Resource | -7 | -18 | -22 | -38 | 0.014 | $ 9,411,408.34 |
| SRN | Surefire Rescs NL | -7 | -46 | -44 | 250 | 0.014 | $ 15,311,945.74 |
| CHZ | Chesser Resources | -7 | -13 | -46 | 40 | 0.13 | $ 58,825,276.25 |
| ZNC | Zenith Minerals | -7 | -2 | 92 | 108 | 0.25 | $ 73,590,007.50 |
| NWM | Norwest Minerals | -8 | -9 | -14 | -43 | 0.086 | $ 9,360,255.39 |
| NAE | New Age Exploration | -8 | -29 | 20 | 100 | 0.012 | $ 15,712,388.01 |
| GNM | Great Northern | -8 | -20 | 0 | -45 | 0.012 | $ 14,508,611.71 |
| RDS | Redstone Resources | -8 | -37 | -8 | 33 | 0.012 | $ 8,627,988.76 |
| BYH | Bryah Resources | -8 | -28 | -19 | 7 | 0.059 | $ 12,009,304.30 |
| DEX | Duke Exploration | -8 | -23 | 0 | 0.34 | $ 27,327,847.44 | |
| ADN | Andromeda Metals | -8 | -20 | -40 | 206 | 0.165 | $ 345,716,452.32 |
| HAW | Hawthorn Resources | -8 | -20 | -67 | -60 | 0.044 | $ 14,674,686.97 |
| CY5 | Cygnus Gold Limited | -9 | -30 | -42 | -32 | 0.105 | $ 11,384,110.29 |
| ADT | Adriatic Metals | -9 | -5 | 3 | 68 | 2.4 | $ 467,676,035.00 |
| DTM | Dart Mining NL | -10 | -16 | -32 | 0 | 0.13 | $ 12,992,911.88 |
| DEG | De Grey Mining | -11 | -26 | 17 | 19 | 1.19 | $ 1,589,672,985.03 |
| FFX | Firefinch | -11 | 13 | 122 | 281 | 0.4 | $ 352,080,450.15 |
| BBX | BBX Minerals | -11 | -13 | -14 | 60 | 0.24 | $ 104,972,606.16 |
| ENR | Encounter Resources | -12 | -17 | -17 | 3 | 0.15 | $ 47,438,478.45 |
| GIB | Gibb River Diamonds | -12 | -23 | -30 | 51 | 0.059 | $ 13,113,585.59 |
| IVR | Investigator Res | -12 | -30 | 8 | 344 | 0.08 | $ 107,239,675.17 |
| PAK | Pacific American Hld | -14 | -10 | -18 | 80 | 0.018 | $ 5,734,528.20 |
| MEG | Megado | -15 | -9 | -29 | 0.145 | $ 6,242,075.71 | |
| RGL | Riversgold | -17 | -15 | -29 | -52 | 0.035 | $ 14,545,519.06 |
| SMI | Santana Minerals | -18 | -29 | -52 | -41 | 0.082 | $ 9,350,676.15 |
| TMX | Terrain Minerals | -18 | -18 | 13 | 29 | 0.009 | $ 6,621,849.08 |
| DDD | 3D Resources Limited | -20 | -20 | 21 | 61 | 0.004 | $ 19,401,860.46 |
Earlier this week the Venture Minerals (ASX:VMS) – Chalice Mines (ASX:CHN) JV announced a ‘Julimar lookalike’ target at the South West Nickel-Copper-PGE Project in WA.
Emu’s ‘Sunfire’ project happens to be right next door:
Right next door to EMU Sunfire’s 1 km long nickel-copper geochem anomaly, Chalice announces new EM anomalies at Venture’s South West Nickel-Copper-PGE Project.
Right next door to EMU Sunfire's 1 km long nickel-copper geochem anomaly, Chalice announces new EM anomalies at Venture’s South West Nickel-Copper-PGE Project. pic.twitter.com/ERxWmTbY0X
— EMU NL (@emuasx) June 30, 2021
Nearology for the win.
Early stage aircore drilling has pulled “exceptional” hits like 12m at 2.78g/t gold from surface, including 4m at 7.63 g/t at ‘New Bendigo Main Zone’, part of the Tibooburra project in NSW.
“MHC has always believed that there is sufficient material at the New Bendigo Main Zone to cornerstone a near surface resource; for us it was about lifting the grade and accessing similar mineralisation to that historically mined,” chief exec Kell Nielsen says.
RC drilling has now been planned to target the higher grades at Main Zone.
Last week the explorer applied for a planning permit to construct and operate a 180,000 tonnes per annum gold toll treatment plant – to treat ore from third party mines — at its mothballed namesake project site in Victoria.
Nagambie says the plant would “re-invigorate the Victorian gold mining industry with processing capability, creating and supporting ongoing employment in the region”.
CHALLENGER EXPLORATION (ASX:CEL)
More bonanza gold grades from Challenger’s flagship ‘Hualilan’ project in Argentina.
Highlights include 15.6m at 71.7 g/t gold equivalent, or 70.9 g/t gold, 59.1 g/t silver and 0.2% zinc. This includes a 4m section grading over 200g/t.
Impressive.
“These are the best results we have seen at our Flagship Hualilan gold project – 4m at 201.6 g/t gold is outstanding,” managing director Kris Knauer says.
“The results confirm our view that the strongest mineralisation is likely to be in the Hualilan Hills which are yet to be drilled.”


Get the latest Stockhead news delivered free to your inbox.