

Mining
Monsters of Rock: MinRes has 'seen the bottom' in lithium prices, Lynas tightens the screws on rare earths supply

Mining
Rock chip revelation: New gold zone at Mako’s Tchaga North returns up to 76.10 g/t

Mining
Pic: Schroptschop / E+ via Getty Images
Mining
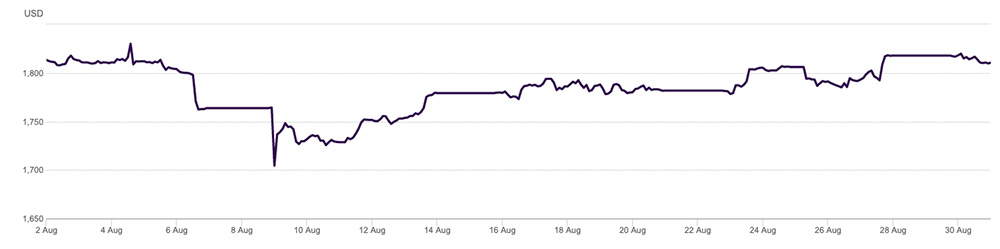
August was a rollercoaster for the gold price, but — after a chaotic flash crash saw it plummet into the $US1600s earlier in the month — it ended up where it started.
Gold is one of the year’s worst performing metals, but we are living through a commodities super cycle; ‘worst performer’ is not as bad as it sounds.
Especially for producers, which reported record FY21 profits thanks to that record-high gold price run through August last year.
Perseus Mining (ASX:PRU) saw a 48% rise in net profit after tax (NPAT) to $139.4 million in FY2021 and an 11% increase in EBITDA to $303.1m.
Ramelius Resources (ASX:RMS) reported a record profit for FY21 of $126.8m and will pay a full franked 2.5c per share dividend.
Meanwhile, Northern Star (ASX:NST) sold ~1.6Moz of gold at a record average price of $2277/oz.
That generated a statutory NPAT of $1.03 billion.
Evolution Mining (ASX:AVN) disappointed with production figures that showed gold output falling from 746,463oz in 2020 to 680,788/oz in 2021.
But its financials were well received, with ‘sector leading’ costs of $1215 an ounce helping the Sydney-based gold miner to a 14% increase in profit to a record $354.3 million.
Then there’s the ASX’s largest goldie Newcrest Mining (ASX:NCM), which produced 2.1Moz of gold and 142,700 tonnes of copper for a $1.2 billion profit. Another record.
Here’s how ASX-listed gold & silver stocks are performing:
Scroll or swipe to reveal table. Click headings to sort. Best viewed on a laptop
| CODE | COMPANY | 1 WEEK RETURN % | 1 MONTH RETURN % | 6 MONTH RETURN % | 1 YEAR RETURN % | PRICE | MARKET CAP |
|---|---|---|---|---|---|---|---|
| ADV | Ardiden | 25 | 76 | -6 | -21 | 0.015 | $ 27,941,604.81 |
| AZS | Azure Minerals | 34 | 71 | 43 | 151 | 0.4275 | $ 129,879,002.82 |
| NXM | Nexus Minerals | 20 | 69 | 58 | 103 | 0.15 | $ 36,622,750.65 |
| GBR | Great Boulder Resources | 86 | 67 | 281 | 204 | 0.16 | $ 62,172,432.00 |
| AAJ | Aruma Resources | 13 | 67 | 23 | -19 | 0.085 | $ 9,006,678.80 |
| ARV | Artemis Resources | 29 | 60 | 17 | 11 | 0.088 | $ 105,419,802.68 |
| GTR | GTI Resources | 30 | 53 | 44 | 0 | 0.026 | $ 17,928,913.95 |
| A8G | Australasian Gold | 38 | 52 | 0.22 | $ 6,954,137.61 | ||
| FFX | Firefinch | 11 | 49 | 183 | 205 | 0.595 | $ 552,365,701.20 |
| ANX | Anax Metals | 29 | 47 | 55 | 350 | 0.11 | $ 38,520,227.90 |
| HWK | Hawkstone Mining | 2 | 45 | 5 | 133 | 0.042 | $ 72,082,966.07 |
| BRB | Breaker Resources | 13 | 42 | 7 | -6 | 0.22 | $ 70,055,799.74 |
| VRC | Volt Resources | 24 | 38 | 140 | 125 | 0.036 | $ 78,081,650.72 |
| ONX | Orminex | 13 | 36 | 22 | 10 | 0.045 | $ 24,655,253.58 |
| CST | Castile Resources | 5 | 31 | 35 | -12 | 0.23 | $ 41,939,125.41 |
| MRZ | Mont Royal Resources | 2 | 31 | -4 | 15 | 0.275 | $ 12,499,315.95 |
| KTA | Krakatoa Resources | 25 | 30 | 0 | -13 | 0.065 | $ 20,334,984.27 |
| HCH | Hot Chili | 7 | 28 | -2 | 5 | 0.046 | $ 169,794,037.17 |
| PNM | Pacific Nickel Mines | 35 | 28 | 30 | 57 | 0.074 | $ 15,902,232.66 |
| M2R | Miramar | -2 | 27 | -9 | 0.21 | $ 10,033,191.75 | |
| AYM | Australia United Min | 11 | 25 | 11 | 100 | 0.01 | $ 16,583,197.37 |
| MBK | Metal Bank | 11 | 25 | -9 | 25 | 0.01 | $ 11,890,683.04 |
| MTC | Metalstech | 18 | 23 | 100 | 66 | 0.29 | $ 38,876,021.31 |
| NVA | Nova Minerals | 29 | 23 | -7 | 114 | 0.135 | $ 193,308,864.41 |
| PUA | Peak Minerals | 10 | 22 | -21 | -19 | 0.022 | $ 12,294,053.04 |
| HAW | Hawthorn Resources | 23 | 20 | -33 | -51 | 0.054 | $ 18,009,843.10 |
| CXU | Cauldron Energy | 16 | 20 | 13 | 3 | 0.036 | $ 13,679,985.36 |
| BAR | Barra Resources | 9 | 20 | 9 | 0 | 0.024 | $ 15,584,986.32 |
| OKR | Okapi Resources | 22 | 18 | 174 | 142 | 0.52 | $ 48,617,628.48 |
| LM8 | Lunnon Metals | 1 | 18 | 0.59 | $ 45,194,092.04 | ||
| CHZ | Chesser Resources | 3 | 18 | -3 | -20 | 0.165 | $ 74,159,380.00 |
| AM7 | Arcadia Minerals | 11 | 17 | 0.21 | $ 7,182,000.00 | ||
| GUL | Gullewa | 5 | 17 | 14 | 3 | 0.091 | $ 17,323,952.10 |
| BMO | Bastion Minerals | 5 | 16 | 0.22 | $ 12,639,937.20 | ||
| BNR | Bulletin Resources | 38 | 16 | -5 | -6 | 0.066 | $ 11,116,170.59 |
| WCN | White Cliff Min | 36 | 15 | -17 | 15 | 0.015 | $ 7,240,749.59 |
| POL | Polymetals Resources | 3 | 15 | 0.15 | $ 5,629,372.27 | ||
| ICL | Iceni Gold | 2 | 13 | 0.215 | $ 25,153,798.53 | ||
| RED | Red 5 | 16 | 13 | 33 | -29 | 0.22 | $ 541,887,658.08 |
| RDN | Raiden Resources | 29 | 13 | 13 | 200 | 0.027 | $ 34,961,961.89 |
| DDD | 3D Resources | 13 | 13 | 36 | 9 | 0.0045 | $ 17,461,674.41 |
| TMX | Terrain Minerals | 0 | 13 | -18 | -40 | 0.009 | $ 6,621,849.08 |
| ENR | Encounter Resources | 3 | 12 | 9 | 27 | 0.19 | $ 58,507,456.76 |
| YRL | Yandal Resources | -3 | 12 | 23 | 116 | 0.53 | $ 54,237,574.62 |
| EM2 | Eagle Mountain | 20 | 11 | 87 | 226 | 0.88 | $ 167,383,080.98 |
| DEX | Duke Exploration | 11 | 11 | -8 | 0.3 | $ 26,612,289.84 | |
| CMM | Capricorn Metals | 10 | 11 | 64 | 22 | 2.4 | $ 876,566,930.54 |
| OZM | Ozaurum Resources | 15 | 11 | -16 | 0.155 | $ 8,063,100.00 | |
| DTR | Dateline Resources | 4 | 11 | 88 | 88 | 0.094 | $ 40,843,896.10 |
| CAI | Calidus Resources | 15 | 11 | 47 | 6 | 0.575 | $ 229,958,799.53 |
| GIB | Gibb River Diamonds | -9 | 11 | -19 | 15 | 0.063 | $ 13,536,604.48 |
| GMN | Gold Mountain | 0 | 10 | -42 | -42 | 0.022 | $ 22,473,132.57 |
| CBY | Canterbury Resources | -4 | 10 | -15 | -15 | 0.11 | $ 13,221,838.30 |
| TIN | TNT Mines | 0 | 10 | 3 | -6 | 0.17 | $ 20,408,198.93 |
| TTM | Titan Minerals | 9 | 9 | 9 | 4 | 0.12 | $ 133,459,036.52 |
| CEL | Challenger Exploration | 9 | 9 | -9 | 13 | 0.2825 | $ 236,139,803.48 |
| FAU | First Au | 18 | 8 | -24 | -35 | 0.013 | $ 7,990,173.80 |
| CDT | Castle Minerals | -7 | 8 | 63 | 0 | 0.013 | $ 10,255,011.45 |
| G88 | Golden Mile Resources | -4 | 8 | 2 | -4 | 0.053 | $ 7,614,989.71 |
| AOP | Apollo Consolidated | 0 | 7 | 7 | 12 | 0.37 | $ 107,899,618.30 |
| LCY | Legacy Iron Ore | 7 | 7 | -6 | 200 | 0.015 | $ 89,666,339.24 |
| MKR | Manuka Resources | 7 | 7 | -29 | -52 | 0.31 | $ 31,462,229.53 |
| AGS | Alliance Resources | 6 | 6 | -6 | -27 | 0.165 | $ 34,322,827.11 |
| SNG | Siren Gold | -2 | 6 | -32 | 0.265 | $ 18,932,841.26 | |
| QML | Qmines | 6 | 6 | 0.355 | $ 16,189,849.16 | ||
| BGD | Barton Gold | 9 | 6 | 0.19 | $ 16,309,599.24 | ||
| PRX | Prodigy Gold | 0 | 5 | -7 | -45 | 0.04 | $ 23,225,104.24 |
| A1G | African Gold | -2 | 5 | -13 | 33 | 0.2 | $ 17,824,529.58 |
| KAI | Kairos Minerals | 5 | 5 | 22 | -32 | 0.0305 | $ 50,295,340.95 |
| ICG | Inca Minerals | -12 | 5 | 21 | 66 | 0.11 | $ 55,289,751.75 |
| AWV | Anova Metals | -15 | 5 | 10 | -31 | 0.022 | $ 34,394,260.80 |
| RVR | Red River Resources | 5 | 5 | -28 | 23 | 0.1725 | $ 89,316,078.31 |
| AXE | Archer Materials | -2 | 4 | 72 | 276 | 1.69 | $ 393,932,324.58 |
| MML | Medusa Mining | 6 | 4 | -10 | -3 | 0.85 | $ 177,731,672.36 |
| HXG | Hexagon Energy | -5 | 4 | -23 | 26 | 0.073 | $ 32,112,995.54 |
| MM8 | Medallion Metals | 4 | 4 | 0.25 | $ 20,242,521.50 | ||
| HRN | Horizon Gold | 44 | 4 | 3 | -19 | 0.41 | $ 43,743,726.56 |
| TNR | Torian Resources | 17 | 4 | -52 | 100 | 0.028 | $ 23,473,453.10 |
| MVL | Marvel Gold | 2 | 4 | 17 | 6 | 0.056 | $ 32,999,170.06 |
| RXL | Rox Resources | 19 | 4 | -11 | -56 | 0.44 | $ 68,559,312.09 |
| EMU | EMU NL | 3 | 3 | -57 | 0 | 0.03 | $ 11,869,376.58 |
| ADT | Adriatic Metals | 13 | 3 | 43 | 29 | 3.06 | $ 533,592,326.47 |
| ADN | Andromeda Metals | 0 | 3 | -49 | 248 | 0.16 | $ 393,768,327.36 |
| SAU | Southern Gold | 0 | 3 | -26 | -50 | 0.067 | $ 14,293,026.65 |
| BCN | Beacon Minerals | -3 | 3 | -8 | 7 | 0.034 | $ 123,631,652.00 |
| ARN | Aldoro Resources | 22 | 3 | 174 | 453 | 0.52 | $ 46,223,202.17 |
| AAU | Antilles Gold | -1 | 3 | -21 | 91 | 0.077 | $ 19,433,921.28 |
| BDC | Bardoc Gold | 5 | 2 | -4 | -13 | 0.0675 | $ 114,526,986.82 |
| KAU | Kaiser Reef | -4 | 2 | -43 | -37 | 0.23 | $ 22,265,921.42 |
| WMC | Wiluna Mining Corp | -2 | 2 | -3 | -32 | 1.03 | $ 165,431,111.78 |
| ERM | Emmerson Resources | -1 | 1 | 5 | -29 | 0.068 | $ 34,876,694.23 |
| NUS | Nusantara Resources | 0 | 1 | 25 | 17 | 0.345 | $ 79,927,187.42 |
| MAU | Magnetic Resources | 2 | 1 | 3 | -3 | 1.62 | $ 353,441,053.80 |
| SFM | Santa Fe Minerals | 2 | 1 | -26 | 18 | 0.085 | $ 6,189,597.07 |
| NML | Navarre Minerals | 9 | 1 | -35 | -30 | 0.094 | $ 62,817,493.59 |
| SSR | SSR Mining Inc. | 1 | 1 | 24 | 22.11 | $ 469,987,831.44 | |
| ANL | Amani Gold | 50 | 0 | 50 | -25 | 0.0015 | $ 24,773,993.49 |
| AVW | Avira Resources | 25 | 0 | 0 | -17 | 0.005 | $ 6,875,200.00 |
| MHC | Manhattan Corp | 20 | 0 | -25 | -71 | 0.012 | $ 16,789,065.62 |
| PNX | PNX Metals Limited | 14 | 0 | 0 | -27 | 0.008 | $ 29,217,548.09 |
| NAG | Nagambie Resources | 11 | 0 | 47 | 62 | 0.081 | $ 39,994,587.68 |
| SI6 | SI6 Metals Limited | 8 | 0 | -38 | 0 | 0.013 | $ 17,137,727.82 |
| NMR | Native Mineral Res | 8 | 0 | -15 | 0.265 | $ 7,203,375.00 | |
| VAN | Vango Mining | 5 | 0 | 16 | -36 | 0.067 | $ 72,545,114.47 |
| TRM | Truscott Mining Corp | 3 | 0 | 38 | 106 | 0.033 | $ 5,014,070.95 |
| AUC | Ausgold Limited | 3 | 0 | -15 | 5 | 0.04 | $ 63,413,981.64 |
| BMR | Ballymore Resources | 0 | 0 | 0 | 0 | 0.425 | $ 14,295,616.20 |
| RMX | Red Mount Min | 0 | 0 | -25 | 29 | 0.009 | $ 13,180,124.72 |
| SBR | Sabre Resources | 0 | 0 | -43 | -43 | 0.004 | $ 6,732,254.60 |
| DLC | Delecta Limited | 0 | 0 | -14 | 0 | 0.006 | $ 6,051,727.23 |
| CGN | Crater Gold Min | 0 | 0 | -23 | 21 | 0.017 | $ 20,867,429.74 |
| XTC | Xantippe Res | 0 | 0 | 0 | -33 | 0.002 | $ 8,149,128.80 |
| SIH | Sihayo Gold Limited | 0 | 0 | -23 | -58 | 0.01 | $ 36,854,614.13 |
| KGM | Kalnorth Gold | 0 | 0 | 0 | 0 | 0.013 | $ 11,625,120.78 |
| DCX | Discovex Res | 0 | 0 | -29 | -38 | 0.005 | $ 12,843,320.38 |
| GRL | Godolphin Resources | -6 | 0 | -21 | -20 | 0.165 | $ 13,457,803.36 |
| MKG | Mako Gold | 1 | -1 | -7 | -35 | 0.088 | $ 34,401,744.18 |
| KZR | Kalamazoo Resources | 1 | -1 | -21 | -49 | 0.36 | $ 48,976,223.41 |
| MGV | Musgrave Minerals | 5 | -2 | 3 | -48 | 0.315 | $ 170,631,343.68 |
| PF1 | Pathfinder Resources | 4 | -2 | 40 | 0.295 | $ 14,719,390.80 | |
| PUR | Pursuit Minerals | -9 | -2 | -5 | 273 | 0.059 | $ 52,839,793.21 |
| SVY | Stavely Minerals | 7 | -2 | -44 | -16 | 0.44 | $ 121,347,075.18 |
| AME | Alto Metals Limited | -1 | -2 | 19 | 1 | 0.087 | $ 40,073,116.50 |
| TMZ | Thomson Res | 6 | -2 | -32 | 106 | 0.105 | $ 48,722,488.61 |
| MZZ | Matador Mining | 1 | -2 | 32 | -14 | 0.41 | $ 87,312,134.66 |
| DRE | Dreadnought Resources | -2 | -2 | 141 | 193 | 0.041 | $ 106,492,689.47 |
| BNZ | Benz Mining | -1 | -2 | -6 | 0.81 | $ 31,342,022.15 | |
| RND | Rand Mining | 1 | -3 | -8 | -30 | 1.47 | $ 83,607,662.67 |
| ASO | Aston Minerals | 12 | -3 | 314 | 282 | 0.145 | $ 133,587,640.06 |
| ZAG | Zuleika Gold | 0 | -3 | -37 | -19 | 0.029 | $ 11,892,707.82 |
| AAR | Anglo Australian | 6 | -3 | -14 | -56 | 0.083 | $ 50,675,235.32 |
| BYH | Bryah Resources | 6 | -4 | -16 | 4 | 0.054 | $ 11,670,980.28 |
| AL8 | Alderan Resource | -4 | -4 | -42 | -63 | 0.05 | $ 17,102,862.75 |
| WAF | West African Resources | 2 | -4 | 44 | 4 | 1.0475 | $ 936,406,239.78 |
| ARL | Ardea Resources | 2 | -4 | -13 | -16 | 0.485 | $ 66,256,425.12 |
| OKU | Oklo Resources | 4 | -4 | -27 | -55 | 0.12 | $ 59,223,502.91 |
| ZNC | Zenith Minerals | 15 | -4 | 77 | 142 | 0.23 | $ 69,287,406.51 |
| TSO | Tesoro Resources | 10 | -4 | -45 | -31 | 0.11 | $ 52,605,721.25 |
| FFR | Firefly Resources | -8 | -4 | -12 | 6 | 0.11 | $ 35,459,045.95 |
| CYL | Catalyst Metals | 2 | -4 | 5 | -20 | 1.95 | $ 186,761,873.70 |
| CHN | Chalice Mining | 1 | -5 | 57 | 361 | 6.8 | $ 2,357,627,042.40 |
| PAK | Pacific American Hld | 6 | -6 | -19 | -6 | 0.017 | $ 5,415,943.30 |
| TBR | Tribune Res | -2 | -6 | 2 | -36 | 5.1 | $ 272,834,000.40 |
| NST | Northern Star | 3 | -6 | 3 | -28 | 9.77 | $ 11,339,815,454.00 |
| FML | Focus Minerals | -2 | -6 | -27 | -45 | 0.24 | $ 43,859,655.60 |
| AMI | Aurelia Metals | 1 | -6 | -5 | -32 | 0.3525 | $ 425,985,256.88 |
| EMR | Emerald Res NL | 3 | -6 | 9 | 33 | 0.835 | $ 422,625,709.74 |
| MEU | Marmota Limited | 5 | -6 | 0 | -6 | 0.045 | $ 40,678,414.98 |
| KWR | Kingwest Resources | 12 | -6 | -54 | -51 | 0.073 | $ 14,579,403.37 |
| WGX | Westgold Resources. | 3 | -6 | -7 | -21 | 1.735 | $ 742,229,204.50 |
| CWX | Carawine Resources | -2 | -7 | -37 | 2 | 0.215 | $ 24,500,227.95 |
| NWM | Norwest Minerals | -7 | -7 | -8 | -42 | 0.071 | $ 12,823,116.53 |
| ALY | Alchemy Resource | 0 | -7 | -13 | -22 | 0.014 | $ 9,411,408.34 |
| TAM | Tanami Gold NL | -1 | -7 | -11 | 4 | 0.07 | $ 82,256,793.22 |
| REZ | Resourc & En Grp | -10 | -7 | -28 | 33 | 0.028 | $ 12,518,742.88 |
| HMX | Hammer Metals | 4 | -7 | -31 | 89 | 0.083 | $ 67,520,053.71 |
| AWJ | Auric Mining | -7 | -7 | -27 | 0.135 | $ 5,997,041.42 | |
| SPQ | Superior Resources | 8 | -7 | 8 | 44 | 0.013 | $ 16,576,029.49 |
| GOR | Gold Road Res | 1 | -7 | 16 | -20 | 1.2575 | $ 1,109,909,603.88 |
| BC8 | Black Cat Syndicate | 7 | -7 | -13 | -29 | 0.58 | $ 81,668,530.38 |
| PNR | Pantoro Limited | 7 | -8 | -1 | -19 | 0.2025 | $ 281,799,739.60 |
| GBZ | GBM Rsources | 10 | -8 | 15 | -18 | 0.115 | $ 50,233,070.31 |
| KCN | Kingsgate Consolid. | 4 | -8 | -21 | 22 | 0.73 | $ 162,882,676.80 |
| NCM | Newcrest Mining | 1 | -8 | 3 | -22 | 24.68 | $ 20,219,746,980.08 |
| CTO | Citigold Corp | 0 | -8 | -8 | -8 | 0.011 | $ 28,336,590.91 |
| SLZ | Sultan Resources | 0 | -8 | -18 | -34 | 0.165 | $ 11,473,174.19 |
| EVN | Evolution Mining | -1 | -8 | -2 | -31 | 3.91 | $ 7,129,326,344.12 |
| SKY | SKY Metals | -4 | -9 | -46 | -41 | 0.086 | $ 27,981,100.35 |
| FG1 | Flynngold | 7 | -9 | 0.16 | $ 9,599,999.68 | ||
| IVR | Investigator Res | 0 | -9 | -29 | 8 | 0.064 | $ 86,056,529.46 |
| DGO | DGO Gold Limited | 3 | -9 | 16 | -16 | 3.05 | $ 240,611,555.52 |
| GNM | Great Northern | 11 | -9 | -17 | -57 | 0.01 | $ 12,090,509.76 |
| MEG | Megado | -5 | -9 | -43 | 0.1 | $ 4,520,123.79 | |
| VKA | Viking Mines | -13 | -9 | -52 | 65 | 0.02 | $ 20,425,168.62 |
| SRN | Surefire Rescs NL | 4 | -9 | -40 | 45 | 0.0145 | $ 15,460,345.73 |
| KRM | Kingsrose Mining | 2 | -10 | -6 | 27 | 0.047 | $ 32,850,330.84 |
| KSN | Kingston Resources | 12 | -10 | -8 | -31 | 0.185 | $ 54,369,365.83 |
| PRU | Perseus Mining | 4 | -10 | 41 | 4 | 1.525 | $ 1,864,993,746.40 |
| RRL | Regis Resources | -3 | -10 | -19 | -53 | 2.39 | $ 1,802,557,602.78 |
| LNY | Laneway Res | 13 | -10 | -10 | -44 | 0.0045 | $ 15,616,263.73 |
| NES | Nelson Resources. | 2 | -10 | -58 | -38 | 0.045 | $ 8,743,148.78 |
| MCT | Metalicity Limited | 0 | -10 | -31 | -67 | 0.009 | $ 19,293,943.79 |
| DEG | De Grey Mining | 3 | -10 | 38 | -10 | 1.185 | $ 1,531,514,217.29 |
| M24 | Mamba Exploration | -3 | -10 | -20 | 0.175 | $ 6,660,000.00 | |
| MOH | Moho Resources | 2 | -10 | -25 | -47 | 0.061 | $ 6,196,524.12 |
| DCN | Dacian Gold | -10 | -10 | -39 | -36 | 0.215 | $ 207,997,450.86 |
| VMC | Venus Metals Cor | 3 | -11 | -15 | -31 | 0.17 | $ 24,172,589.28 |
| MTH | Mithril Resources | 0 | -11 | -15 | -68 | 0.017 | $ 39,953,961.70 |
| MAT | Matsa Resources | 5 | -11 | -34 | -63 | 0.059 | $ 20,772,967.96 |
| IPT | Impact Minerals | -4 | -11 | -46 | -48 | 0.0125 | $ 24,285,539.03 |
| CDR | Codrus Minerals | 6 | -11 | 0.165 | $ 6,600,000.00 | ||
| RGL | Riversgold | -3 | -11 | -39 | -39 | 0.033 | $ 13,333,392.47 |
| SMI | Santana Minerals | -11 | -11 | -35 | -65 | 0.098 | $ 11,175,198.33 |
| GML | Gateway Mining | -6 | -11 | -41 | -33 | 0.016 | $ 32,361,805.20 |
| PGD | Peregrine Gold | 4 | -11 | 0.395 | $ 13,943,499.93 | ||
| AQX | Alice Queen | -4 | -12 | -56 | -73 | 0.0115 | $ 13,602,453.10 |
| TRN | Torrens Mining | -3 | -12 | 19 | 0.19 | $ 12,619,763.53 | |
| PDI | Predictive Disc | 2 | -12 | 137 | 84 | 0.1325 | $ 175,696,345.89 |
| TRY | Troy Resources | -8 | -12 | -47 | -65 | 0.037 | $ 30,073,993.35 |
| GSN | Great Southern | -2 | -12 | -30 | -56 | 0.051 | $ 25,788,681.42 |
| TBA | Tombola Gold | -20 | -12 | -31 | -16 | 0.043 | $ 25,688,979.05 |
| BAT | Battery Minerals | 27 | -13 | -48 | 27 | 0.014 | $ 31,542,413.00 |
| TG1 | Techgen Metals | 6 | -13 | 0.175 | $ 7,320,469.15 | ||
| TIE | Tietto Minerals | 2 | -13 | 2 | -41 | 0.315 | $ 145,979,345.92 |
| HRZ | Horizon | 0 | -13 | 5 | -25 | 0.105 | $ 62,477,272.00 |
| TSC | Twenty Seven Co. | 0 | -13 | -50 | -36 | 0.0035 | $ 7,982,441.72 |
| THR | Thor Mining PLC | 0 | -13 | -7 | 27 | 0.014 | $ 7,323,295.08 |
| DTM | Dart Mining NL | 0 | -13 | -38 | -42 | 0.105 | $ 10,494,274.98 |
| GMR | Golden Rim Resources | -7 | -13 | -22 | -46 | 0.007 | $ 18,692,447.75 |
| LCL | Los Cerros Limited | -4 | -13 | 4 | 93 | 0.135 | $ 84,498,257.70 |
| BTR | Brightstar Resources | -7 | -13 | -37 | -4 | 0.027 | $ 11,873,270.63 |
| MDI | Middle Island Res | 2 | -13 | -57 | -77 | 0.1 | $ 12,241,822.20 |
| SLR | Silver Lake Resource | 1 | -14 | 1 | -40 | 1.3575 | $ 1,212,895,947.33 |
| PRS | Prospech Limited | -3 | -14 | -38 | 0 | 0.09 | $ 5,866,290.45 |
| SVL | Silver Mines Limited | 3 | -15 | -2 | -21 | 0.205 | $ 250,292,605.09 |
| IDA | Indiana Resources | 0 | -15 | -34 | 32 | 0.058 | $ 25,197,923.68 |
| RML | Resolution Minerals | 5 | -15 | -4 | -65 | 0.023 | $ 10,296,631.12 |
| CAZ | Cazaly Resources | -6 | -15 | 10 | 7 | 0.046 | $ 17,739,036.82 |
| BBX | BBX Minerals | -11 | -15 | -30 | -29 | 0.195 | $ 89,314,187.63 |
| SBM | St Barbara Limited | 3 | -15 | -21 | -55 | 1.575 | $ 1,104,933,811.80 |
| GED | Golden Deeps | 0 | -15 | 0 | -31 | 0.011 | $ 8,534,365.84 |
| AGG | AngloGold Ashanti | 1 | -15 | -11 | -43 | 4.58 | $ 422,844,806.10 |
| STK | Strickland Metals | 3 | -16 | 71 | -26 | 0.038 | $ 41,064,054.15 |
| RSG | Resolute Mining | 3 | -16 | -25 | -59 | 0.46 | $ 507,790,644.76 |
| PKO | Peako Limited | 0 | -16 | 17 | -28 | 0.027 | $ 8,945,168.93 |
| RMS | Ramelius Resources | -2 | -16 | 24 | -30 | 1.4925 | $ 1,233,356,182.35 |
| CLA | Celsius Resource | 0 | -16 | -43 | 44 | 0.026 | $ 27,227,930.11 |
| RDS | Redstone Resources | 0 | -17 | -44 | -50 | 0.01 | $ 7,189,990.63 |
| NAE | New Age Exploration | 0 | -17 | -17 | 0 | 0.01 | $ 15,794,888.01 |
| WWI | West Wits Mining | -1 | -17 | -25 | 188 | 0.0575 | $ 86,575,568.63 |
| TCG | Turaco Gold Limited | 4 | -17 | 100 | 140 | 0.12 | $ 40,187,468.40 |
| GSM | Golden State Mining | -4 | -17 | -23 | -62 | 0.12 | $ 9,929,802.96 |
| TAR | Taruga Minerals | -6 | -18 | 0 | -32 | 0.047 | $ 24,578,880.29 |
| NSM | Northstaw | -2 | -18 | -31 | 0.305 | $ 12,800,000.00 | |
| XAM | Xanadu Mines | 0 | -18 | -45 | -40 | 0.028 | $ 35,253,057.00 |
| KCC | Kincora Copper | -8 | -18 | 0.185 | $ 14,207,468.00 | ||
| ALK | Alkane Resources | -2 | -18 | 42 | -16 | 0.95 | $ 568,596,304.00 |
| CY5 | Cygnus Gold Limited | 4 | -19 | -26 | -41 | 0.13 | $ 14,636,713.23 |
| OAU | Ora Gold Limited | -6 | -19 | -26 | -6 | 0.017 | $ 14,315,618.77 |
| AGC | AGC | 0 | -20 | -31 | 0.12 | $ 8,127,274.08 | |
| BGL | Bellevue Gold | -10 | -20 | 19 | -16 | 0.855 | $ 811,624,963.28 |
| OBM | Ora Banda Mining | 21 | -21 | -53 | -67 | 0.115 | $ 90,557,308.97 |
| STN | Saturn Metals | -4 | -22 | 7 | -51 | 0.39 | $ 45,608,876.55 |
| MRR | Minrex Resources | -13 | -22 | -44 | -53 | 0.014 | $ 8,372,055.83 |
| E2M | E2 Metals | 2 | -23 | -29 | 33 | 0.265 | $ 39,874,871.45 |
| TLM | Talisman Mining | -3 | -23 | 65 | 38 | 0.165 | $ 31,726,825.45 |
| LEX | Lefroy Exploration | 15 | -24 | -27 | 88 | 0.47 | $ 55,904,470.16 |
| S2R | S2 Resources | -4 | -24 | -24 | -29 | 0.125 | $ 48,110,605.43 |
| MEI | Meteoric Resources | 6 | -24 | -46 | -12 | 0.037 | $ 49,479,786.94 |
| AQI | Alicanto Min | -11 | -25 | 4 | -25 | 0.12 | $ 37,819,758.02 |
| NPM | Newpeak Metals | -25 | -25 | -50 | -25 | 0.0015 | $ 6,827,435.15 |
| MLS | Metals Australia | -25 | -25 | -25 | -25 | 0.0015 | $ 8,454,376.09 |
| BRV | Big River Gold | -2 | -26 | -18 | -40 | 0.295 | $ 64,735,523.34 |
| AUT | Auteco Minerals | -2 | -27 | -10 | -48 | 0.088 | $ 148,378,925.30 |
| WRM | White Rock Min | 5 | -27 | -44 | -48 | 0.335 | $ 47,013,704.76 |
| GWR | GWR Group | -5 | -40 | -24 | -3 | 0.2 | $ 60,557,288.60 |
| G50 | Gold50Limited | 9 | 0.25 | $ 13,082,680.26 |
Market Cap: $39m
Any ASX stock with exposure to lithium, including Ardiden, went mental earlier in the month.
The Canadian gold explorer recently inked a JV with Green Technology Metals (GTM) to explore and potentially develop ADV’s non-core lithium assets in Ontario.
GTM would progressively acquire up to 80% ownership of the lithium tenements for $9.2 million, subject to shareholder approval.
Market Cap: $38m
More high grade gold from the ‘Wallbrook’ project in WA, where new hits like 10m at 5.49g/t gold – which ended in mineralisation — follow on from some solid results earlier in August.
“These high-grade results from the Crusader prospect have again shown excellent continuity of mineralisation with broad, high-grade gold intersected,” managing director Andy Tudor says.
“With highly encouraging results from all holes in this RC drilling campaign, we are eagerly awaiting to see the geology and the potential mineralisation in the drilling from the diamond tails currently being drilled at Crusader.”
The drilling program now moves to the nearby Templar prospect where a 6,000m program is nearing completion.
Results from the initial 50% of the program are expected very soon, Nexus says.
Market Cap: $9m
Like Ardiden, Aruma’s main game is gold with a side of lithium.
The geology of its ‘Mt Deans’ project in WA is similar to the nearby Mt Marion (Mineral Resources (ASX:MIN)), Bald Hill and Buldania (Liontown Resources (ASX:LTR)) deposits, the company says.
While explorers love to make these sorts of comparisons, Aruma is going to test the theory with a maiden 12-hole drilling program in September.
Market Cap: $7m
Australasian Gold hit the bourse earlier this year with a focus on Queensland gold, but this share price gain was, once again, lithium related.
The stock has lodged a tenement application in the Mt Peake pegmatite district in Northern Territory.
The ground, which covers over 640sqkm and shares a boundary with Core Lithium’s (ASX:CXO) ‘Anningie’ lithium project, will be the focus on an upcoming field mapping campaign.
Mining
Mining
Mining


Get the latest Stockhead news delivered free to your inbox.


