Pic: Tyler Stableford / Stone via Getty Images
Bulk Buys: Why do iron ore ports keep catching fire?
Mining
Pic: Tyler Stableford / Stone via Getty Images
Mining
Iron ore price predictions are all over the shop.
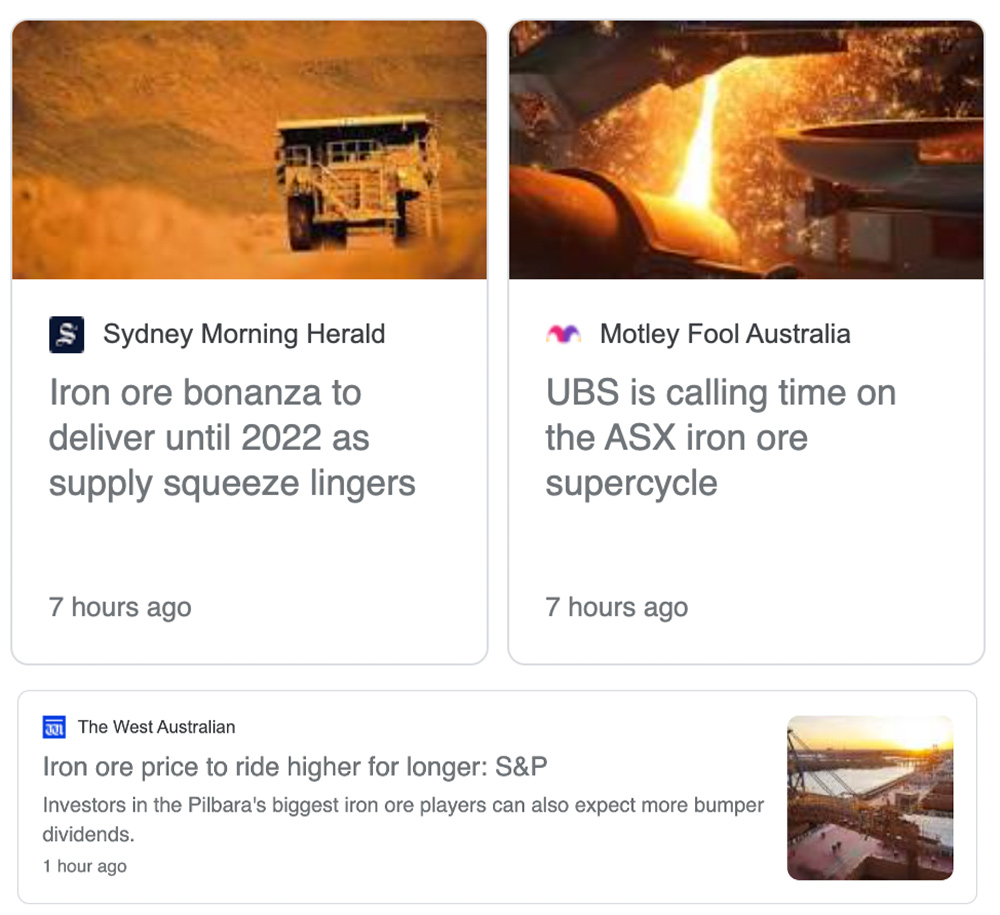
Clearly, no one has a clue where iron ore prices will end up.
But we can tell you where they’ve been (and maybe where they’re going next).
Prices are still at historically high levels, but the Argus 62% iron ore fines index fell by $US11.25/t — or 6.4% — to $US165/t over the month of March.
And while overall steel demand is likely to accelerate as China enters traditional peak season in April — supported by old and new infrastructure projects, real estate, auto and equipment manufacturing – that may not be good news for iron ore prices.
“Steel output remains curbed [ostensibly due to pollution concerns], which may support steel prices while weakening iron ore prices,” Argus says.
The meteoric rise in iron ore prices has been triggered by a combination of factors, which includes reduced output from giant Brazilian iron ore miner Vale.
But Brazilian iron ore exports are now recovering, up ~34% in March compared to the same period last year, according to Metal Bulletin.
In some good news for iron ore players (well, most of them), another iron ore berth has caught fire, impacting a decent chunk of supply.
In January, it was Vale; this time, it’s the Rio Tinto-owned Iron Ore Company of Canada.
“Given the extent of the damage at the berth, some industry sources expect repairs to take around one to two months,” S&P Platts says.
“Shipment data seen by Platts showed that in 2020, China was IOC’s largest customer, loading 6.7 million mt of iron ore from the terminal, contributing almost 32% of IOC’s exports.
“Market participants saw limited alternatives for IOC’s customers impacted by the disrupted supply given the general lack of spot cargoes from other high grade pellet and concentrate producers due to high term contractual volumes with European and Middle Eastern steel producers.”
Scroll or swipe to reveal table. Click headings to sort. Best viewed on a laptop
| CODE | COMPANY | 1 WEEK RETURN % | 1 MONTH RETURN % | 6 MONTH RETURN % | 1 YEAR RETURN % | SHARE PRICE | MARKET CAP |
|---|---|---|---|---|---|---|---|
| AKO | Akora Resources | 27 | 37 | 0.5 | $ 25,654,035.35 | ||
| RHI | Red Hill Iron | 13 | 3 | 105 | 116 | 0.45 | $ 26,950,000.00 |
| CIA | Champion Iron | 11 | 5 | 99 | 284 | 5.88 | $ 2,831,935,164.96 |
| VMS | Venture Minerals | 11 | 11 | 88 | 567 | 0.063 | $ 79,240,000.00 |
| MGU | Magnum Mining & Exploration | 5 | 5 | 150 | 163 | 0.105 | $ 42,510,000.00 |
| MIN | Mineral Resources | 5 | 3 | 60 | 163 | 39.75 | $ 7,294,645,704.30 |
| ADY | Admiralty Resources | 4 | 33 | 41 | 500 | 0.024 | $ 26,660,098.08 |
| BCK | Brockman Mining | 3 | 3 | 32 | 83 | 0.033 | $ 306,200,000.00 |
| JMS | Jupiter Mines/ Juno Minerals | 3 | -7 | 20 | 44 | 0.32 | $ 607,730,000.00 |
| FMS | Flinders Mines | 2 | -20 | 13 | 104 | 1.27 | $ 217,814,664.33 |
| BHP | BHP | 2 | -5 | 26 | 51 | 46.01 | $ 213,120,000,000.00 |
| RIO | Rio Tinto | 2 | -5 | 18 | 27 | 112.82 | $ 166,460,000,000.00 |
| LCY | Legacy Iron Ore | 0 | 0 | 200 | 1400 | 0.015 | $ 96,071,077.76 |
| MGT | Magnetite Mines | 0 | 62 | 292 | 3315 | 0.047 | $ 137,251,808.02 |
| MGX | Mount Gibson Iron | 0 | -7 | 11 | 22 | 0.81 | $ 948,733,742.40 |
| RLC | Reedy Lagoon | 0 | 5 | 69 | 1000 | 0.023 | $ 11,880,000.00 |
| FMG | Fortescue Metals Group | 0 | -7 | 25 | 94 | 20.52 | $ 62,349,039,589.50 |
| TI1 | Tombador Iron | -1 | -3 | 218 | 218 | 0.067 | $ 69,442,639.49 |
| GEN | Genmin | -2 | 0.255 | $ 72,625,220.98 | |||
| SRK | Strike Resources | -3 | 11 | 77 | 457 | 0.195 | $ 49,426,853.60 |
| GRR | Grange Resources | -3 | -9 | 113 | 178 | 0.5 | $ 561,309,268.53 |
| GWR | GWR Group | -4 | -5 | 44 | 326 | 0.255 | $ 77,210,000.00 |
| FEX | Fenix Resources | -4 | -8 | 77 | 619 | 0.23 | $ 107,151,521.20 |
| ACS | Accent Resources | -5 | -5 | 800 | 1700 | 0.09 | $ 41,900,000.00 |
| SHH | Shree Minerals | -13 | 0 | 30 | 550 | 0.013 | $ 13,680,000.00 |
Recent ASX listee Akora Resources (ASX:AKO) owns a bunch of iron ore exploration projects in Madagascar.
Assays from its maiden drill program at the high grade (+65% fe) ‘Bekisopa’ project were due end of March, so should be released any day now.
Red Hill Iron (ASX:RHI) holds 40% of a large iron ore project in the Pilbara region of WA.
It is free-carried (doesn’t pay anything) until first production by JV partner API Management.
Canadian miner Champion Iron (ASX:CIA) surged after completing the acquisition of the high grade ‘Kamistiatusset’ iron ore project, which is close to the company’s operating Bloom Lake mine.
“This acquisition adds a large scale and highly prospective project to our portfolio,” Champion chief exec David Cataford says.
“In addition, by securing additional port capacity, this further de-risks our Bloom Lake Phase II expansion project, which is currently under construction.”
Scroll or swipe to reveal table. Click headings to sort. Best viewed on a laptop
| CODE | COMPANY | 1 WEEK CHANGE % | 1 MONTH CHANGE % | 6 MONTH CHANGE % | 1 YEAR CHANGE % | PRICE | MARKET CAP |
|---|---|---|---|---|---|---|---|
| MCM | MC Mining | 27 | 8 | 33 | -49 | 0.14 | $ 20,074,542.15 |
| AHQ | Allegiance Coal | 12 | 17 | 30 | 40 | 0.091 | $ 93,903,529.86 |
| LNY | Laneway Res | 10 | 10 | -21 | 83 | 0.055 | $ 18,875,329.67 |
| SMR | Stanmore Coal | 4 | 28 | 8 | -19 | 0.78 | $ 201,452,724.05 |
| CKA | Cokal | 3 | -3 | 24 | 134 | 0.068 | $ 63,796,179.60 |
| WHC | Whitehaven Coal | 2 | 9 | 66 | -11 | 1.8 | $ 1,770,984,857.88 |
| NHC | New Hope Corporation | 1 | 9 | 8 | -4 | 1.39 | $ 1,152,814,558.57 |
| NAE | New Age Exploration | 0 | 27 | 8 | 600 | 0.014 | $ 17,073,600.74 |
| PDZ | Prairie Mining | -2 | -7 | -15 | 58 | 0.205 | $ 46,812,793.25 |
| YAL | Yancoal Aust | -3 | -5 | 12 | 6 | 2.25 | $ 2,918,171,155.77 |
| BCB | Bowen Coal Limited | -3 | 23 | 3 | 49 | 0.064 | $ 60,605,584.77 |
| AKM | Aspire Mining | -3 | -3 | 22 | 57 | 0.094 | $ 48,225,513.58 |
| TER | Terracom | -3 | 1 | -41 | -23 | 0.085 | $ 60,288,610.40 |
| CRN | Coronado Global Res | -6 | -10 | -2 | -30 | 0.9 | $ 1,238,571,615.50 |
| NCZ | New Century Resource | -6 | -6 | 7 | 57 | 0.155 | $ 187,538,847.13 |
| MR1 | Montem Resources | -6 | -3 | -17 | 0.15 | $ 30,266,142.58 | |
| TIG | Tigers Realm Coal | -6 | 25 | 24 | -3 | 0.0075 | $ 98,000,267.76 |
| BRL | Bathurst Res . | -7 | -5 | 0 | -43 | 0.039 | $ 70,090,296.67 |
| PAK | Pacific American Hld | -9 | 0 | 0 | 45 | 0.02 | $ 7,646,037.60 |
| ATU | Atrum Coal | -21 | -77 | -80 | -68 | 0.058 | $ 31,989,740.92 |
| JAL | Jameson Resources | -21 | -5 | -21 | -27 | 0.095 | $ 28,816,529.55 |


Get the latest Stockhead news delivered free to your inbox.