Pic: Aleksandr Zubkov/Moment via Getty Images
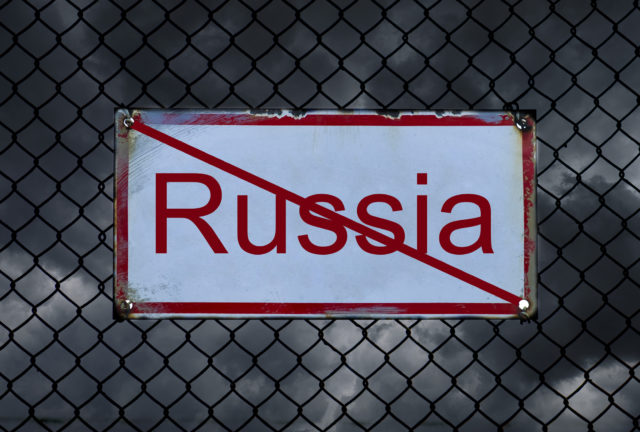
Bulk Buys: The Russian coal ban is here, and that could mean even more demand for Australian miners
Mining
Pic: Aleksandr Zubkov/Moment via Getty Images
Mining
Coal miners will be watching international markets closely tonight as a ban on Russian coal proposed by the European Commission back in April comes into effect.
Ever since Russia’s invasion of Ukraine, the frailty of European energy markets has been exposed, with the continent’s reliance on Russian oil, gas and coal sending prices skyrocketing for supplies from other major exporters like Australia.
While gas remains a testier issue, the August 10 date has been set in stone for a while, and Australian coal executives say it has already had an impact on pricing, supply and demand in the European coal market.
The EU confirmed the date for the embargo remained solid a few days ago, cutting imports of 8 billion Euros of Russian coal.
It could give support to some grades of met coal, particularly PCI, a type of steelmaking coal, of which Russia is a major supplier.
“To a large extent steel makers in Europe have already self imposed a ban on Russian coal but the market is 20-30% less that will be affected by this ban,” Coronado Global Resources CFO Gerhard Ziems said.
“And therefore, there will be more supply coming out of the market and it will have a positive impact on price in the near future, at least in the coming weeks.
“I suspect there’s a little bit of lag so we won’t see that effect straightaway on the 10th of August, but I guess it was probably in September.
“And remember Russia owns at least 30% of PCI and PCI prices go up overnight, we have heard PCI deals done at US$240 per ton. Now that’s $37 higher than premium low vol.”
The other area impacted by the ban will be thermal coal. While markets like India and China will still support Russian trade, Europe should be a no go.
The energy shortage has seen a unique situation emerge where thermal coal is commanding a significant premium over coking coal, something almost unheard of for a substantial length of time.
Coronado CEO Gerry Spindler told analysts yesterday the company, which owns coal mines across the US and Australia and has the catch phrase “Steel Starts Here”, has begun shifting sales of lower grade met coal to capture the premium on offer from European power plants.
The Russian ban could keep this situation going for some time, Ziems said.
“When you look at Russia, Russia exports 187 million tonnes of thermal coal into the market and that’s about 20% of global thermal coal.
“60 million tonnes go into the EU, UK and a little bit into Japan.
“That will not find its way — particularly the tonnes going into Europe and the UK — will not find its way into the Asian market simply because of infrastructure constraints.
“So that means we take probably just under 60 million tonnes of thermal coal out of the market, which means … the switching from met coal into thermal coal is probably here to stay for quite some time and we will take advantage of that.”
Coronado provided a preview of the embarrassment of riches to come for coal producers in this earnings season after announcing a 3000% rise in EBITDA to US$849m, 685% swing in NPAT from a US$96m loss in the 2021 half year to a US$562m profit and a US$125 dividend payout to shareholders.
Mega profits are likely from the established players, especially ones with large thermal coal production profiles like Whitehaven Coal (ASX:WHC), New Hope (ASX:NHC) and Yancoal (ASX:YAL), while even junior Terracom (ASX:TER) is expected to issue a 10c a share dividend after a watershed year at its Blair Athol mine in Queensland.
Newcastle 6000 kcal thermal coal was paying around US$361/t yesterday, down from recent highs above US$400/t, with coking coal futures at US$215/t.
Scroll or swipe to reveal table. Click headings to sort.
| CODE | COMPANY | PRICE | 1 WEEK RETURN % | 1 MONTH RETURN % | 6 MONTH RETURN % | 1 YEAR RETURN % | MARKET CAP |
|---|---|---|---|---|---|---|---|
| NAE | New Age Exploration | 0.007 | -13% | 17% | -53% | -42% | $ 10,051,292.37 |
| CKA | Cokal Ltd | 0.19 | 19% | 27% | 23% | 90% | $ 166,663,443.95 |
| NCZ | New Century Resource | 1.855 | 20% | 14% | -11% | -40% | $ 237,093,190.53 |
| BCB | Bowen Coal Limited | 0.275 | -10% | 22% | 41% | 231% | $ 439,775,950.92 |
| LNY | Laneway Res Ltd | 0.0045 | -10% | -10% | -6% | -15% | $ 31,510,082.05 |
| GRX | Greenx Metals Ltd | 0.25 | 2% | 35% | 14% | -8% | $ 63,405,116.00 |
| AKM | Aspire Mining Ltd | 0.088 | -1% | 10% | 9% | 17% | $ 46,194,965.64 |
| AVM | Advance Metals Ltd | 0.01 | -9% | 25% | -44% | -49% | $ 4,778,774.02 |
| AHQ | Allegiance Coal Ltd | 0.12 | 4% | -72% | -76% | -83% | $ 44,829,316.10 |
| YAL | Yancoal Aust Ltd | 4.98 | -11% | -3% | 75% | 135% | $ 6,615,401,579.37 |
| NHC | New Hope Corporation | 4.31 | -1% | 29% | 84% | 116% | $ 3,662,371,160.80 |
| TIG | Tigers Realm Coal | 0.016 | 0% | -11% | -16% | 100% | $ 222,133,940.26 |
| SMR | Stanmore Resources | 1.795 | -7% | -3% | 70% | 165% | $ 1,681,076,866.77 |
| WHC | Whitehaven Coal | 6.34 | 4% | 35% | 131% | 186% | $ 6,062,762,273.68 |
| BRL | Bathurst Res Ltd. | 1.005 | -4% | -2% | 31% | 52% | $ 195,186,975.60 |
| CRN | Coronado Global Res | 1.42 | 2% | -12% | 13% | 55% | $ 2,405,711,102.55 |
| JAL | Jameson Resources | 0.079 | 13% | 13% | 5% | -31% | $ 24,374,231.84 |
| TER | Terracom Ltd | 0.795 | 1% | 35% | 279% | 489% | $ 618,334,990.78 |
| ATU | Atrum Coal Ltd | 0.007 | 0% | 17% | -73% | -86% | $ 4,839,578.35 |
| MCM | Mc Mining Ltd | 0.235 | 81% | 88% | 135% | 96% | $ 43,484,071.40 |
In some good news for iron ore miners, steel margins which have weighed on China’s dominant steel industry are beginning to rebound, prompting a revival in production of rebar in the market that matters for iron ore.
Industry monitor MySteel says production among 137 mills tracked by the agency increased by 5.7%, up for a second week to 2.46Mt between July 28 and August 3.
It follows two months of rising capacity shutdowns in major steel centres like Tangshan on the back of falling profits and average margin losses for the industry, a situation that has aligned with weakness in iron ore prices.
The commodity has been trading in and around the US$110/t mark for a couple weeks now after dipping below US$100/t in mid-July.
Singapore 62% Fe futures were down 2.21% to US$109.21/t yesterday.
According to Commbank mining expert Vivek Dhar, margins for steelmakers in the Middle Kingdom averaged at a loss of between US$33-59/t in July, up from US$24-30/t in June. Still, China supported iron ore imports, which rose 3% on both the year and the month.
Dhar says China’s property market remains a concern.
“More than 300 residential projects under construction are facing mortgage boycotts as home‑owners lose faith that property developers will be able to complete projects,” he said.
“Credit concerns emerged as a key issue last year for property developers. With pre‑sold apartments such an important funding source for property developers, mortgage boycotts threaten to amplify the risk that projects under construction remain uncompleted.
“The year‑on‑year increase in China’s iron ore imports makes more sense. China’s iron ore demand fell sharply in H2 2021 as China looked to implement a nationwide reduction in steel production last year.
“While a similar policy is in place this year, the extent that China’s steel sector needs to reduce output is less onerous than the same time in 2021.”
Scroll or swipe to reveal table. Click headings to sort.
| CODE | COMPANY | PRICE | 1 WEEK RETURN % | 1 MONTH RETURN % | 6 MONTH RETURN % | 1 YEAR RETURN % | MARKET CAP |
|---|---|---|---|---|---|---|---|
| ACS | Accent Resources NL | 0.044 | -4% | -4% | -21% | -15% | $ 21,437,255.02 |
| ADY | Admiralty Resources. | 0.007 | -22% | -36% | -56% | -61% | $ 9,125,054.07 |
| AKO | Akora Resources | 0.16 | 0% | -18% | -58% | -33% | $ 10,095,511.04 |
| BCK | Brockman Mining Ltd | 0.03 | -9% | -21% | -53% | -21% | $ 287,687,196.06 |
| BHP | BHP Group Limited | 38.82 | -1% | -1% | -11% | -16% | $ 198,038,083,192.80 |
| CIA | Champion Iron Ltd | 5.13 | 3% | 2% | -27% | -23% | $ 2,575,621,767.48 |
| CZR | CZR Resources Ltd | 0.016 | 0% | -6% | 100% | 52% | $ 55,781,172.43 |
| DRE | Dreadnought Resources Ltd | 0.08 | 18% | 74% | 90% | 95% | $ 258,487,851.84 |
| EFE | Eastern Resources | 0.03 | 20% | 0% | -51% | 88% | $ 30,827,535.56 |
| CUF | Cufe Ltd | 0.02 | 5% | -9% | -52% | -74% | $ 18,839,191.12 |
| FEX | Fenix Resources Ltd | 0.295 | 4% | 0% | 11% | -13% | $ 161,133,106.40 |
| FMG | Fortescue Metals Grp | 18.95 | 4% | 10% | -15% | -18% | $ 58,377,174,845.28 |
| FMS | Flinders Mines Ltd | 0.5 | -6% | 19% | -4% | -45% | $ 83,580,045.62 |
| GEN | Genmin | 0.255 | 2% | 16% | 16% | 34% | $ 67,989,084.00 |
| GRR | Grange Resources. | 1.2 | 4% | 2% | 38% | 88% | $ 1,388,806,437.60 |
| GWR | GWR Group Ltd | 0.093 | -2% | -23% | -44% | -68% | $ 29,230,715.61 |
| HAV | Havilah Resources | 0.27 | 2% | 10% | 38% | 32% | $ 88,647,778.80 |
| HAW | Hawthorn Resources | 0.085 | -3% | 5% | -6% | 85% | $ 30,016,405.17 |
| HIO | Hawsons Iron Ltd | 0.335 | 2% | -27% | 49% | 109% | $ 244,547,473.50 |
| IRD | Iron Road Ltd | 0.145 | 4% | 0% | -24% | -40% | $ 111,858,782.56 |
| JNO | Juno | 0.13 | 4% | -4% | 4% | -33% | $ 18,313,830.14 |
| LCY | Legacy Iron Ore | 0.02 | -5% | 11% | 5% | 25% | $ 128,136,523.98 |
| MAG | Magmatic Resrce Ltd | 0.079 | 16% | 7% | -13% | -39% | $ 19,086,509.85 |
| MDX | Mindax Limited | 0.059 | 0% | 0% | 37% | 28% | $ 113,984,913.12 |
| MGT | Magnetite Mines | 0.026 | 4% | 24% | -31% | -29% | $ 102,377,625.46 |
| MGU | Magnum Mining & Exp | 0.042 | 0% | 0% | -47% | -66% | $ 22,385,616.37 |
| MGX | Mount Gibson Iron | 0.505 | -1% | 0% | 11% | -36% | $ 629,495,377.16 |
| MIN | Mineral Resources. | 59.93 | 11% | 28% | 4% | 2% | $ 10,962,527,622.68 |
| MIO | Macarthur Minerals | 0.17 | -8% | -21% | -51% | -72% | $ 26,606,825.52 |
| PFE | Panteraminerals | 0.13 | 4% | 4% | -38% | -64% | $ 7,070,000.00 |
| PLG | Pearlgullironlimited | 0.04 | -5% | -20% | -38% | 0% | $ 2,250,994.63 |
| RHI | Red Hill Iron | 3.46 | 5% | 2% | 23% | 10% | $ 224,675,084.48 |
| RIO | Rio Tinto Limited | 99.39 | 0% | 2% | -15% | -24% | $ 36,961,998,427.98 |
| RLC | Reedy Lagoon Corp. | 0.016 | 14% | -20% | -50% | -11% | $ 9,476,257.50 |
| SHH | Shree Minerals Ltd | 0.0085 | 6% | 6% | -65% | -35% | $ 9,907,895.14 |
| SRK | Strike Resources | 0.135 | 4% | 23% | 4% | -46% | $ 35,100,000.00 |
| SRN | Surefire Rescs NL | 0.018 | 6% | -22% | 29% | 20% | $ 28,464,542.59 |
| TI1 | Tombador Iron | 0.029 | 21% | 16% | -34% | -57% | $ 30,302,784.13 |
| TLM | Talisman Mining | 0.155 | -3% | 11% | -11% | -26% | $ 28,160,924.55 |
| VMS | Venture Minerals | 0.029 | 4% | -9% | -34% | -72% | $ 48,646,270.17 |
| EQN | Equinoxresources | 0.125 | -7% | -11% | -43% | 0% | $ 6,750,000.15 |


Get the latest Stockhead news delivered free to your inbox.