
Mining
Rio Results: Rio falls short of expectations on iron ore and copper in March quarter, but says 2024 is on track

Mining
Bulk Buys: Wet weather keeps iron ore exports in check and From Russia with a Shove

Mining
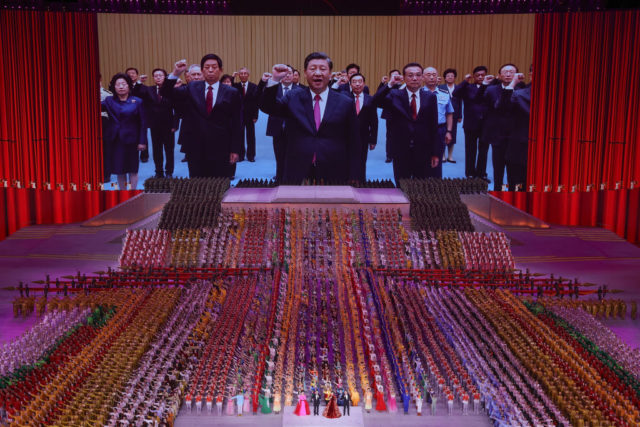
Pic: Lintao Zhang/Getty Images.
Mining
The iron ore market does not offer the simple narrative that it did in the first two decades of the 21st century nor that of the suite of “green metals” like lithium, nickel and copper now hitched to electric vehicle sales and efforts to make the world greener.
We need iron ore to make the steel for all this infrastructure, but it is also one of the world’s most polluting industries.
China walks a tightrope between artificially stimulating economic growth to ensure the happiness and compliance of its people and artificially curbing it to contain pollution and CO2 emissions – up to 8% of which are made in the world’s steel mills.
It is also a vastly different country under Xi Jinping than it was in its growth phase under former Premier Hu Jintao.
The two spent the first part of the century smoothing diplomatic ties until locked in a symbiotic if uncomfortable fiscal embrace.
The Communist Party is now able to wield its cultural and economic power to throw hissy fits when lug-headed Australian officials upset it.
That led to China banning coal, wine and lobster imports among a host of things it can get elsewhere amid a spat over the blame for the Covid-19 pandemic in 2020.
Iron ore and other metals to a large degree are different though. China needs so much it is, unhappily at times, entwined with Australian miners, who ship along a virtual maritime conveyor belt around 900Mtpa of the stuff — 60% of the seaborne market and 80% of it to their Chinese mates.
It means Rio Tinto is extremely reliant on Chinese prosperity for its own good fortunes, as it enjoyed early last year.
And the Pilbara miner is striking an upbeat tone when it comes to China’s conflict between its economic and environmental impulses.
“China is transitioning from tightening to easing policies following a slowdown in the last quarter of 2021, with mild pro-growth measures in place to support property, infrastructure and consumption,” Rio said in its quarterly production report yesterday.
“We expect China to continue to fine tune its policies to balance multiple priorities.”
Despite its first contraction in several years, crude steel output in China was produced at its second highest annual rate ever in 2021, only 32Mt below the record of 1.065Bt set in 2020.
Rio is bullish on the outlook both outside and within the Middle Kingdom, where a dramatic economic slowdown through the second half of last year that caused iron ore prices to fall from a record high of US$237/t to a 12-month low of US$87/t sent shudders through the iron ore market.
“China’s crude steel production and iron ore imports were stable year on year, with steel production exceeding 1 billion tonnes for a second time, despite numerous steel mill operating restrictions and a slowing property sector,” Rio said.
“Steel consumption and production rates in China decelerated significantly during the fourth quarter of 2021, however, iron ore seaborne supply improved, resulting in a ~30% decline in iron ore prices in the fourth quarter versus the prior quarter.
“Meanwhile, the steel and iron ore demand recovery in developed and other emerging economies maintained its momentum and
global crude steel production grew by an estimated 6% year on year – by one of its largest absolute annual increments in history – to a record total of almost 2 billion tonnes in 2021.”
Speculation about a recovery in steel output late in the March quarter has sent benchmark 62% iron ore fines back to healthier levels of US$125.65/t on Monday according to Fastmarkets MB.
However, more nerves appear to be setting about in the state of the Chinese economy as China cut its credit rate to stimulate investment and Xi made a strange plea to the Western world to avoid interest rate rises in economies currently seeing decades high levels of inflation.
The Winter Olympics in Beijing is viewed by iron ore bulls as the finish line at which China will release the shackles and allow steel mills to operate with greater freedom once the world’s eyes are no longer on its often polluted skies.
In December there was a mild turnaround, with China’s steel output rising around 20% month on month to 86.2Mt after hitting multi-year lows in November.
Commbank analyst Vivek Dhar said it was the best result since July last year.
“The increase was significant and confirmed reports that a number of mills had started to increase production in December because they had met steel output cuts by November,” he said in a note.
“China’s daily crude steel output collapsed through most of H2 2021 due to strict policy objectives to lower crude steel output in the second half of 2021.
“The main motivation behind the steel output cuts was to reduce emissions. China’s steel sector accounts for ~15% of China’s carbon emissions, and reducing output is the quickest and most economical way for China to reduce steel-related emissions in the short term.”
The swing is an indication mill margins and demand are improving, but the Chinese property sector is still hobbling.
“The rise in steel output and margins last month suggests that steel demand has improved too,” Dhar said.
“We think that mostly reflects infrastructure projects (~30% of China’s steel demand).
“Steel demand from China’s property construction sector, which also accounts for ~30% of China’s steel demand, was still subdued. Partial volume indicators of China’s property sector worsened last month.”
The sharp rise in prices to start 2022, which has seen far higher levels than late 2021 despite a recent three-day fall, has prompted analysts to adjust their expectations up.
RBC this week amended its iron ore forecast for the first half of 2022 to US$122/t (second half US$75/t) to bring its year average up from US$75/t to US$99/t. Goldman Sachs is more constructive, estimating prices will average US$110/t in 2022 and US$125/t in the June quarter after the Olympics restrictions unwind.
Does that mean Rio, which has suffered a succession of production downgrades in recent years, will again be salvaged by high prices?
After falling short of its initial guidance of 325-345Mt, Rio was able to bump up its output to 84.1Mt in the December Quarter to cross the finish line with 321.6Mt.
That was within its new 320-325Mt guidance range set in the back half of 2021, but required a big increase in sales of its lower quality SP10 product to drag across the line.
It was a similar story for other commodities, with Rio suffering output drops across copper, mineral sands, aluminium, bauxite, alumina and its pellet iron ore business in Canada.
The ramp up of its 43Mtpa Gudai-Darri mine has been delayed to the second quarter of 2022 amid labour and supply chain issues which could improve when the WA border opens on February 5 or get worse as Covid outbreaks run through workforces.
Rio has modest aims to increase production to as much as 335Mt at the upper end of its 2022 guidance, but could produce as little as 320Mt.
It is a far cry from the company’s stated aim of producing 345-360Mt from its Pilbara operations but unsurprisingly given Rio’s struggle to expand in recent years.
“Rio Tinto’s operations continue to meander and mine capacity issues in iron ore are likely to weigh again in 2022, albeit on an already reduced forecast production profile,” RBC’s Kaan Peker said.
“Although iron ore prices have provided the shares some solace in recent weeks, we continue to see a challenging outlook for iron ore over the course of 2022.
“Like all miners, the current value trade provides a benefit, and we believe the balance sheet remains in exceptional shape. But beyond this, with wider strategic questions and unresolved situations in Mongolia, Serbia and Guinea, we continue to prefer BHP.”
On the flip side, Rio has confirmed work portion of the massive Simandou development in Guinea is ticking along, with an EoI out for early works on the multi-billion dollar mine, the other half of which is being built by a Chinese-backed consortium.
Drilling is also due to take place this year, but it remains to be seen whether the high-grade development will be feasible given the enormous rumoured price tag of as much as US$20 billion which saw Rio dump plans to build Simandou almost a decade ago.
Rio shares fell almost 0.5% yesterday but are up 9.9%YTD on the back of the run in iron ore prices.
Futures on both the Dalian exchange and Singapore exchange were off slightly.
Fellow Pilbara giant BHP (ASX:BHP) will report its December performance today.
Fortescue Metals Group (ASX:FMG) and Mineral Resources (ASX:MIN) will report next Wednesday while Canadian high grade miner Champion Iron (ASX:CIA) will report at 12.30am Sydney time on Saturday January 28 if you feel like staying up for it.
Scroll or swipe to reveal table. Click headings to sort.
| CODE | COMPANY | PRICE | 1 WEEK RETURN % | 1 MONTH RETURN % | 6 MONTH RETURN % | 1 YEAR RETURN % | MARKET CAP |
|---|---|---|---|---|---|---|---|
| ACS | Accent Resources NL | 0.054 | 0% | -2% | 6% | 170% | $ 25,165,473.28 |
| ADY | Admiralty Resources. | 0.014 | 8% | 0% | -30% | 0% | $ 18,250,108.14 |
| AKO | Akora Resources | 0.26 | 8% | 33% | -4% | -32% | $ 13,609,298.56 |
| BCK | Brockman Mining Ltd | 0.048 | -6% | -13% | 30% | -14% | $ 482,520,070.81 |
| BHP | BHP Group Limited | 46.7 | 4% | 13% | -10% | 0% | $ 136,154,101,833.10 |
| CIA | Champion Iron Ltd | 6.4 | 8% | 29% | -8% | 20% | $ 3,185,833,900.04 |
| CZR | CZR Resources Ltd | 0.009 | 13% | 20% | -22% | -44% | $ 31,376,909.49 |
| DRE | Drednought Resources | 0.041 | 3% | 8% | 5% | 71% | $ 117,743,117.37 |
| EFE | Eastern Resources | 0.074 | 28% | 32% | 335% | 621% | $ 71,994,616.23 |
| CUF | Cufe Ltd | 0.037 | -8% | 12% | -60% | -20% | $ 37,844,494.60 |
| FEX | Fenix Resources Ltd | 0.295 | 4% | 28% | -33% | 5% | $ 143,130,967.20 |
| FMG | Fortescue Metals Grp | 20.75 | 1% | 9% | -20% | -18% | $ 63,950,101,346.86 |
| FMS | Flinders Mines Ltd | 0.54 | -6% | 2% | -47% | -45% | $ 89,489,745.81 |
| GEN | Genmin | 0.235 | 0% | 12% | 15% | 0% | $ 66,337,644.75 |
| GRR | Grange Resources. | 0.82 | -2% | 22% | 12% | 200% | $ 960,591,119.34 |
| GWR | GWR Group Ltd | 0.185 | -16% | 54% | -55% | -55% | $ 57,678,223.24 |
| HAV | Havilah Resources | 0.19 | 6% | 19% | -16% | -7% | $ 60,412,317.62 |
| HAW | Hawthorn Resources | 0.105 | 5% | 25% | 110% | -5% | $ 35,019,139.37 |
| HIO | Hawsons Iron Ltd | 0.22 | -2% | 52% | 33% | 322% | $ 171,612,708.00 |
| IRD | Iron Road Ltd | 0.195 | 0% | -3% | -29% | 3% | $ 151,146,532.35 |
| JNO | Juno | 0.12 | 4% | 0% | -47% | 0% | $ 16,278,960.12 |
| LCY | Legacy Iron Ore | 0.023 | -8% | 0% | 44% | -41% | $ 147,357,002.58 |
| MAG | Magmatic Resrce Ltd | 0.098 | 1% | -2% | -35% | -41% | $ 25,448,679.80 |
| MDX | Mindax Limited | 0.035 | 3% | -13% | -51% | 1067% | $ 66,672,752.13 |
| MGT | Magnetite Mines | 0.037 | 12% | 32% | -14% | 164% | $ 119,728,381.48 |
| MGU | Magnum Mining & Exp | 0.105 | 13% | 22% | -40% | 67% | $ 49,714,491.40 |
| MGX | Mount Gibson Iron | 0.455 | 2% | 20% | -52% | -54% | $ 544,755,614.85 |
| MIN | Mineral Resources. | 64.35 | 6% | 30% | 7% | 62% | $ 12,269,598,208.67 |
| MIO | Macarthur Minerals | 0.355 | 4% | -4% | -38% | -28% | $ 51,524,997.14 |
| PFE | Panteraminerals | 0.21 | 5% | 8% | 0% | 0% | $ 8,570,000.00 |
| PLG | Pearlgullironlimited | 0.077 | 5% | 5% | 0% | 0% | $ 4,041,444.68 |
| RHI | Red Hill Iron | 3.23 | -5% | 4% | 280% | 1094% | $ 203,611,795.31 |
| RIO | Rio Tinto Limited | 109.65 | 3% | 12% | -16% | -9% | $ 40,844,920,026.42 |
| RLC | Reedy Lagoon Corp. | 0.043 | 16% | 48% | 153% | 153% | $ 24,105,718.12 |
| SHH | Shree Minerals Ltd | 0.015 | 50% | 67% | 0% | -35% | $ 18,075,027.16 |
| SRK | Strike Resources | 0.14 | 0% | 40% | -55% | -33% | $ 40,500,000.00 |
| SRN | Surefire Rescs NL | 0.011 | -8% | 0% | -21% | -58% | $ 12,147,414.50 |
| TI1 | Tombador Iron | 0.044 | 22% | 22% | -53% | -40% | $ 52,543,665.89 |
| TLM | Talisman Mining | 0.165 | -7% | 3% | -8% | 70% | $ 31,915,714.49 |
| VMS | Venture Minerals | 0.046 | -2% | 21% | -63% | -30% | $ 78,488,006.82 |
| EQN | Equinoxresources | 0.245 | 23% | 23% | 0% | 0% | $ 11,025,000.25 |
Despite the relaxation of a ban on exports from the world’s biggest thermal coal exporter Indonesia, prices continue to tick up amid uncertainty over when it will be fully unwound.
While the proportion of Indonesian coal required to be supplied to local power companies is relatively low, the motivation of miners to do so is lower because of US$70/t price caps on their domestic sales.
With energy provider PLN’s stocks looking healthier last week, 34 ships were given the OK to leave.
But there remains uncertainty about how long restrictions will last, driving up interest in Australian coal futures.
“Coal prices in Asia edged higher as the market waits for further clarity on Indonesia’s coal export ban,” ANZ’s Adelaide Timbrell said yesterday.
“Authorities released 34 ships last week and are considering approving another 22 this week, despite the ban remaining in place.
“Newcastle futures pushed above USD$220/t amid the uncertainty. European prices were also stronger, after France is forced to shut several nuclear power plants for unplanned maintenance.”
Coking coal prices are also circling record highs, with premium hard coking coal FOB Dalrymple Bay Coal Terminal worth US$413.60/t Monday according to Fastmarkets MB.
Queensland and South African thermal coal producer Terracom (ASX:TER) is one of many companies who have ridden the wave of higher prices.
Yesterday the company revealed it had generated $24.5 million of operating EBITDA at its operations in the month of December, including $19.8m from its Blair Athol mine in Queensland.
Its Australian unit made $118.50 on each tonne sold in December, up from $24/t in the June quarter last year.
Terracom made EBITDA in the month of November of $31.9m, but a delayed cargo and weaker performance from its South African operations resulted in lower revenue.
It sold 502,000t at an average price of $219/t in the three months to New Year’s Eve.
Scroll or swipe to reveal table. Click headings to sort.
| CODE | COMPANY | PRICE | 1 WEEK RETURN % | 1 MONTH RETURN % | 6 MONTH RETURN % | 1 YEAR RETURN % | MARKET CAP |
|---|---|---|---|---|---|---|---|
| NAE | New Age Exploration | 0.017 | 31% | 70% | 31% | 21% | $ 22,974,382.56 |
| CKA | Cokal Ltd | 0.16 | 7% | 14% | 111% | 90% | $ 150,231,836.80 |
| NCZ | New Century Resource | 2.74 | 25% | 41% | -19% | -24% | $ 327,476,782.50 |
| BCB | Bowen Coal Limited | 0.175 | -3% | 13% | 163% | 289% | $ 229,752,449.33 |
| LNY | Laneway Res Ltd | 0.007 | 0% | 17% | 17% | 0% | $ 29,981,461.53 |
| GRX | Greenx Metals Ltd | 0.255 | 9% | 24% | 17% | -8% | $ 60,142,123.32 |
| AKM | Aspire Mining Ltd | 0.087 | 1% | 12% | 19% | -17% | $ 44,164,417.70 |
| PAK | Pacific American Hld | 0.018 | 13% | 6% | 13% | -23% | $ 8,601,793.24 |
| AHQ | Allegiance Coal Ltd | 0.51 | 2% | 6% | -28% | 38% | $ 198,808,271.40 |
| YAL | Yancoal Aust Ltd | 3.03 | 6% | 19% | 41% | 19% | $ 3,908,500,733.52 |
| NHC | New Hope Corporation | 2.41 | 4% | 13% | 28% | 56% | $ 1,997,656,996.80 |
| TIG | Tigers Realm Coal | 0.02 | -9% | -5% | 122% | 122% | $ 313,600,856.83 |
| SMR | Stanmore Resources | 1.135 | 1% | 11% | 67% | 33% | $ 304,207,133.63 |
| WHC | Whitehaven Coal | 2.87 | -1% | 14% | 33% | 61% | $ 3,015,321,157.44 |
| BRL | Bathurst Res Ltd. | 0.8 | 1% | 12% | 1% | 48% | $ 140,180,330.86 |
| CRN | Coronado Global Res | 1.4 | 4% | 18% | 52% | 17% | $ 2,288,359,341.45 |
| JAL | Jameson Resources | 0.071 | -3% | 6% | -29% | -35% | $ 24,325,849.96 |
| TER | Terracom Ltd | 0.2 | 5% | 8% | 43% | 21% | $ 139,417,411.55 |
| ATU | Atrum Coal Ltd | 0.032 | -3% | 19% | -50% | -88% | $ 19,944,411.74 |
| MCM | Mc Mining Ltd | 0.08 | -15% | -11% | -30% | -53% | $ 12,353,564.40 |
Mining
Mining
Mining


Get the latest Stockhead news delivered free to your inbox.