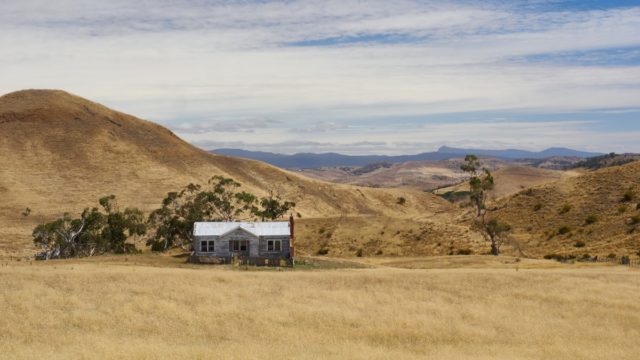
Cottage, Central Highlands of Tasmania in summer. Via Lesley McEwan/Getty
Everything you need to know about Aussie property right now in attractive dot point form with 10 stunning visuals
News
Cottage, Central Highlands of Tasmania in summer. Via Lesley McEwan/Getty
News
If you weren’t absolutely certain that residential property is the anchor holding this country to the economic bedrock, here’s some numbers from the frightening team at CoreLogic which some male readers are certain to correlate with an unpleasant tugging sensation in the region around the epididymis most sensitive to fright, shock and fear…
No really, I’ve been working on this since last night and frankly, mine is still clinging to the upper respiratory tract like a frightened sugar glider on a eucalyptus branch.
On a bleak and rainy Tuesday July 5 afternoon in Sydney, just as the rivers and dams out west were giving way to more rising floodwaters, the top minds at the Reserve Bank of Australia (RBA) were meeting again in a half-lit, smoke-filled boardroom, some 17 floors beneath Martin Place, where they decided to lift the cash rate a further 50 basis points to 1.35%. This takes the cumulative hike since May to 125bps.
Across a worried nation, the fragile household sector remains a key source of uncertainty.
And residential property: a useful proxy for the wider economy and a weathervane for confidence and spending as high prices, higher inflation are (hopefully) chased down by higher interest rates.
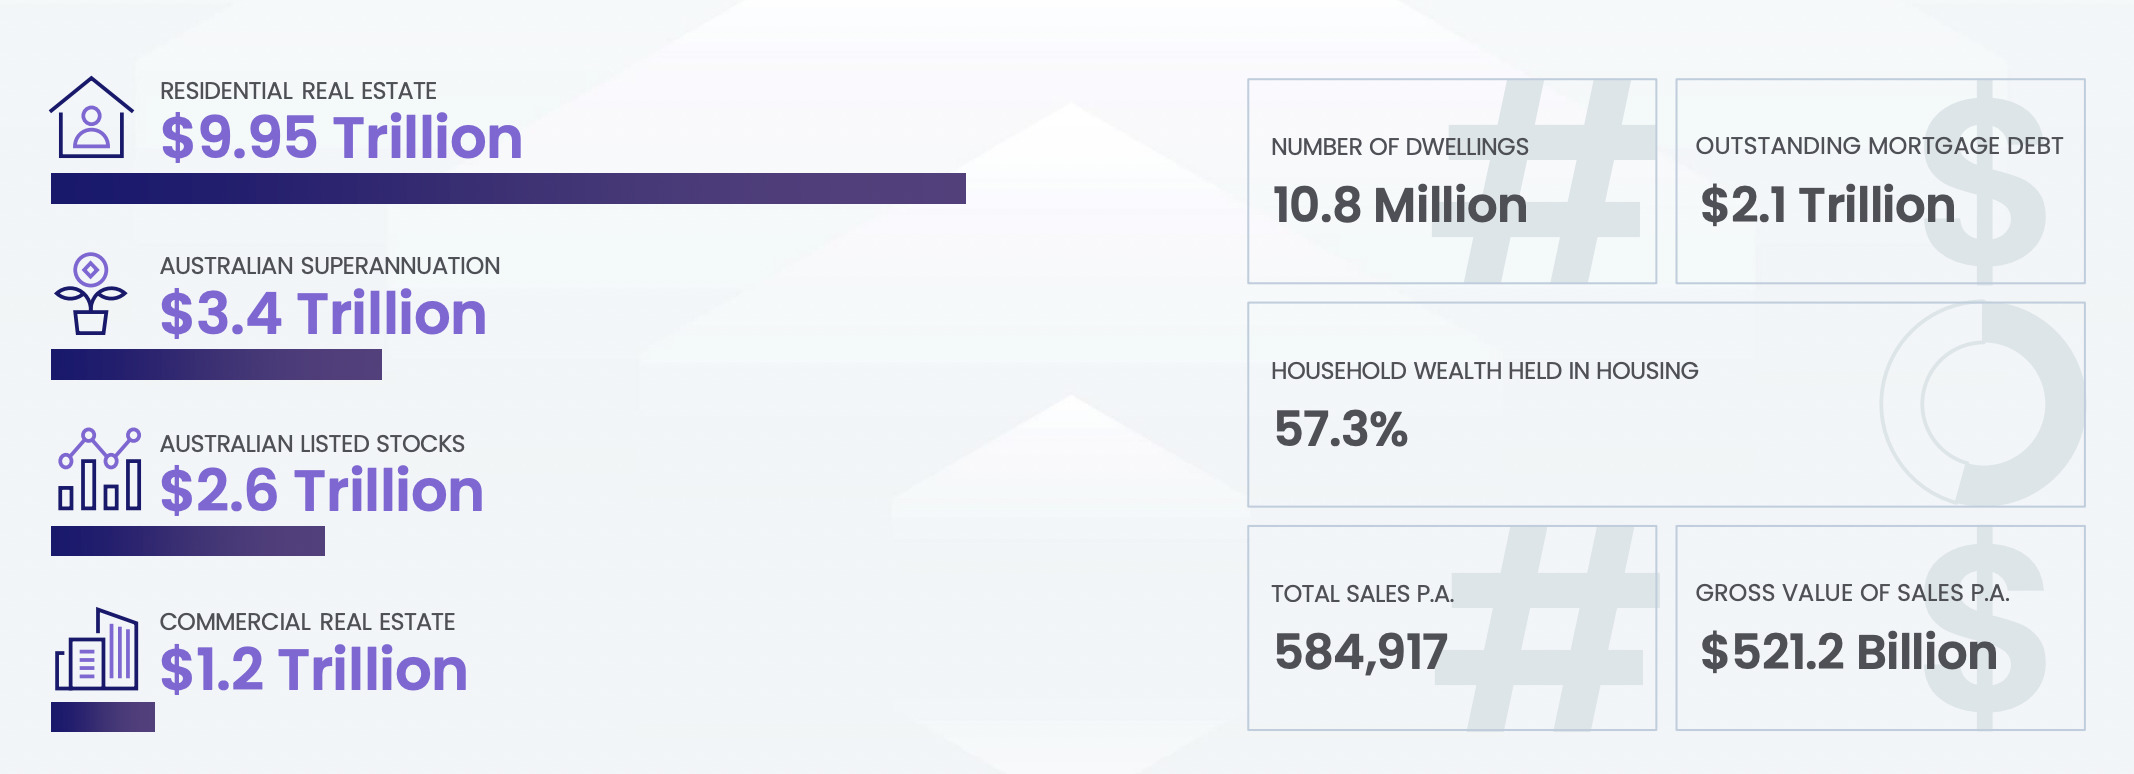
► The total value of Australian residential real estate was $9.95 trillion at the end of June.
► Total value ASX listed stocks was $2.6 trillion.
► 57.3% of total Aussie household wealth held in resi-prop.
► ABS says total household wealth increased 1.2% ($173b) in the March quarter to a record $14.9 trillion.
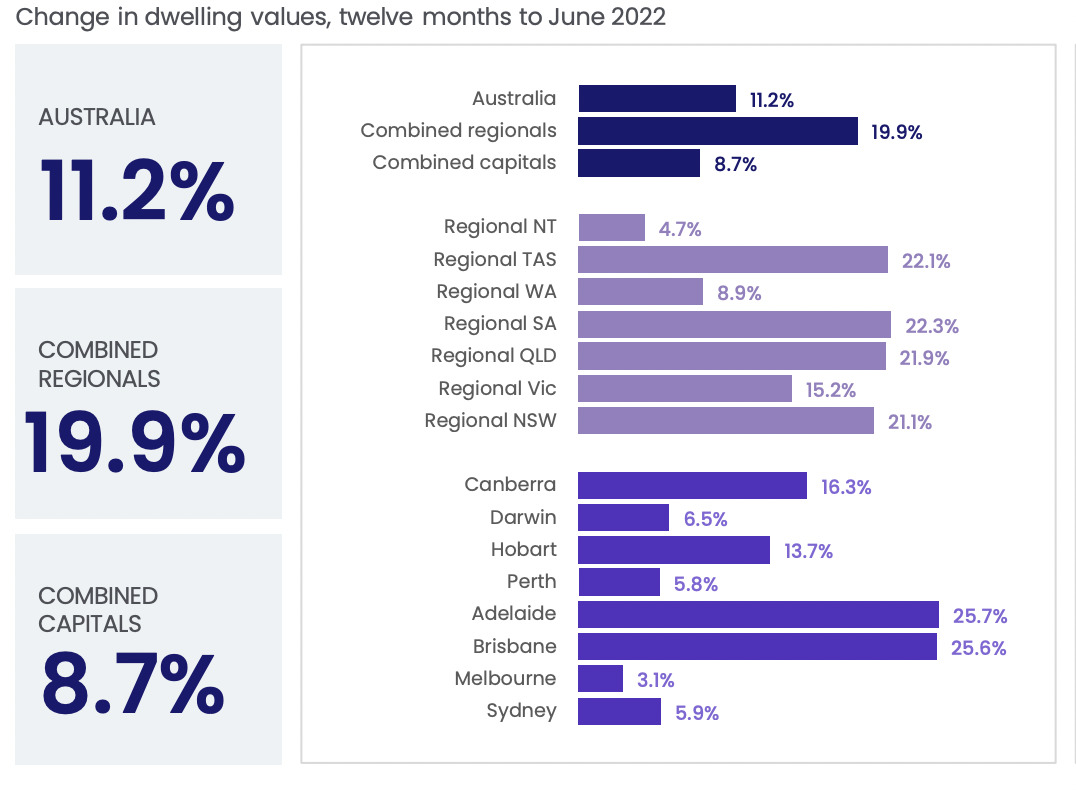
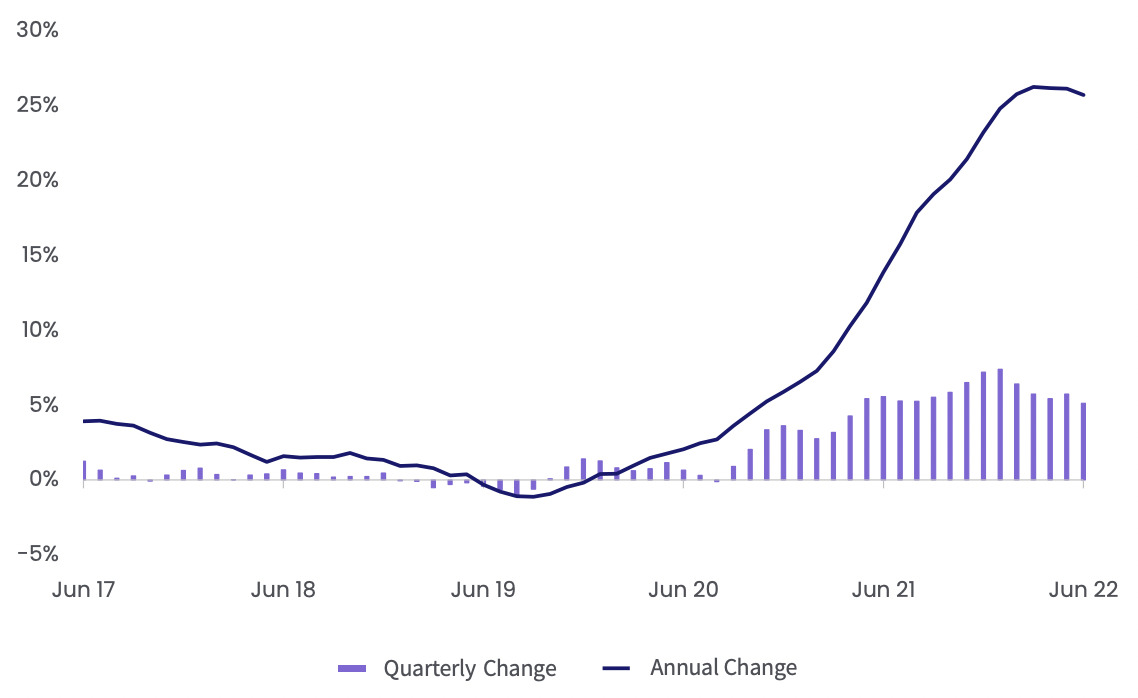
► Dwelling values in Australia are 11.2% higher over the past 12 months.
► That’s down from a cyclical peak of 22.4% in the 12 months to January 2022.
► Combined regional dwelling values – still pretty nuts – up almost 20%, year to June.
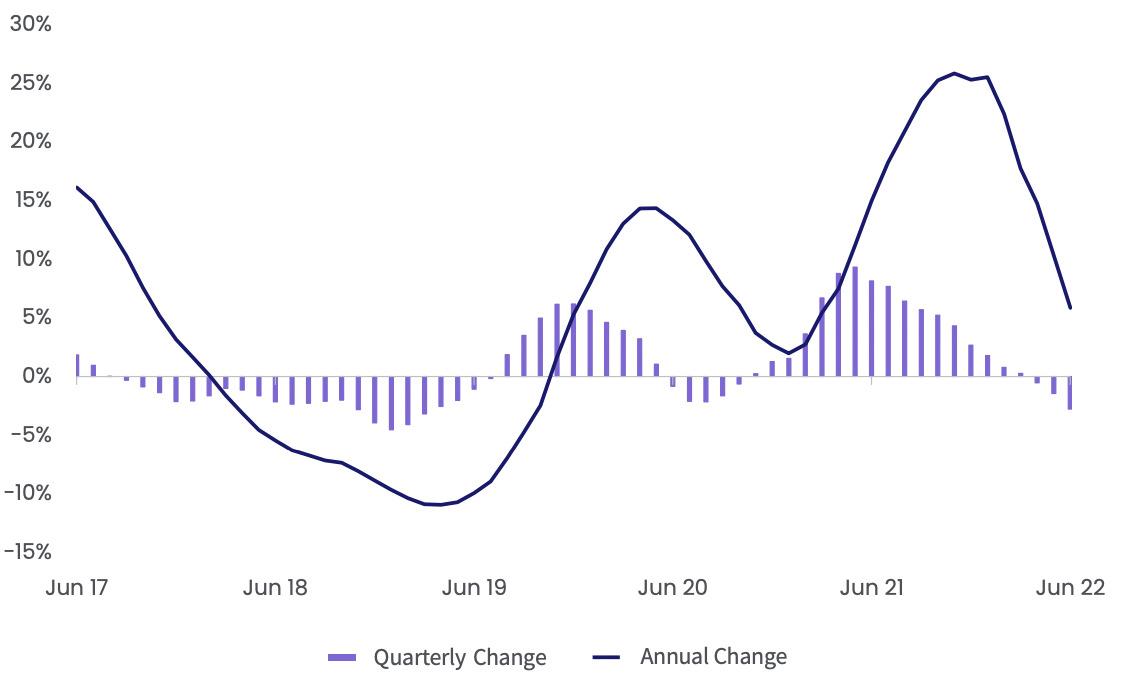
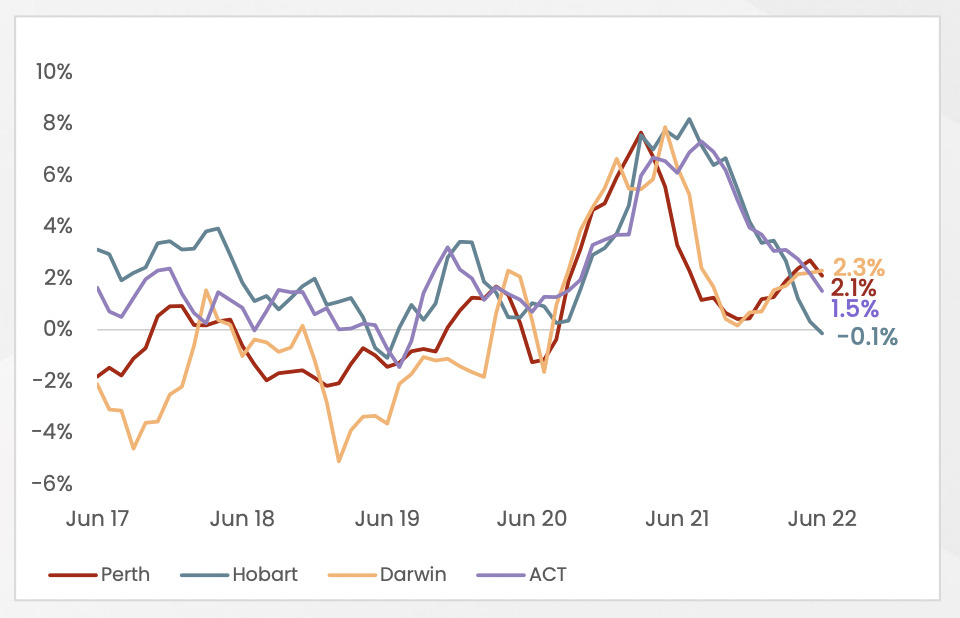
► Regional Tasmania is the hands down runner-up for rising prices over the last year at 22.1% growth.
► Well done Tassie, you volatile isle of volatile house prices, bought and occupied by volatile but not unlovely people.
► Take a bow then regional South Australia, highest growth, up 22.3%.
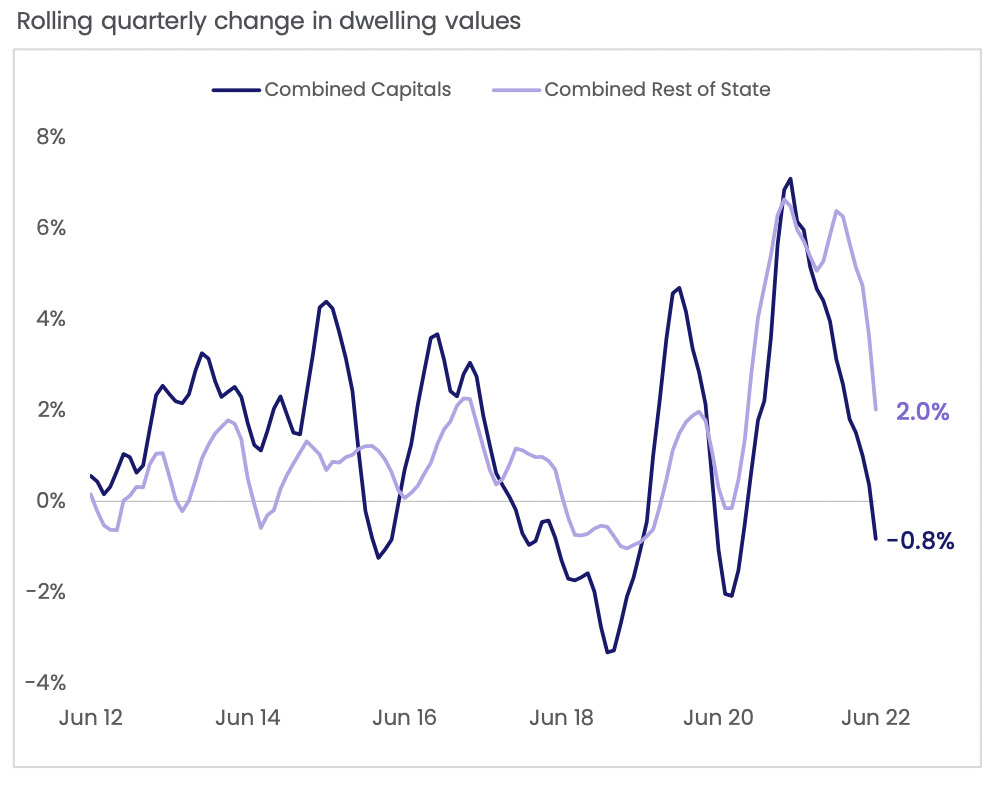
► In the three months to June, the change in capital city dwelling values went down.
► Yeah. It totally dropped -0.8%.
► Meanwhile in the country (them regional markets), things still kept rising, up 2% over the same time.
►Take a bow regional Australia for just making everything that much harder.
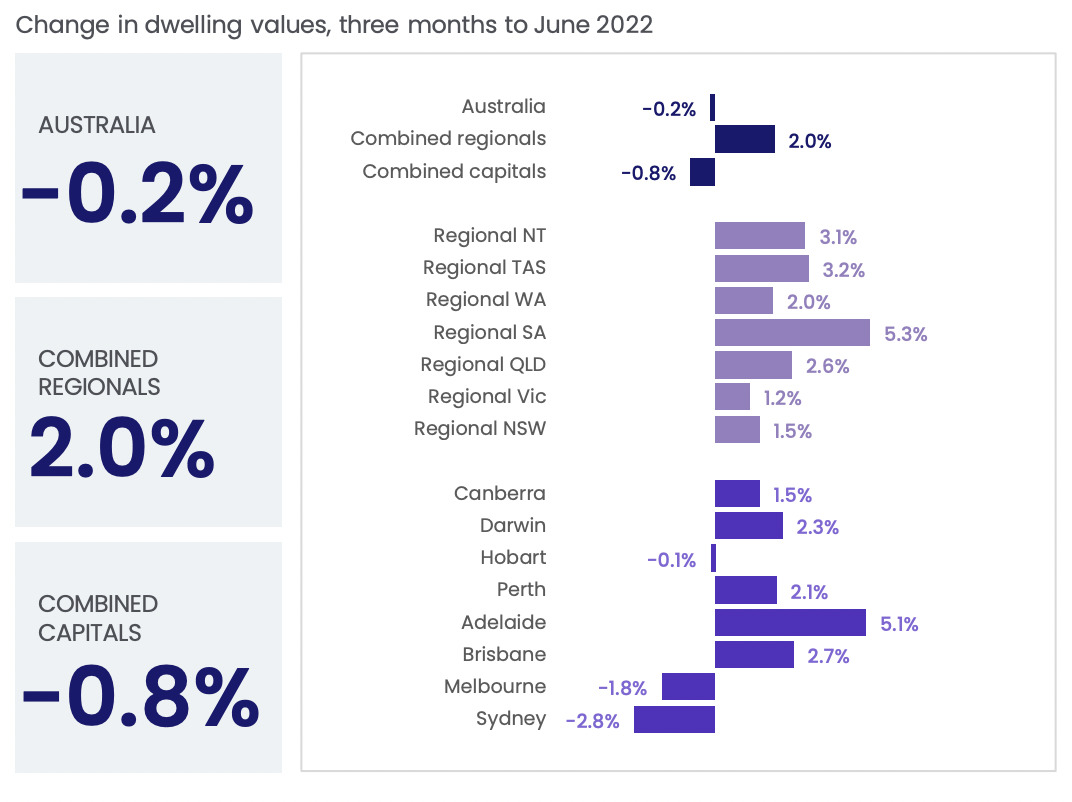
► Conditions are heaps diversified, but CoreLogic says every capital city has moved through a peak rate of growth over the last quarter.
► But that doesn’t mean markets are behaving themselves.
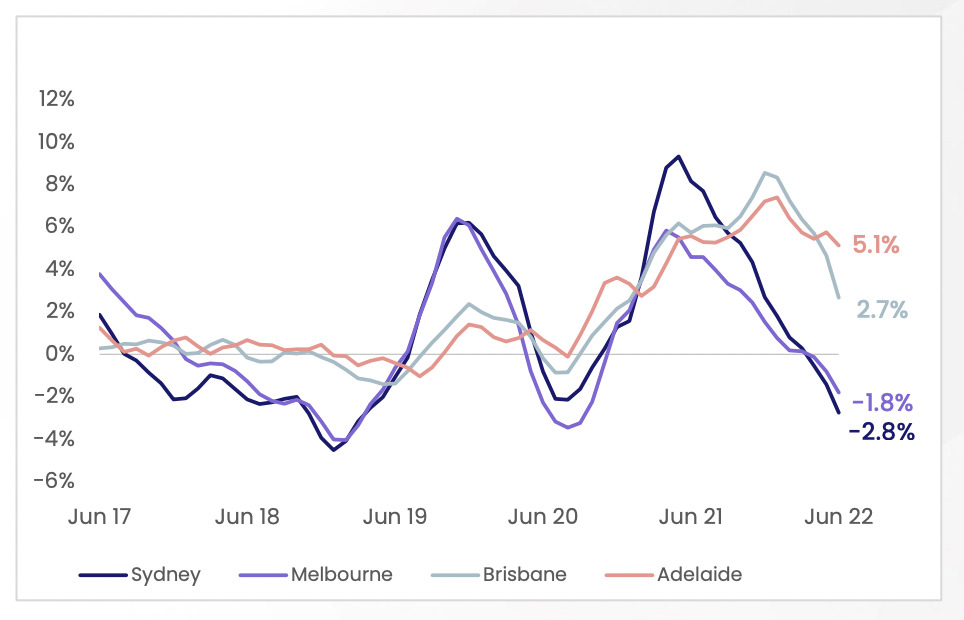
► Check out the growth in South Australia and its funny little capital city. Probs avoid Rundle Mall though.
► Capital city growth over the quarter ranged from…
► Down to a quarterly retraction of…
► Year to June CoreLogic clocked 584,917 sales, up 3.2% compared to previous.
► That’s a supply/demand thing
► June quarter sales estimates are -15.9% lower than the same quarter of the previous year.

► At the national level, properties are taking longer to sell.
► That’s also a supply/demand thing
►In the three months to June, the average days on market hit 30, up from the recent lows of 20 days.
► Because the math here is gentle, I’m pleased to report the median days for a property on market has elongated by 33%.
► In the month to July 4, CoreLogic ID’d 37,708 dwellings listed for sale, nationally.
► That’s a new thing.
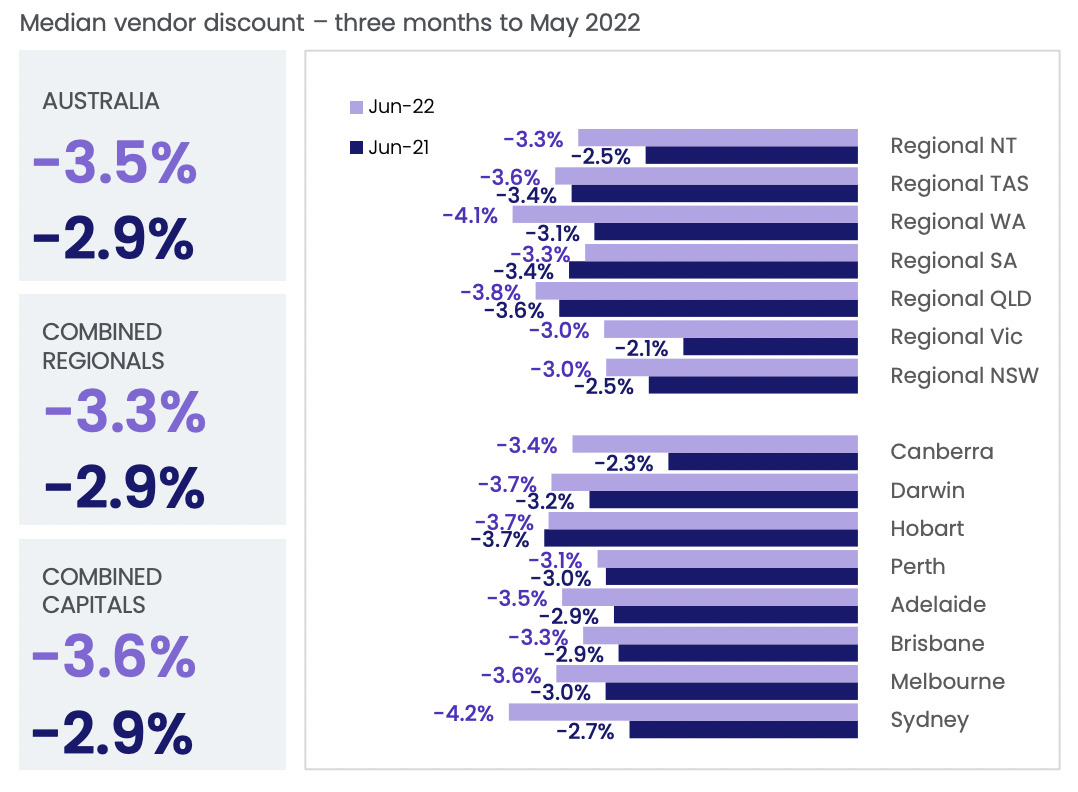
► Getting a property seller to discount in Sydney is usually like trying to get blood out of a property seller in Sydney.
► It means the market is shifting from sellers, to buyers.
► Soon my pretties, soon…
► Check it out, in Sydney last June the median haggle room was 2.7%, this year so far it’s 4.2%.
► Okay it’s not an astonishing number (it looks more effective below), but the crack is widening – it’s all about the direction the crack is moving.
► In the three months to June, the average vendor discount across the nation was 3.5%.
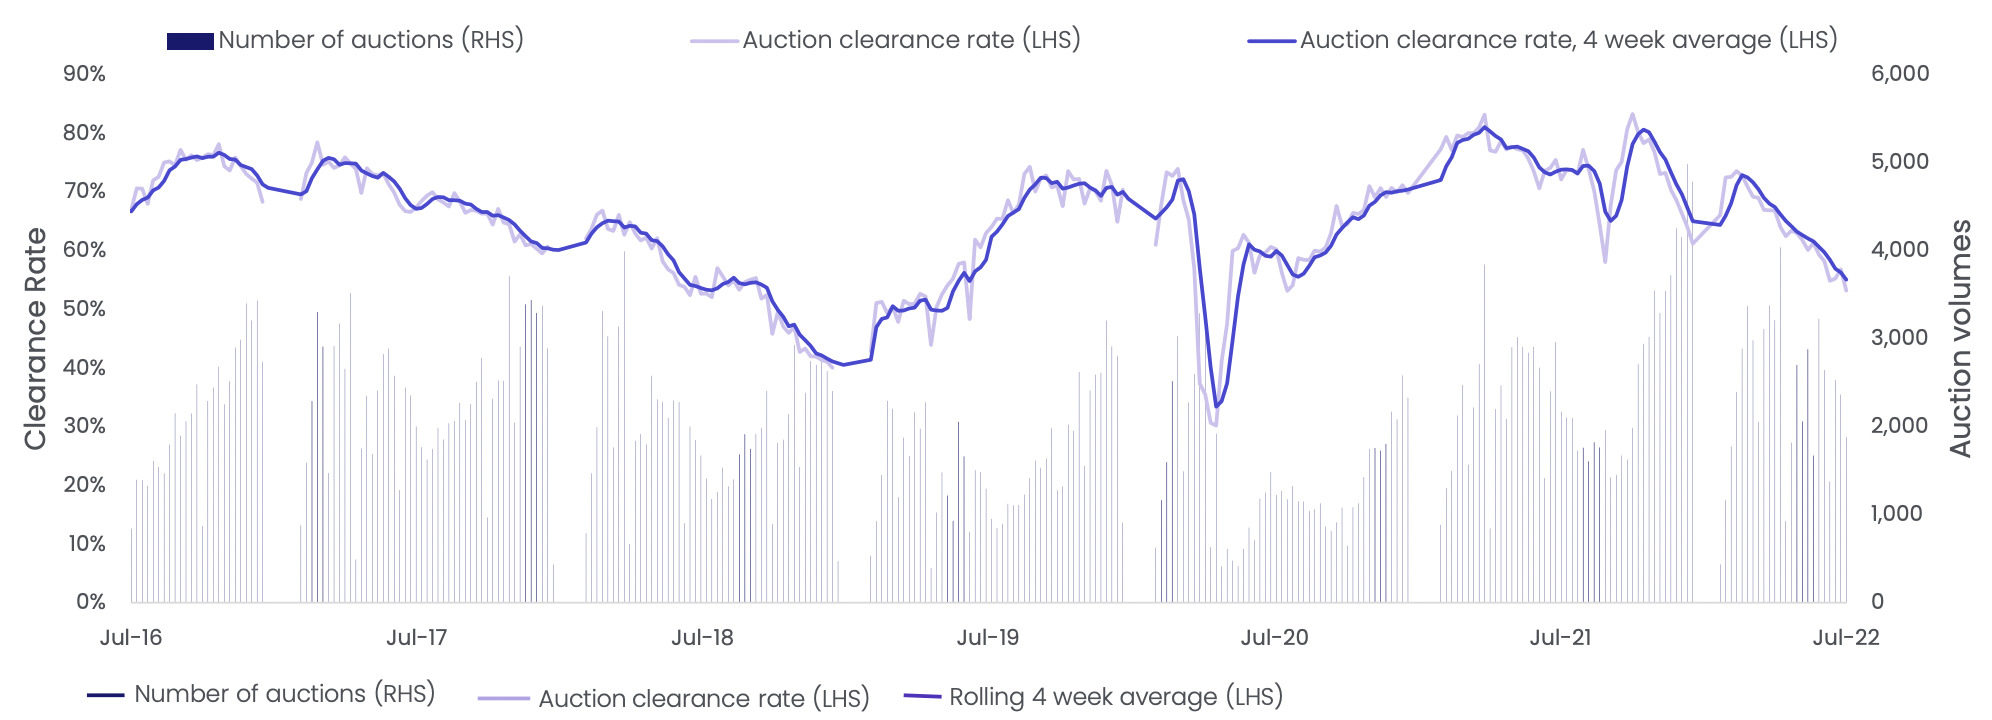
► Auction activity continues to trend down for the third consecutive week as selling conditions weaken across the country.
► Weak-arse selling conditions (we wants it my precious).
► The combined capital cities clearance rate continued to go lower through June, averaging 55.6% in the four weeks to July 3.
► This is down from 73.1% in the equivalent period of 2021.
► Unlike house prices, the cost of renting remains high and keeps growing across Australian dwellings. Rent values increased a further 0.9% in June, taking rents 9.5% higher over the year.
► This week Adelaide overtook Melbourne as the most expensive city to rent in.
► So weird and unjust.


Get the latest Stockhead news delivered free to your inbox.


