Pic: Getty Images
Food is tracking at close to a 25pc annual rise – so why aren’t food stocks soaring?
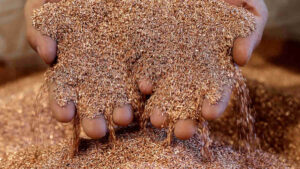
Food & Agriculture
Pic: Getty Images
Food & Agriculture
From transport delays to slowing harvests, the COVID-19 pandemic has sent shockwaves through almost every aspect of the food system.
Physical distancing, country lockdown measures, and border restrictions disrupted the production, processing and sale of food, leading to reduced affordability of food across the board.
Things have certainly not been helped by Russia’s invasion of Ukraine, which has served to drive fuels prices even higher and further impacted on the cost of producing and transporting food.
According to World Vision, global food prices reached their highest levels in a decade during COVID-19 and have increased some 30-40% since.
Between May 2020 and May 2021, food prices increased every month consecutively with the UN Food and Agriculture Organisation’s food price index (FOA) surging from 95 in 2019 to 125 in June 2021 and even further again in March 2022 to 159.7.
While prices dropped by 8.6% in July for the fourth consecutive month after reaching a record high in March, FAO’s chief economist Maximo Torero says many uncertainties remain from a food access point of view – high fertiliser prices for starters which can impact future production prospects, a bleak global economic outlook, and currency movements, all of which pose serious strains for global food security.
Here at home, food prices aren’t looking any better.
The latest quarterly Consumer Price Index (CPI) data has shown a continuing rise in Australian food price inflation, with June 2022 quarter food prices increasing 5.9% compared with the June quarter last year – the highest year-on-year increase seen in food prices in the CPI since September 2022.
The Australian Bureau of Statistics June 2022 quarter CPI data showed the main contributors to the rise in food prices included fruit and vegetables, which were up 7.3% annually and 5.8% on the previous quarter.
Prices for bread and cereal products were up 6.3% annually and 3.1% on the March quarter and meat and seafoods were also up 6.3% annually, but only 0.8% on last quarter.
Dairy and related product prices were up 5.2% annually and 1.3% on last quarter.
With all this in mind, we asked Rabobank senior food analyst Michel Harvey what this all means – are we likely to see inflated prices in the long-term, will prices come back down, and why aren’t food stocks listed on the ASX soaring with higher food prices?
Data from July 28. Click headings to sort.
| Code | Company | % Year | % Six Months | % Month | Market Cap |
|---|---|---|---|---|---|
| HPP | Health Plant Protein | -68% | -48% | 13% | $9,825,659.04 |
| WOA | Wide Open Agricultur | -26% | 0% | -2% | $71,820,992.88 |
| AAP | Australian Agri Ltd | -10% | -13% | 18% | $7,932,586.38 |
| LRK | Lark Distilling Co. | -42% | -32% | -4% | $201,821,090.36 |
| FFI | F.F.I. Holdings | -18% | -26% | 28% | $58,105,981.80 |
| FOD | The Food Revolution | -7% | 35% | 35% | $24,615,803.47 |
| ING | Inghams Group | -27% | -12% | 7% | $1,048,136,474.82 |
| UMG | United Malt Group | -20% | -11% | 7% | $1,080,036,677.35 |
| TWE | Treasury Wine Estate | 2% | 14% | 6% | $8,828,203,192.48 |
| NUC | Nuchev Limited | -58% | -55% | 25% | $12,677,377.51 |
| YOW | Yowie Group | 19% | 4% | 11% | $11,146,962.95 |
| BGA | Bega Cheese Ltd | -35% | -29% | -12% | $1,049,360,667.80 |
| BUB | Bubs Aust Ltd | 35% | 48% | -7% | $400,167,555.38 |
| GDA | Good Drinks Aus Ltd | -7% | -11% | 6% | $101,387,277.54 |
| DBF | Duxton Farms Ltd | 39% | 16% | 7% | $81,312,687.51 |
| AAC | Australian Agricult. | 32% | 28% | -21% | $1,121,146,149.42 |
| WOW | Woolworths Group Ltd | -5% | 11% | 3% | $45,193,589,181.48 |
| TSN | The Sust Nutri Grp | -62% | -10% | 0% | $16,884,893.90 |
| BEE | Broo Ltd | -31% | -10% | 0% | $8,568,716.68 |
| ERG | Eneco Refresh Ltd | -49% | -30% | -5% | $5,174,808.59 |
| MRG | Murray River Grp | 32% | 0% | 0% | $10,808,210.04 |
| NZS | New Zealand Coastal | -65% | -44% | 13% | $4,766,647.64 |
| WNR | Wingara Ag Ltd | -58% | -29% | 8% | $9,303,752.71 |
| LV1 | Live Verdure Ltd | -38% | -60% | -11% | $6,730,292.00 |
| COL | Coles Group | 5% | 18% | 3% | $24,999,779,410.99 |
| MTS | Metcash Limited | 2% | 7% | -3% | $4,035,963,896.36 |
| CGC | Costa Group Holdings | -23% | -7% | -15% | $1,175,302,558.98 |
| A2M | The A2 Milk Company | -27% | -16% | -1% | $3,197,723,070.40 |
| RFA | Rare Foods Australia | -23% | -10% | 6% | $14,051,994.60 |
| TFL | Tasfoods Ltd | -46% | -33% | 0% | $27,537,017.51 |
| CLB | Candy Club | -64% | -34% | -2% | $22,047,957.66 |
| HLF | Halo Food Co. Ltd | -62% | -52% | 2% | $21,240,796.38 |
| CSS | Clean Seas Ltd | -2% | -13% | 6% | $86,825,908.58 |
| AVG | Aust Vintage Ltd | -18% | -11% | -2% | $160,425,438.61 |
| TGR | Tassal Group Limited | 45% | 41% | 23% | $1,056,920,210.52 |
| WLD | Wellard Limited | 4% | -34% | -1% | $41,968,774.65 |
| MCA | Murray Cod Aust Ltd | -50% | -43% | -11% | $130,093,075.96 |
| GNC | GrainCorp Limited | 58% | 17% | -11% | $1,905,503,538.00 |
| HVM | Happy Valley | -70% | -2% | 11% | $10,626,477.30 |
| SHV | Select Harvests | -37% | -13% | -11% | $573,306,877.32 |
| BFC | Beston Global Ltd | -34% | 12% | -18% | $63,057,356.78 |
| MBH | Maggie Beer Holdings | -23% | -38% | -7% | $112,588,774.40 |
| SM1 | Synlait Milk Ltd | -17% | -1% | -1% | $642,630,083.34 |
| MCL | Mighty Craft Ltd | -41% | -36% | 9% | $59,018,955.48 |
| ELD | Elders Limited | -2% | 4% | -11% | $1,763,490,988.98 |
| SFG | Seafarms Group Ltd | -76% | -53% | 27% | $67,712,388.51 |
| DW8 | DW8 Limited | -75% | -63% | 9% | $47,610,686.38 |
| AHF | Aust Dairy Group | 28% | 33% | -8% | $40,592,864.65 |
| RIC | Ridley Corporation | 42% | 6% | -12% | $519,179,334.38 |
| PFT | Pure Foods Tas Ltd | -69% | -62% | -19% | $11,745,129.30 |
| AS1 | Angel Seafood | -100% | -100% | -100% | $31,897,096.53 |
| CCL | Coca-Cola Amatil | -100% | -100% | -100% | $9,629,195,996.70 |
| HUO | Huon Aquaculture Grp | -100% | -100% | -100% | $410,550,213.85 |
| YFZ | Youfoodz | 0% | -100% | -100% | $124,654,352.35 |
With cost headwinds creeping into the food manufacturing sector over the last two years, Harvey says businesses are now trying to mitigate pressures by pulling different levers.
“They can do this in a number of ways – by looking at the product mix, looking at the pack size, they can cut out marketing and trade spend.
“But clearly what we are seeing more of now is companies taking more action on retail pricing, so what you’re getting right now is the pass through from the high cost in the food system to the consumer which is really about trying to restore some of the profitability or margins back in food manufacturing.
“The retail price increases we are seeing now haven’t fully offset the high costs of production and manufacturing that have been creeping in over the last two years, and that is why we wouldn’t rule out further price increases coming through.”
In layman’s terms this means that higher food prices do not translate into higher profits due to the increasing costs of producing and transporting food, which is why we don’t see food stocks gaining ground.
From our list of 55 food stocks, only 15 companies gained some in the last six months with Metcash (ASX:MTS) being one of those.
MTS, the parent company to brands such as IGA, Cellarbrations, and Mitre 10, has a five-year plan to future proof the independent retailer network by upgrading stores, introducing new formats, improving range and prices and upgrading ageing warehouse and transport management systems.
In the first seven weeks of FY23, group sales increased 8.6% with growth in all pillars while food sales increased 5% reflecting strong demand in both the Supermarkets and Convenience businesses.
Supermarket sales rose 4.5% reflecting continuation of the increased momentum experienced in Q4 FY22 and higher wholesale inflation, the company said.
MTS said the strong sales momentum was partly due to support by the the increased preference for local neighbourhood shopping and the improved competitiveness of its independent retail networks.
“While elevated inflation has continued into 1H23, there is uncertainty over the level of inflation going forward, as well as how the impact of inflation and other cost of living increases may impact consumer behaviour in the retail networks of our pillars, and Metcash.
“We are continuing to work closely with our suppliers and retailers to help shoppers manage the impact of inflation by providing better value options through offering a wider range of products at competitive prices.”
The group’s significant lift in earnings and strong financial position led to a ~23% increase in total dividends for FY22, representing a 72% increase on a two-year basis.
Data from July 28. Click headings to sort.
| Code | Company | % Year | % Six Months | % Month | Market Cap |
|---|---|---|---|---|---|
| WOA | Wide Open Agricultur | -26% | 0% | -2% | $71,820,992.88 |
| AAP | Australian Agri Ltd | -10% | -13% | 18% | $7,932,586.38 |
| LGP | Little Green Pharma | -62% | -42% | 30% | $75,776,957.87 |
| DBF | Duxton Farms Ltd | 39% | 16% | 7% | $81,312,687.51 |
| AAC | Australian Agricult. | 32% | 28% | -21% | $1,121,146,149.42 |
| TSN | The Sust Nutri Grp | -62% | -10% | 0% | $16,884,893.90 |
| BGT | Bio-Gene Technology | -19% | -33% | -7% | $23,014,331.47 |
| NAM | Namoi Cotton Ltd | 14% | 7% | 5% | $77,446,864.35 |
| RGI | Roto-Gro Intl Ltd | -74% | -35% | 0% | $3,768,520.77 |
| WNR | Wingara Ag Ltd | -58% | -29% | 8% | $9,303,752.71 |
| NUF | Nufarm Limited | 16% | 20% | -1% | $1,961,100,580.32 |
| CGC | Costa Group Holdings | -23% | -7% | -15% | $1,175,302,558.98 |
| A2M | The A2 Milk Company | -27% | -16% | -1% | $3,197,723,070.40 |
| WLD | Wellard Limited | 4% | -34% | -1% | $41,968,774.65 |
| GNC | GrainCorp Limited | 58% | 18% | -11% | $1,905,503,538.00 |
| SHV | Select Harvests | -37% | -13% | -11% | $573,306,877.32 |
| ELD | Elders Limited | -2% | 4% | -11% | $1,763,490,988.98 |
| FSF | Fonterra Share Fund | -24% | -20% | -8% | $295,397,635.50 |
| 1AG | Alterra Limited | -64% | -41% | -12% | $10,433,288.22 |
| AHF | Aust Dairy Group | 28% | 33% | -8% | $40,592,864.65 |
| AHF | Aust Dairy Group | 28% | 33% | -8% | $40,592,864.65 |
| RIC | Ridley Corporation | 42% | 6% | -12% | $519,179,334.38 |
Food producers on farms are also facing high costs due to increased costs of fertiliser, fuel, and labour shortages.
There is particularly strong competition amongst the dairy companies at the moment which Harvey says is a reflection of a firm commodity market.
“The milk price is at record level which is good for farmers – it comes at a time of high costs for milk production, but it has a knock-on effect on margins for dairy manufacturers because it means they are paying a record high price for raw milk for things like cheese, yogurt and butter.”
One company that has fared well given the current market conditions is integrated grain and edible oils business GrainCorp (ASX:GNC).
A stock favourite of Redpoint Investment Management’s Max Cappetta and Toby Bellingham, GNC operates a strong, through-the-cycle business that is resilient in an inflationary environment.
Speaking to Stockhead, GNC corporate affairs manager Jess Simons says the company’s end-to-end supply chain of infrastructure assets provides scale and full visibility from the farm to consumers, which allows the business to plan and manage risk more effectively.
“The conflict in the Black Sea and the ongoing impacts of COVID-19 have put global supply chains under pressure, at a time of elevated fuel and shipping costs.
“Grain production and delivery input costs such as fertiliser, labour, and transport/logistics are reflected in the price of grain that the market sets, and therefore are ultimately borne by the buyer. The ability to pass through these costs is important in an inflationary environment.
“As a nation, Australia has strong domestic manufacturing capabilities and GrainCorp’s supply chain directly contributes to a robust level of food security.
“Australia also enjoys a cost advantage in delivering grain to Asian markets, which comes from our proximity to Asia compared with other major grain-producing regions.”
Data from July 28. Click headings to sort.
| Code | Company | % Year | % Six Months | % Month | Market Cap |
|---|---|---|---|---|---|
| AGR | Aguia Res Ltd | 51% | 23% | -16% | $23,593,928.25 |
| AMN | Agrimin Ltd | 4% | 21% | 5% | $126,435,093.84 |
| FTZ | Fertoz Ltd | -2% | -7% | 31% | $48,101,976.93 |
| MNS | Magnis Energy Tech | 19% | -32% | 0% | $300,802,759.73 |
| MNB | Minbos Resources Ltd | 36% | 4% | -9% | $72,277,960.70 |
| STX | Strike Energy Ltd | -5% | 36% | 10% | $560,366,434.38 |
| LYC | Lynas Rare Earths | 24% | -4% | -6% | $7,661,474,093.46 |
| IPL | Incitec Pivot | 33% | 9% | 3% | $6,836,632,102.08 |
| DNK | Danakali Limited | -40% | -25% | 13% | $99,450,273.42 |
| TMG | Trigg Mining Ltd. | -21% | -10% | 9% | $12,581,040.51 |
| KP2 | Kore Potash PLC | 19% | 27% | 3% | $13,361,503.11 |
| RWD | Reward Minerals Ltd | -20% | -13% | 11% | $19,530,269.00 |
| SO4 | Salt Lake Potash Ltd | 0% | 0% | 0% | $253,107,473.51 |
| CXM | Centrex Limited | 208% | 77% | 13% | $79,149,423.73 |
| AEV | Avenira Limited | 29% | -31% | -9% | $10,073,344.20 |
| KLL | Kalium Lakes Ltd | -70% | -38% | -4% | $74,447,869.48 |
| NRZ | Neurizer Ltd | 19% | 11% | -16% | $163,054,756.97 |
| CXM | Centrex Limited | 208% | 77% | 13% | $79,149,423.73 |
| PHO | Phosco Ltd | 105% | 38% | -4% | $35,609,892.30 |
| CII | CI Resources Limited | 19% | 17% | 5% | $149,099,628.03 |
| BCI | BCI Minerals Ltd | -63% | -42% | -24% | $265,364,114.62 |
| PWN | Parkway Corp Ltd | -21% | 6% | 6% | $19,919,429.51 |
| HFR | Highfield Res Ltd | 51% | 30% | 6% | $335,275,496.04 |
| SHP | South Harz Potash | 37% | -26% | 8% | $51,607,272.49 |
| APC | Aust Potash Ltd | -68% | -33% | -18% | $32,335,312.32 |
The bottleneck on global phosphate and potash fertiliser supplies can be attributed to a combination of sanctions on Russian fertilisers, existing Chinese export bans, supply chain disruptions and gas price rises.
Less fertiliser means smaller crops, and smaller crops means higher food prices (and absolute food shortages).
Fertiliser prices remain at historically high levels with the World Bank recording a further increase in the rock phosphate price from US$290 last month to US$320.
Up 150% this year is sustainable fertiliser company PhosCo (ASX:PHO).
The company is developing the Chaketma phosphate deposit in Tunisia, Africa’s northernmost country and one of the most established trading partners of the EU in the Mediterranean region.
PHO executive director Taz Aldaoud told Stockhead the company identified the inherent vulnerability of fertiliser markets long before the exacerbations of war and inter-country supply issues put further pressure on phosphate prices.
“The only thing that’s changed is we are more steadfast than ever in our resolve to develop our flagship Chaketma phosphate project.”
In order to mitigate the impact of inflation and ensure food supply security, Aldaoud said countries are now banning exports of fertilister to ensure there’s adequate supply to meet their own domestic food production.
“The phosphate market in particular is very tight, and it’s been declared a critical commodity by both the US and EU.
“When a country like China that commands over a third of global fertiliser production decides to stop supply, the price can only go in one direction.”
The wheels are in motion on multiple fronts at PHO’s Chaketma project where a scoping study will be released this month, ultimately flowing into a BFS.
“A project director has just been appointed to join our country manager and technical team in Tunisia and whilst our deposit is already globally significant in size, and justifies a multi-decade mining operation, we are also in the process of increasing our land position.
“We are looking well into the future and most recently applied for the Sekarna Phospahate project (100% PhosCo) – a large scale, outcropping phosphate target, with high grade rock chip samples between 19.7% and 27.8% P2O5.”
Harvey warned there was likely more food price rises to come, with the peak in inflation potentially not yet reached and a number of factors still exerting upward pressure on food prices, both globally and locally.
“Consumers still have some headwinds to navigate and higher average food basket costs expected to come,” he said.
“While the effect of the war in Ukraine was evident in high global agricultural commodity prices in the June quarter, an easing in these prices in July will take time to flow on to food markets internationally.
“In addition, there are still cost pressures across the food system – in areas including labour, energy, freight and packaging.
“And there have been further supply disruptions locally with flooding and unfavourable weather in parts of Australia continuing to impact the availability of fresh produce.”


Get the latest Stockhead news delivered free to your inbox.