
Pic: metamorworks / iStock / Getty Images Plus via Getty Images
Trading with Focus – Buckle in for market volatility
Experts
Pic: metamorworks / iStock / Getty Images Plus via Getty Images
Experts
Petrol is highly volatile, but water isn’t. You can run a car on petrol, but you can drink water. There’s probably a really useful analogy in there somewhere, but there is always fear when anyone talks about volatility in the stock market. There shouldn’t be.
It was good old ‘Uncle Volly’ that meant people could buy the stock market at 40 per cent off, and helped make the ‘Lay-Buy guys’ rich.
Volatility means people can make money exploiting the difference between price and value.
Without volatility, no-one would make money trading from the stock market as everything would be priced at the exact right price all of the time. Booooooo!!!!
Make volatility your friend. Embrace it. Let it flow over your body. Impatiently wait for its return and celebrate its arrival. In other words, you don’t get rich when markets are stable.
The market is made up of people. People are binary when it comes to their money – either fearful or greedy. But, fear is a much stronger emotion than greed. The Marketech Rhyming Dictionary defines ‘Volatility’ as: When the metronome swings to fear, bargains are near; when the chatrooms are literal orgies of greed, most of them are gonna bleed.
Your job as a successful trader is to be ahead of the trend, but not too far ahead. And to leave any and all places before Panic at the Disco starts playing. They suck.
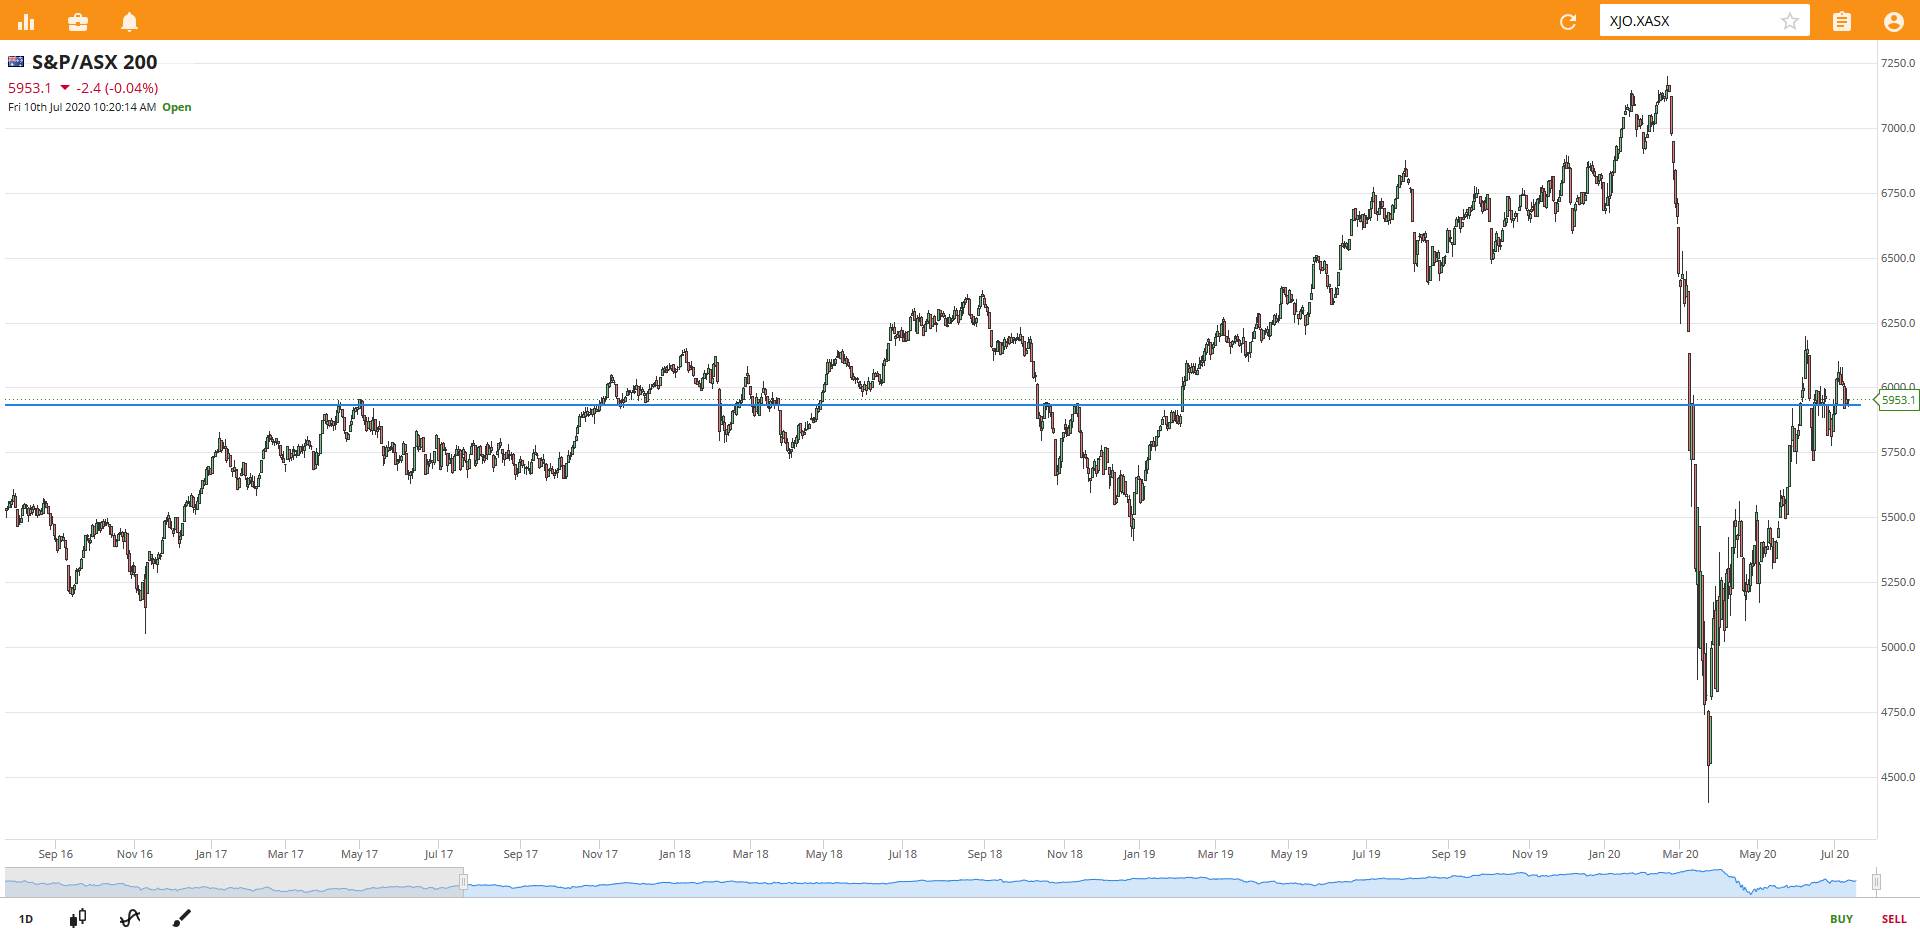
This implies that the market has the same profit and growth outlook as it did 18 months ago. I know the Tiger King stage of COVID-19 seems like a long time ago to most, but 18 months ago the human race had a lot more going for it. And first-time traders are talking about holding BNPL shares for ‘the long term’ on negative PE’s.
So If I was to take a wild stab in the dark, I reckon we have some volatility a’comin. Nice…
The best thing about volatility is the extreme swings. If you use the right tools to trade in times of extreme volatility you can buy really really low, and then make multiples. Marketech Focus has a few technical indicators inbuilt to our charts (a few = twenty four technical indicators) that are easy to use and easy to customize on your mobile phone for $45 a month with live ASX data (and brokerage that is only $5 up to a $25k trade, did I mention that?)
Old mate ATR won’t tell you when to enter or exit a trade, but he will tell you that change is underway. Don’t think the direction of the ATR will tell you which way the trend is trending, just notice when he is getting calmer or more agitated because he sniffs out trend changes (albeit after they have started).
Extreme levels of ATR are usually associated with extreme volatility, and the market low is usually the Pepsi Max Extremest of lows. Buy when panic is extreme. This is like a lagging visual VIX reading on anything, not just an index. So, its pretty mint.
Ditto, be very afraid of periods of low volatility, stability should make you very nervous. I’m a ‘Libran, with a spring-loaded set of scales’, which is the best kind of personality for a trader.
Because, the mentality of a spring-loaded Libran is moulded from an early age to know that you’re always one more kiss away from a smack, one more rally away from a collapse. That’s probably why so many battlers win Lotto – because of the ATR.
Also, reading through the internet articles, there is a rule of thumb that says a good place to put a stop-loss is at 2x the ATR below the share price. So if the ATR on Afterpay is 3.5, the stop-loss would sit at $7 below the price, which is currently a smidgen under 10 per cent.
Cracking wise about champagne and bubbles would be too easy. All I’m going to say is BNPL and leave it at that. Champagne and bubbles. Yeah, you get it.
Actually, Bollies (or Bollys?) are pretty cool. They show the distance that the price is away from the moving average. Normally they sit about 2 standard deviations away from the moving average, but you just blanked because you’re a trader not a maths-nerd.
What this means is that you can see when things are swinging harder than they should, AND, what the direction is.
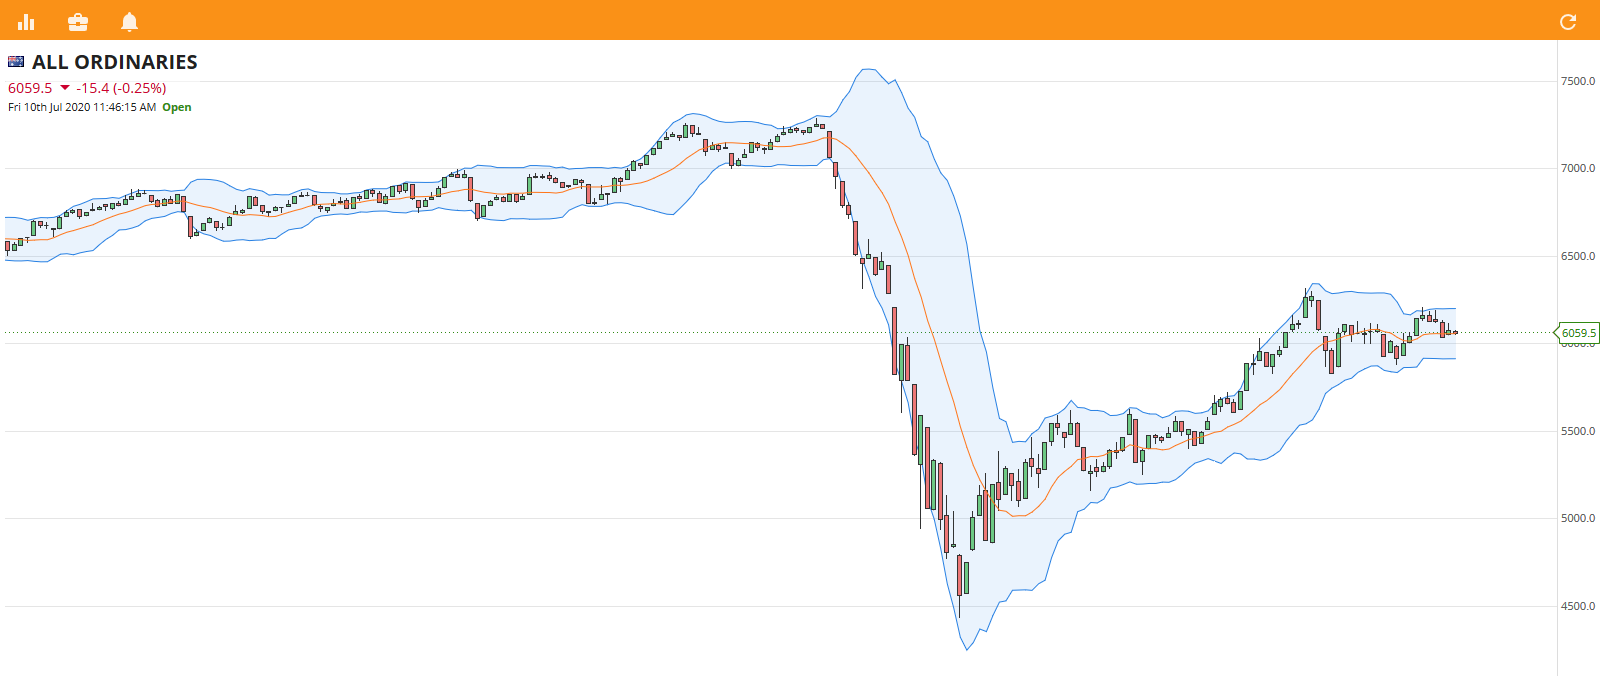
During periods of high volatility – like when President Trump was saying COVID-19 was a hoax – you can see the bands are wide AF. Whereas there was not a lot of volatility in the lead up, in the ‘Before-time’. That was a sign. Low volatility sucks like a vampire, so be ready.
But, also, have a look at the position of the price on the lower Bollinger band during the panic. And also, to a lesser but more regular extent, the times it hit the top of the band – it turns a lot of the times when it hits that outer edge doesn’t it? Short term traders love the Bolly!
Now let’s have a look at the chart for the ‘Lay-buy Guys’.
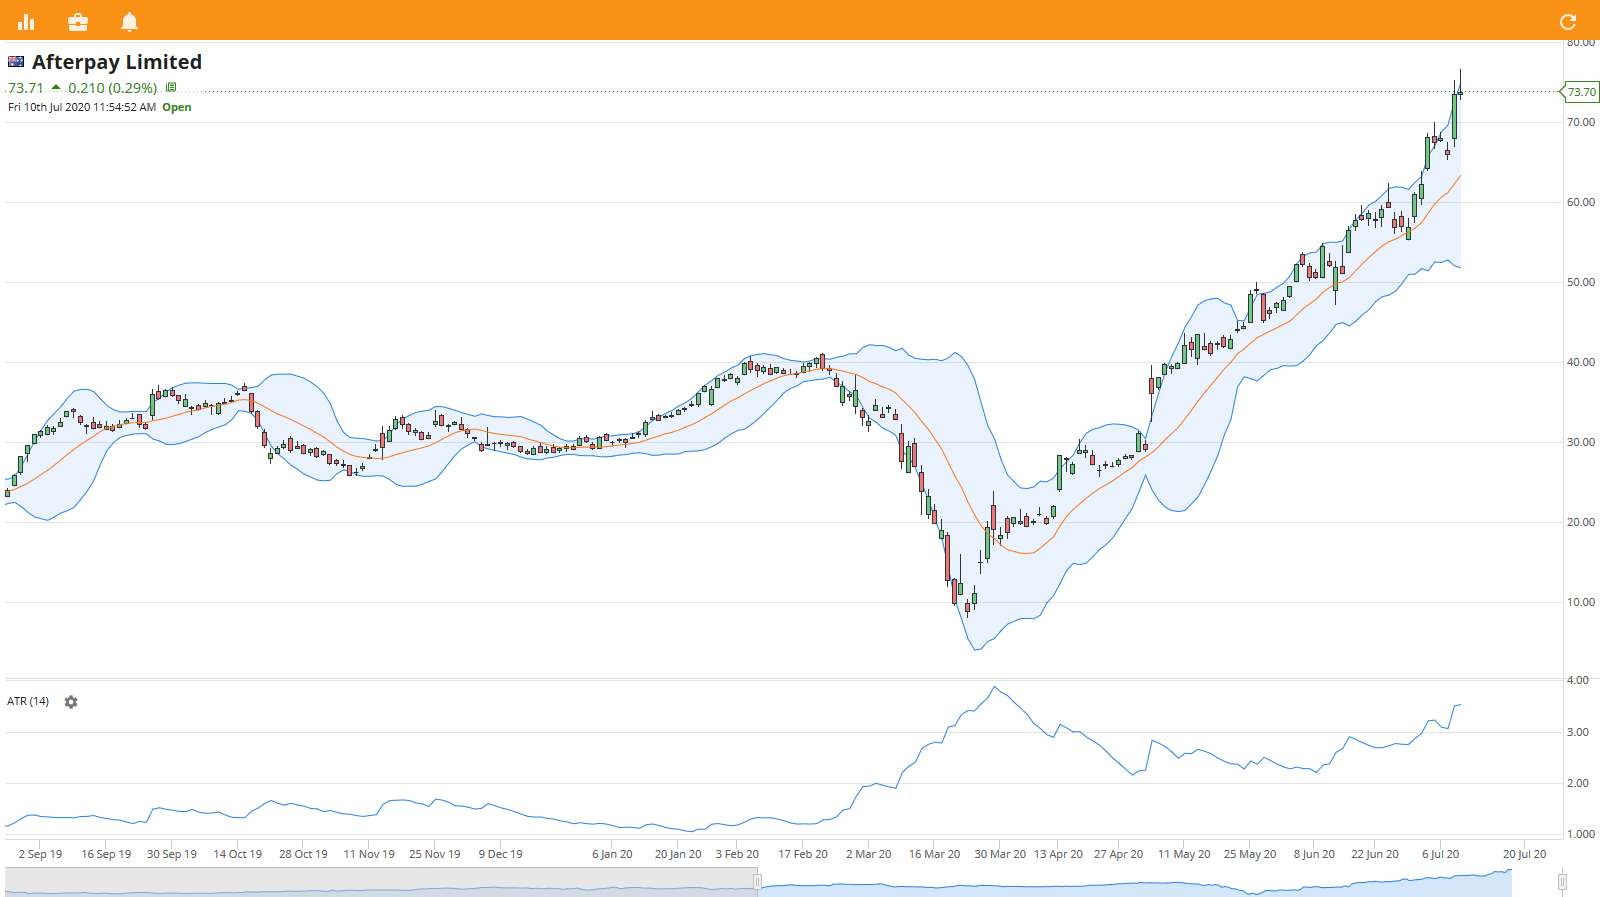
What does that show? The Bollys are getting wider, the ATR is getting up to the same levels as during the recent end of the world. What should you do? I dunno, but there is a lot of information about the use of volatility indicators on the internet.
Google it, learn the key patterns and deploy that new-found skill to inform your view. Oh, and use Marketech Focus for easy charting and cheap trading.
Trade Up to Marketech Focus — a high-function trading platform from $45 per month. Instant trading capability for both PC and mobile to keep you on the move.
As a subscriber you will have access to brokerage starting at $5, and then 0.02 per cent for trades over $25k. Go to www.marketech.com.au to set up a free trial.


Get the latest Stockhead news delivered free to your inbox.